- 1. Lay summary
- 2. Executive summary
- 3. Project outline
- 4. Introduction
- 5. Time trends in the Incidence and Prevalence of food allergy in England
- 5.1. Methods
- 5.2. Results
- 6. Hospital admissions and fatalities due to food anaphylaxis in the UK
- 7. Discussion
- 9. Appendix
1. Lay summary
Around 3-5% of the UK population are estimated to have a food allergy, which can put them at risk of serious and potentially life-threatening allergic reactions (anaphylaxis). Allergic reactions due to accidental consumption are common in people with known food allergy. However, fatal reactions happen so rarely (~1/100,000 person years) that learning more about fatal anaphylaxis is very difficult. Less severe reactions to food (for example, non-anaphylactic reactions and anaphylaxis which responds to first-line treatment) are more common (with an incidence of up to 1000 times greater than that for fatal food-related anaphylaxis),but obtaining accurate data relating to the circumstances of these reactions is currently not possible under the existing coding system used in the National Health Service (NHS). It is likely that many anaphylactic reactions to food are incorrectly coded, for example as non-anaphylactic reactions or as reactions to a non- food or unspecified trigger.
This situation presents two difficulties to those working to ensure the safety of food- allergic consumers: first, can NHS data be used to help understand how much of a problem food allergy and anaphylaxis is at a population level, and second, a lack of details in terms of the circumstances (for example, precise food trigger) of anaphylaxis reactions.
Our inability to identify those most at risk of truly life-threatening anaphylaxis, and the circumstances which lead to such reactions, represent a key barrier in protecting food- allergic consumers from severe reactions. This has implications for both medical practice and public policy: healthcare professionals, food businesses and regulatory authorities are forced to take a risk-averse approach to food allergy, since all those at risk of food- related anaphylaxis must be considered as being at risk of severe or fatal anaphylaxis.
In this analysis of NHS datasets, we report that:
-
Using data from England, the prevalence of food allergy is up to 4% in preschool- aged children, 2.4% in children and young people and 1% in adults.
-
The incidence and prevalence of food allergy may have doubled in the past decade, but this may also reflect greater awareness of food allergy amongst the public and healthcare professionals, rather than a true increase in disease.
-
The vast majority of healthcare visits for food allergy occur in general practice. Less than 3% of individuals with a diagnosis of food allergy attended Accident and Emergency during the study period, 2008-2018. Therefore, using hospital data in isolation to analyse patterns of health service utilisation with respect to food allergy and food hypersensitivity (FHS) may not provide a comprehensive overview.
-
Prescription of adrenaline auto-injector devices (AAI) are an important risk management intervention in people at risk of food-induced anaphylaxis. However, there is significant under-prescribing of AAI, with 40% of individuals with prior food-induced anaphylaxis not prescribed AAI and at least 59% not having AAI on repeat prescription.
-
Despite an increase in hospitalisation for food-induced anaphylaxis in the UK between 1998 and 2018, the case fatality rate (proportion of hospital admissions associated with a fatal outcome) has fallen, from 0.7% in 1998 to less than 0.3% in 2018.
-
An increasing proportion of fatal reactions are due to cow’s milk, which is now the most common single cause of fatal anaphylaxis in children.
Finally, the data highlight a crucial need to improve the diagnosis and correct coding of food allergy in the healthcare system, to better provide for those living with food allergy and address the significant impairment a diagnosis of food allergy has on health-related quality of life.
2. Executive summary
There is a general perception that food allergy is increasing in many countries, including in the UK. This is based on high rates of self-reported food allergy, and clear increases in surrogate measures such as prescription of low-allergy formula (for infants with possible cow’s milk allergy) or adrenaline autoinjectors (used to treat anaphylaxis reactions), or hospital admissions due to allergic reactions.
The consequences of a diagnosis of food allergy are significant. Food-allergic consumers must avoid the allergens they are allergic too, something which often results in increased food costs. The diagnosis also impacts on social activities, and causes anxiety due to fear of potential reactions. Fatal reactions due to food anaphylaxis are very rare, but also unpredictable: this also contributes to anxiety. It is therefore important to ensure that accurate data relating to food allergy and the risk of severe reactions are available, and can be properly communicated to the public.
In this analysis of UK health data, we investigated trends in the incidence (number of new diagnoses) and prevalence (frequency of existing cases) of food allergy in a large NHS dataset called the Clinical Practice Research Datalink (CPRD) Aurum dataset. As of September 2018, CPRD Aurum included 7 million patients, representing around 13% of the English population (Section 5 of this report). We applied 2 different strategies using food allergy diagnostic codes to define 2 patient cohorts, which we then analysed for new cases of food allergy (incidence) as well as period prevalence of food allergy during the study period.
Overall, 150,018 patients were included with a diagnostic code consistent with food allergy (“expanded definition”). 81% had a specific diagnostic code that was considered more likely to reflect true food allergy (“strict definition”). Using the former definition, the incidence of food allergy increased from 101.4 to 175.3 per 100,000 person-years (PYrs) between 2008 and 2017, with evidence of a dip in 2018. Applying a stricter diagnostic definition, the incidence of food allergy doubled from 75.8 to 159.5 individuals per 100,000 PYrs over the same time period. The increase was particularly prominent in children aged 5 years or under. Refining the criteria further by limiting cases to those with evidence of adrenaline autoinjector prescription (given that these are prescribed to individuals at risk of anaphylaxis), the increase in incidence was much less evident, with a small increase up to 2014, with a decrease in incidence thereafter.
We also evaluated the prevalence of food allergy during 2008-2018 and found that prevalence had also increased using all definitions. Using the “strict” definition for food allergy, prevalence increased from 0.4% in 2008 to 1.1% in 2018. Prevalence was highest in children under 5 years (4.0% in 2018), with a rate of 2.4% in older children and 0.7% in adults.
Separately, we extracted NHS data relating to hospital admissions for anaphylaxis in the UK. We assessed time trends, age and gender distributions for anaphylaxis admissions caused by food (and, for comparison, non-food triggers), and how these compare to fatalities due to food-anaphylaxis, for the time period 1998-2018 (Section 6 of this report).
Food-induced anaphylaxis represented 29.4% of reported anaphylaxis admissions and increased significantly from 1.23 to 4.02 admissions per 100,000 population per annum over the time 1998-2018, an annual increase of 5.7%. The largest increase was seen in children compared with adults. There were 152 fatalities identified over the same time period where the cause was very likely to have been food-induced anaphylaxis. The case fatality rate (number of fatalities as a proportion of hospital admissions) for food anaphylaxis more than halved from 1998 to 2018, from 0.7% to 0.3% or less (depending on case definitions). At least 86 (46%) fatalities were triggered by peanut or tree nuts.
However, cow’s milk was responsible for 26% of fatalities in young people under age 16 years, and represented the most common single allergen responsible for fatal anaphylaxis in this age group.
We also analysed NHS prescriptions data for the same time period, and found that prescriptions for AAI had increased 11% per annum. Analysing the CPRD dataset, 27% of patients with a primary care diagnostic code of food allergy were prescribed AAI, a proportion which reached 47% in children and young people aged 5-19 years, but then decreased in adults. National guidelines recommend that individuals with prior food- induced anaphylaxis are prescribed AAI as a risk management strategy. It is therefore of greater concern that 40% of patients with prior anaphylaxis were not prescribed AAI, and at least 59% did not have AAIs on repeat prescription. Overall, AAI prescription was statistically more common in more affluent areas (determined on the basis of Index of Multiple Deprivation, a measure of area deprivation).
Of note, the vast majority of healthcare visits for food allergy in the NHS occur in primary care. Under 3% of food-allergic individuals attended Accident and Emergency during the study period, 2008-2018, and 88.4% were managed exclusively in general practice. Therefore, using hospital data in isolation to analyse patterns of health service utilisation with respect to food allergy and FHS may not provide a comprehensive assessment.
In summary, this detailed analysis of UK health data is the first to evaluate the rate of food allergy at a population level in the UK. Using 2018 data, the prevalence of food allergy ranged from 4% in preschool-aged children (age under 5 years), around 2% in school-aged children and young people (5 to <20 years) and 0.7% in adults. The estimated prevalence in adults is unlikely to have fully captured more mild phenotypes of food allergy (such as Pollen Food Allergy Syndrome estimated to have a prevalence of around 2% in the UK population). Prevalence continues to increase, however the number of new diagnoses of food allergy may be plateauing, in particular cases of food allergy where the affected individual is assessed as being at risk of anaphylaxis. Hospital admissions for food-induced anaphylaxis have continued to increase since 1998, however the case fatality rate is decreasing. In school-aged children, cow’s milk is now the commonest single cause of fatal anaphylaxis.
3. Project outline
Imperial College London was contracted by the Food Standards Agency (Contract Number FS101222) to undertake research to use existing NHS datasets to better understand trends in FHS reactions, and in particular, food-induced anaphylaxis, in the UK.
Specifically, the project’s objectives were to:
-
Assess the available data relating to NHS encounters (hospitalisations, visits to healthcare facilities including primary care and Accident & Emergency departments) due to FHS, in order to evaluate trends in food FHS in England (and where data is available, for the devolved nations).
-
Attempt to validate the different codings used in primary and secondary care for FHS, to guide future use of NHS datasets to monitor trends in epidemiology.
-
Establish a prospective registry for food and non-food related anaphylaxis in the UK, in partnership with the European Anaphylaxis Registry.
-
Identify food-allergic adults who have experienced a previous severe anaphylactic reaction requiring admission to an intensive care unit in England, to describe the triggers and circumstances which resulted in these severe reactions.
This report presents the results and analysis from (i) and (ii) to help inform future FSA activities.
Note that the original contract was to analyse data up to (and including) 2018. The COVID-19 pandemic resulted in delays in data availability and analysis. The impact of the pandemic not only affected NHS health encounters and hospital admissions, but also coding of these episodes. Although an attempt was made to further extend the analyses to 2020, due to these concerns these data are not included in this report.
4. Introduction
Food hypersensitivity, including food allergy, continues to attract significant attention at a public health level and in the media. FHS encompasses both immune-mediated food hypersensitivity (such as food allergy) and non-immune food intolerances.
Food allergy is not the same as food intolerance: food allergies are caused by the immune system reacting to an otherwise harmless food protein, something known as an allergen. Non-allergic food hypersensitivity reactions (which include food intolerances) are usually caused by the gut being unable to breakdown certain food sugars, resulting in abdominal discomfort such as lactose intolerance, which is caused by too little enzyme in the gut which breaks down lactose sugar. The key distinction is that the immune system is not involved, so food intolerances do not result in life-threatening, immune-mediated reactions.
The most common type of food allergy involves the Immunoglobulin E (IgE) antibody, which recognises the food allergen and triggers an immune response. It is also the commonest cause of potentially life-threatening allergic reactions (anaphylaxis), a serious systemic hypersensitivity reaction that is usually rapid in onset and may cause death (Turner et al., 2019).
IgE-mediated food allergy is widely accepted to be increasing in many regions of the world – by the public, healthcare professionals and scientists (Simons & Sampson, 2008). This is based on high rates of self-reported allergy, and clear increases in surrogate measures such as prescription of hypoallergenic formula products or AAI “pens” which are used in the event of anaphylaxis.
The simplest approach to understanding food allergy prevalence is to evaluate rates of self-reported allergy, or frequency of positive diagnostic tests. Food allergy diagnostics are generally more sensitive than specific: IgE sensitisation is much more common than true clinical reactivity. Self-reported allergy is even less reliable, with studies consistently showing that many more people report a FHS than are confirmed at a double-blinded food challenge, the gold-standard diagnostic test. By relying on self-report or simple diagnostics, food allergy can appear to be much more common than it really is (Turner & Boyle, 2014).
One alternative is to evaluate anaphylaxis admissions to medical facilities, since these perhaps represent a more definitive surrogate of the occurrence of unintended allergic reactions to food (although it is likely that many, if not most accidental reactions do not result in a visit to hospital). Significant increases in hospitalisations due to food- anaphylaxis have been reported globally (Turner et al., 2020), however, it is unclear whether this trend is continuing to increase, and if so, how this relates to the incidence of fatal reactions. There are also a number of reasons that someone may or may not be admitted to hospital due to anaphylaxis (for example, differences in local guidelines), so these issues must be considered when analysing these data.
There is an increasing tendency for mainstream media to report routinely-collected data relating to food anaphylaxis (BBC, 2020), but often with little attempt to understand the issues and limitations of using such data; this is partly due to a lack of awareness over the coding systems used, for example admissions due to “allergy” may include day-case admissions for allergy testing, irrespective of whether this results in an allergic reaction. As a consequence, these reports often contrast with the available published data in the scientific literature.
In general, epidemiological data relating to IgE-mediated food allergy is of a better quality than that for other FHS (with the exception of coeliac disease), because the latter is a heterogeneous group of conditions which in general lack clear diagnostic criteria.
Individuals with IgE-mediated food allergy are at risk of potentially life-threatening allergic reactions (anaphylaxis).
The most recent estimate for the prevalence of food allergy in the UK that does not involve self-reporting comes from the FSA-funded Enquiring about Tolerance (EAT) study (Perkin et al., 2016). This study recruited, from the general population, 1303 exclusively breastfed infants aged 3 months who were then randomly assigned to either the early introduction of six allergenic foods (peanut, cooked egg, cow’s milk, sesame, whitefish, and wheat; early-introduction group) or to the current UK practice of exclusive breastfeeding to approximately 6 months of age (standard introduction group). At 3 years, 7.1% (42/595) participants in the standard-introduction group developed an allergy to at least one allergen, which gives an estimate of the background rate of food allergy in this age group in the UK. For specific allergens, the rate of allergy at 3 years in the standard-introduction group was 2.5% for peanut and 5.5% for egg. However, all participants had to be exclusively breast-fed at study inclusion, thus these figures may only represent prevalence in this selected population and may not apply to the wider population.
Arguably the best estimates to assess a change in prevalence of food allergy in the UK came from an FSA-funded cohort study on the Isle of Wight (IoW). The Food Allergy and Intolerance Research (FAIR) birth cohort was established between 2001 and 2002 (n=969), with children followed prospectively up to age 10 years. At 3 years of age, the rate of peanut allergy was 1.2%, increasing to 1.5% at age 10 years. In the earlier IoW birth cohort study, established in 1989 (n=1456), the rate of peanut allergy at age 3 and 10 years was 0.6% (Venter, Patil, et al., 2016). Taken together, these data imply an increase in the prevalence of peanut allergy between 1989 and 2002.
The Prevalence of Infant Food Allergy (PIFA) study was funded by the FSA and formed the UK cohort of the EuroPrevall project, an EU-funded study which assessed the epidemiology of food allergy in Europe. PIFA recruited 1140 babies between 2006 and 2008, and reported that the prevalence of FHS by 2 years of age was 5.0%. Reported rates for IgE-mediated food allergy were 2.6% with 2.1% reacting to hens’ egg and 0.7% to peanut. For non-IgE-mediated food allergy, prevalence was 2.4% (cows’ milk, 1.7%) (Grimshaw et al, 2015). Families were invited back for follow-up at age 6-10 years; in the UK, 60% of families declined. In the vast majority of cases, follow-up was further limited by an absence of objective testing to evaluate for ongoing clinical allergy. Overall, the estimated prevalence for food allergy in European children aged 6-10 years was between 1.4% and 3.8%, with no objective data available to inform UK-specific prevalence estimates (L. Grabenhenrich et al., 2020).
In the “Time trends in the Incidence and Prevalence of food allergy in England” project (Section 5 of this report), we used an alternative approach to evaluate the epidemiology of FHS. The CPRD collects anonymised patient data from a network of General Practitioner (GP) practices across the UK. The dataset encompassed 40 million patients, including 13 million currently-registered patients. We analysed data within CPRD to assess the number of patients with various diagnostic codes associated with food allergy and/or FHS, and evaluated how this has changed over the past 10 years. We also undertook a substudy to look at those patients who had also attended hospital due to their FHS diagnosis, to better understand the reliability of the FHS codings being used in General Practice.
In Section 6 of this report (entitled “Hospital admissions and fatalities due to food anaphylaxis in the UK”), we extend previously reported findings for trends in anaphylaxis hospitalisations in England and Wales between 1992 and 2012 (Turner et al., 2015). We also include data from Northern Ireland and Scotland in order to provide a more comprehensive analysis of UK trends which can be matched to fatality data for food- induced anaphylaxis. We explored time trends in all-cause and specific-cause anaphylaxis events in different age groups and by gender, and evaluated changes in the case fatality rate for food-induced anaphylaxis in the UK.
5. Time trends in the Incidence and Prevalence of food allergy in England
5.1. Methods
5.1.1. Data source
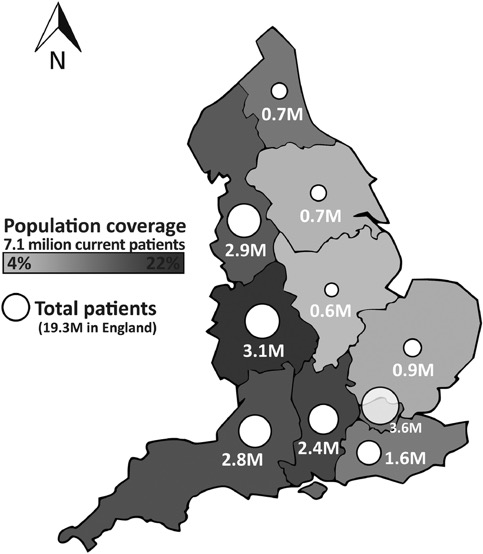
The CPRD collects de-identified patient data from a network of GP practices across the UK. Primary care data are linked by a third party to a range of other health related data to provide a longitudinal health dataset which is representative of the UK population with respect to age, gender, BMI, and ethnicity (CPRD, 2021; Wolf et al., 2019). CPRD Aurum is one of the databases managed by CPRD, and consists of routinely-collected data from primary care practices in England, capturing diagnoses, symptoms, prescriptions, referrals and tests for over 13 million patients (over 7 million currently-registered patients) as of September 2018 (Figure 1) (Wolf et al., 2019). Data from the majority of GP practices are eligible for linkage to national secondary care databases as well as deprivation and death registration data. The data recorded include information on patient demographics, clinical events and diagnoses, details of specialist referrals, hospital admissions, results of laboratory tests, and prescriptions issued.

5.1.2. Study population
The study population consisted of patients with primary care data in CPRD Aurum from 1 January 2008 to 31 December 2018 (although we included patients with data in CPRD Aurum up to 31 December 2019 in order to account for delays in data entry for the final study year). Patients had to have “acceptable” patient status within CPRD, with data contributed by a general practice which met internal CPRD “up to standard” criteria for research purposes at the study start.
We searched the CPRD Code Browser (consisting of READ 2, SNOMED-CT and local EMIS® codes) for codes consistent with a possible diagnosis of FHS or food allergy.
Since these codes might be assigned for a variety of different reasons (ranging from a consultation in primary care to request for AAI prescription or emergency department visit for anaphylaxis), we then used these codes to define two cohorts:
-
a cohort defined using an “expanded” range of codes which would be consistent but not necessarily indicative of a diagnosis of food allergy. These codes excluded those which clearly indicated a non-allergic pathology (such as a food intolerance or coeliac disease).
-
a cohort based on a more narrow or “strict” list of food allergy codes, which implied a higher likelihood of food allergy. These codes include those where a food allergy was specified to a “priority allergen” as defined by the Food and Agriculture Organization of the United Nations/World Health Organization in Codex Alimentarius[1] (rather than to a food which rarely is associated with an immune- mediated food allergy), or descriptions which implied prior anaphylaxis.
The categorisation of these codes was undertaken independently by two specialists in food allergy, with discrepancies resolved by discussion and input from a third clinician. The coding assignment is shown in Table 1. It is important to note that the assignment of any given code is not dependent on the existence of a relevant diagnostic test.
Finally, in order to provide further confidence as to the likelihood of a given diagnostic code implying probable food allergy, we then further applied a restriction to individuals classified as being in the “strict”-defined cohort, in terms of prescription of an AAI device at least once during the study period. AAI are often prescribed to patients with food allergy at risk of anaphylaxis, a serious and potentially life-threatening allergic reaction, and might therefore imply a higher likelihood of true, IgE-mediated food allergy.
Finally, we also searched for patients in Aurum with an International Classification of Diseases-10 (ICD-10) coding consistent with food allergy in the first two diagnostic positions in any finished consultant episode in the NHS Hospital Episode Statistics (HES). HES contains several databases which contain details of all admissions, Accident and Emergency (A&E) and outpatient appointments at NHS hospitals in England.
5.1.3. Outcomes and analyses
The outcomes used were the incidence and prevalence of food allergy in the Aurum dataset, stratified by age group, gender and calendar year of diagnosis. The age bands used were 0-4 years, 5-9 years, 10-14 years, 15-19 years, 20-24 years, 25-34 years, 35-44 years and ≥45years. Although data from 1 January 2008 to 31 December 2019 were used to define the study cohorts, incidence and prevalence were estimated 2008-2018 in order to account for delays in data entry for the final study year.
Incidence was calculated as the number people with a new diagnosis of food allergy (and without a previous relevant diagnosis) during the study period (Table 2). Incidence is expressed as the number of cases per 100,000 PYrs, together with 95% confidence intervals (95%CI) using exact Poisson distributions. Incidence rates were calculated by dividing the number of incident cases by the total person-time contribution, and were calculated both overall and by calendar year, gender at birth and by age band.
Prevalence was calculated according to one-year period prevalence, that is the proportion of persons with “active” coding consistent with FHS or food allergy in any calendar year (Table 2). Prevalence was calculated as a percentage together with 95% CIs using exact Binomial distributions. The denominator was the number of patients in the study population at the midpoint (1st July) of the year of interest. An “active” code was defined as individuals with a diagnosis of FHS/food allergy or an adrenaline prescription after a food allergy diagnosis. AAI typically have a shelf life of 12-18 months, so we coded a 1-year lag period for AAI prescriptions before and after each food allergy diagnosis. By evaluating for “active allergies”, we attempted to assess those individuals who might have outgrown their food allergy and thus were no longer prescribed AAI.
5.1.3.1. Analysis of Patient Pathways
As part of the analysis, we sought to better understand the different types of healthcare encounters (visits) that food-allergic individuals have with the NHS facilities, and how these “patient pathways” intersect with each other. For this exploratory analysis, we applied data science techniques to evaluate the different patterns of patient encounters: for example, whether patients initially see a General Practitioner (GP) before being referred for specialist input through an outpatient consultation; while other individuals might present to A&E in the first instance, and then consult with their GP prior to referral to hospital as an outpatient.
It was not possible to identify appropriate encounters relating to FHS (as opposed to food allergy) and distinguish these from non-FHS-related reasons for health encounters; therefore, this analysis was limited to those with a food allergy diagnosis.
The patient pathways analysis is likely to have been confounded in patients born prior to 2008, since the analysis would only use data from 2008 onwards. Therefore, we also included a number of sensitivity analyses:
-
on the basis that most allergies present after introduction of solid foods (currently recommended from around age 6 months according to UK guidelines), analysis limited to those individuals who were born in the 12 months prior to or during the study period (and thus would have all patient visits recorded).
-
the same cohort as in (i), further restricted to those with at least 5 years of visit data within the dataset.
5.2. Results
The number of patients included in the CPRD Aurum dataset, and thus form the denominator for each year of the study period, are shown in Table 3, and the demographics of the overall cohort in Table 4. Details in terms of geographic distribution (as of September 2018) are in Figure 1.
We then evaluated the frequency of different diagnostic codes for FHS and food allergy in the CPRD Aurum dataset. These codes did not change during the study period. The top 25 codes identified are shown in Table 5 for FHS and in Table 6 for food allergy.
With respect to FHS, the most frequent coding was “nut allergy” (11.3%) followed by coeliac disease (10.6%). Excluding codes which implied either coeliac disease or an intolerance, the most frequent codes were “food allergy”, “peanut/nut allergy” and “egg allergy”. Reassuringly, over 80% of individuals with a food allergy diagnostic code had at least one diagnostic code which was used to define the “strict” cohort.
5.2.1. Study cohort
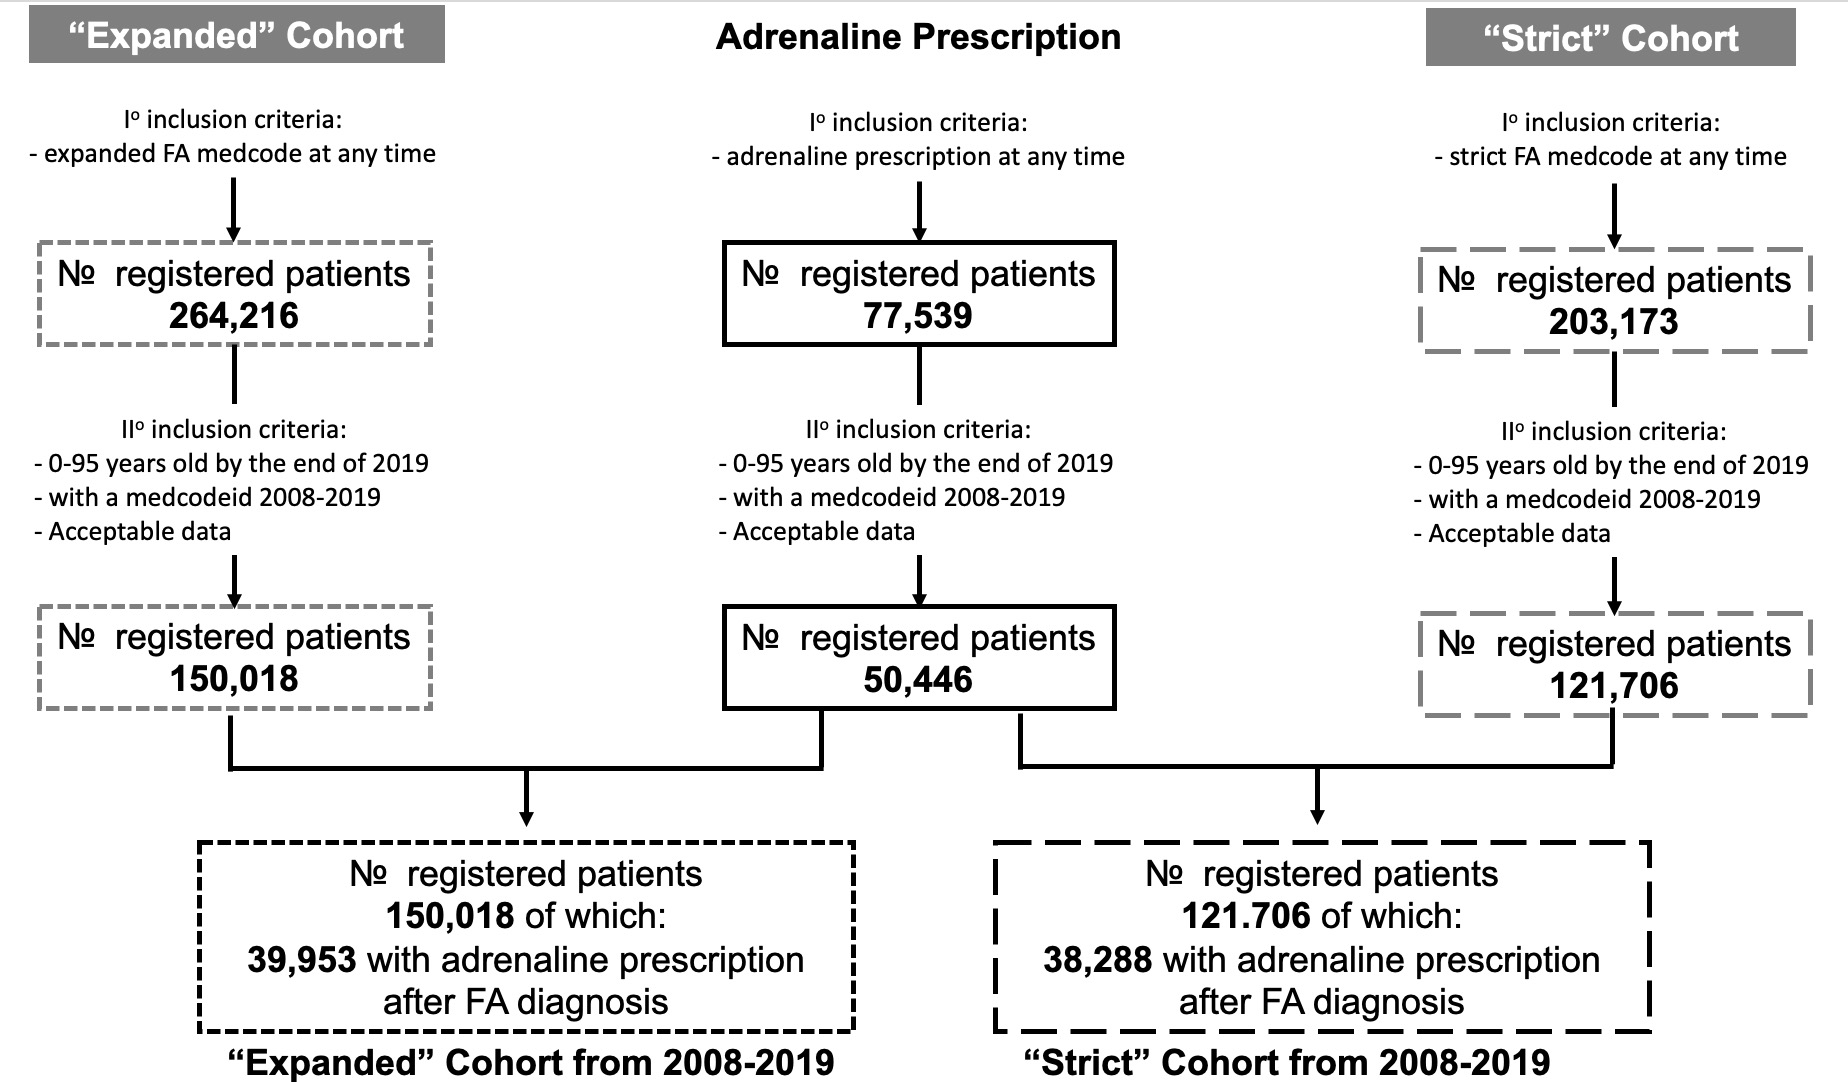
Using the criteria outlined above, we defined 4 cohorts of individuals who met the inclusion criteria outlined for analysis, summarised in Figure 2 and Table 7.
The vast majority (95.8%) of patients with a prescription for AAI were included in the “strict” cohort, which provides reassurance that the “strict” definition was more likely to capture those individuals at risk of food-induced anaphylaxis.

5.2.2. Incidence of food hypersensitivity and food allergy
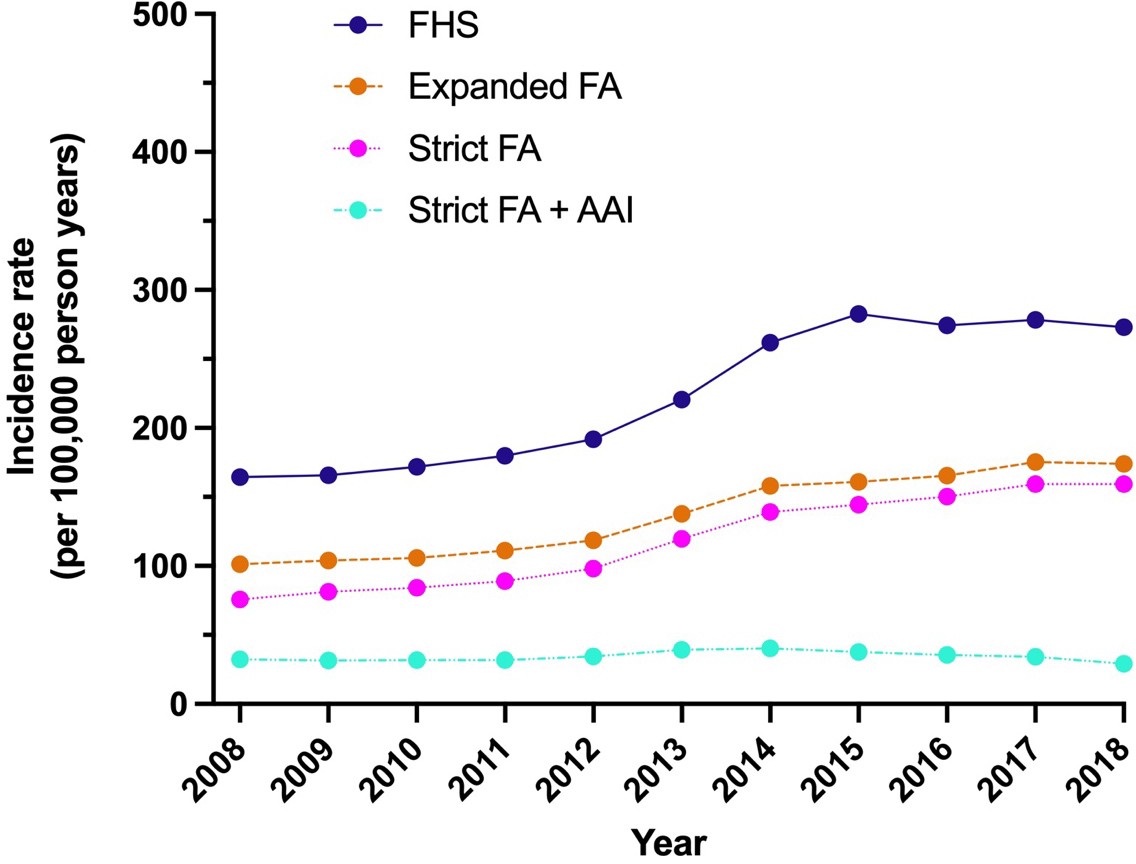
The estimated incidence of FHS increased by 72%, from 164.3 to 282.7 per 100,000 PYrs between 2008 and 2015, plateauing thereafter (Figure 3). A more modest increase was evident when considering the change in incidence of food allergy (both using “expanded” and “strict” definitions), with an increase evident throughout the study period until 2018.
Using the “expanded” diagnostic definition, the incidence of food allergy increased by 72%, from 101.4 to 174.0 per 100,000 PYrs between 2008 and 2018. Using the “strict” definition of food allergy, incidence doubled from 75.8 to 159.5 individuals per 100,000 PYrs. This is summarised in Table 8, with further data in Table S1 in Appendix 9.1.
Applying the strictest definition of food allergy (“strict” definition with AAI prescription), this trend was not evident, with incidence essentially stable over the same time period (32.3 per 100,000 PYrs in 2008, 29.3 per 100,000 PYrs in 2018) (Figure 3).
__of_food_allergy_(fa)_according_to__exp.jpeg)
5.2.2.1. Incidence by gender
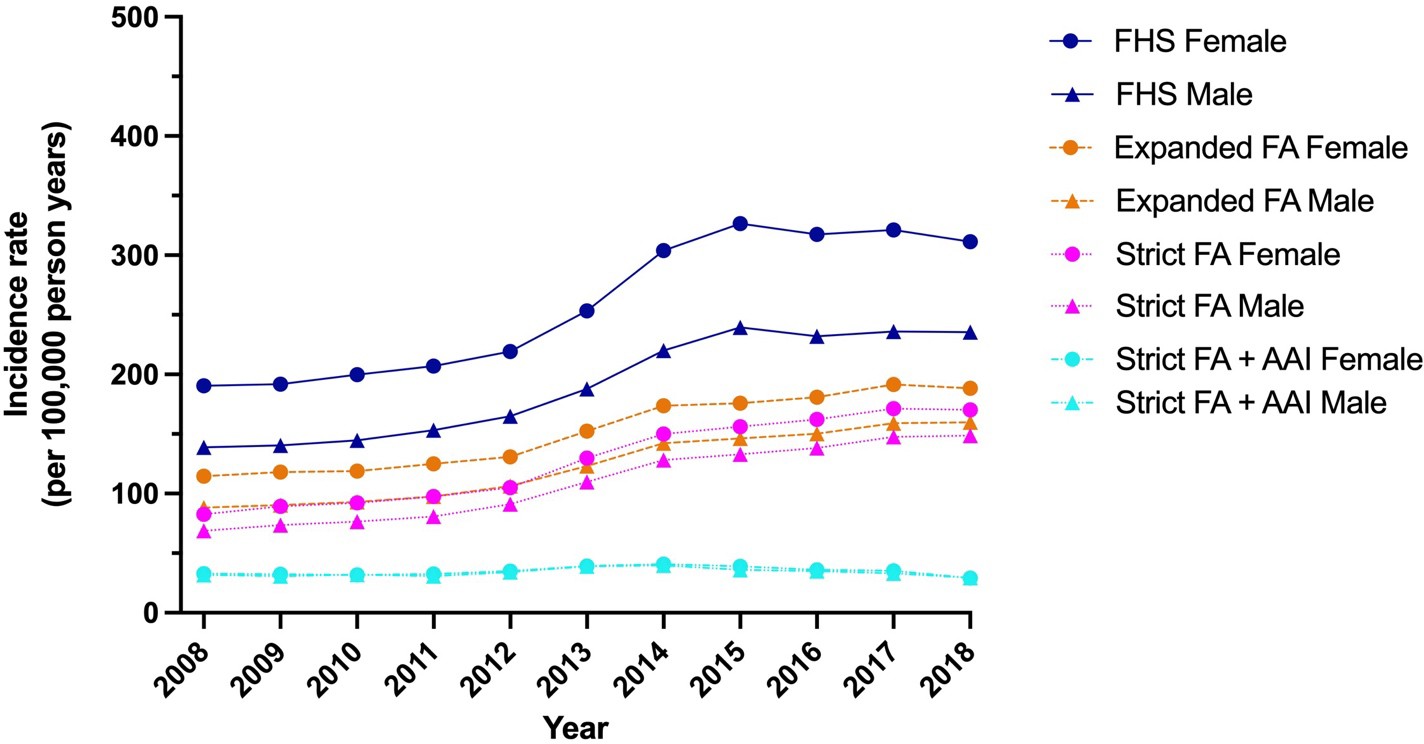
In general, estimated incidence was higher in females than males for all the definitions used, apart from when analysing patients with the strictest definition (“strict” definition of food allergy with AAI prescription), where the incidence of new cases was similar. The overall trend in incidence was the same by gender across the study period (Figure 4, Table S2 in Appendix 9.1).
_and_food_allergy_(fa)_according_to__exp.jpeg)
5.2.2.2. Incidence of food allergy by age
For this analysis, children under 5 years of age were considered separately. This is because there are significant concerns as to possible over-diagnosis of non-IgE- mediated food allergies, particularly to cow’s milk protein, in <5 years (Munblit et al., 2020). In addition, AAI prescription in this age cohort is more limited and less consistent, particularly at diagnosis, since many children at this age are below the lower weight indication for prescription of AAI (Johnson et al., 2012), and also have a higher probability of outgrowing their food allergies by school age.
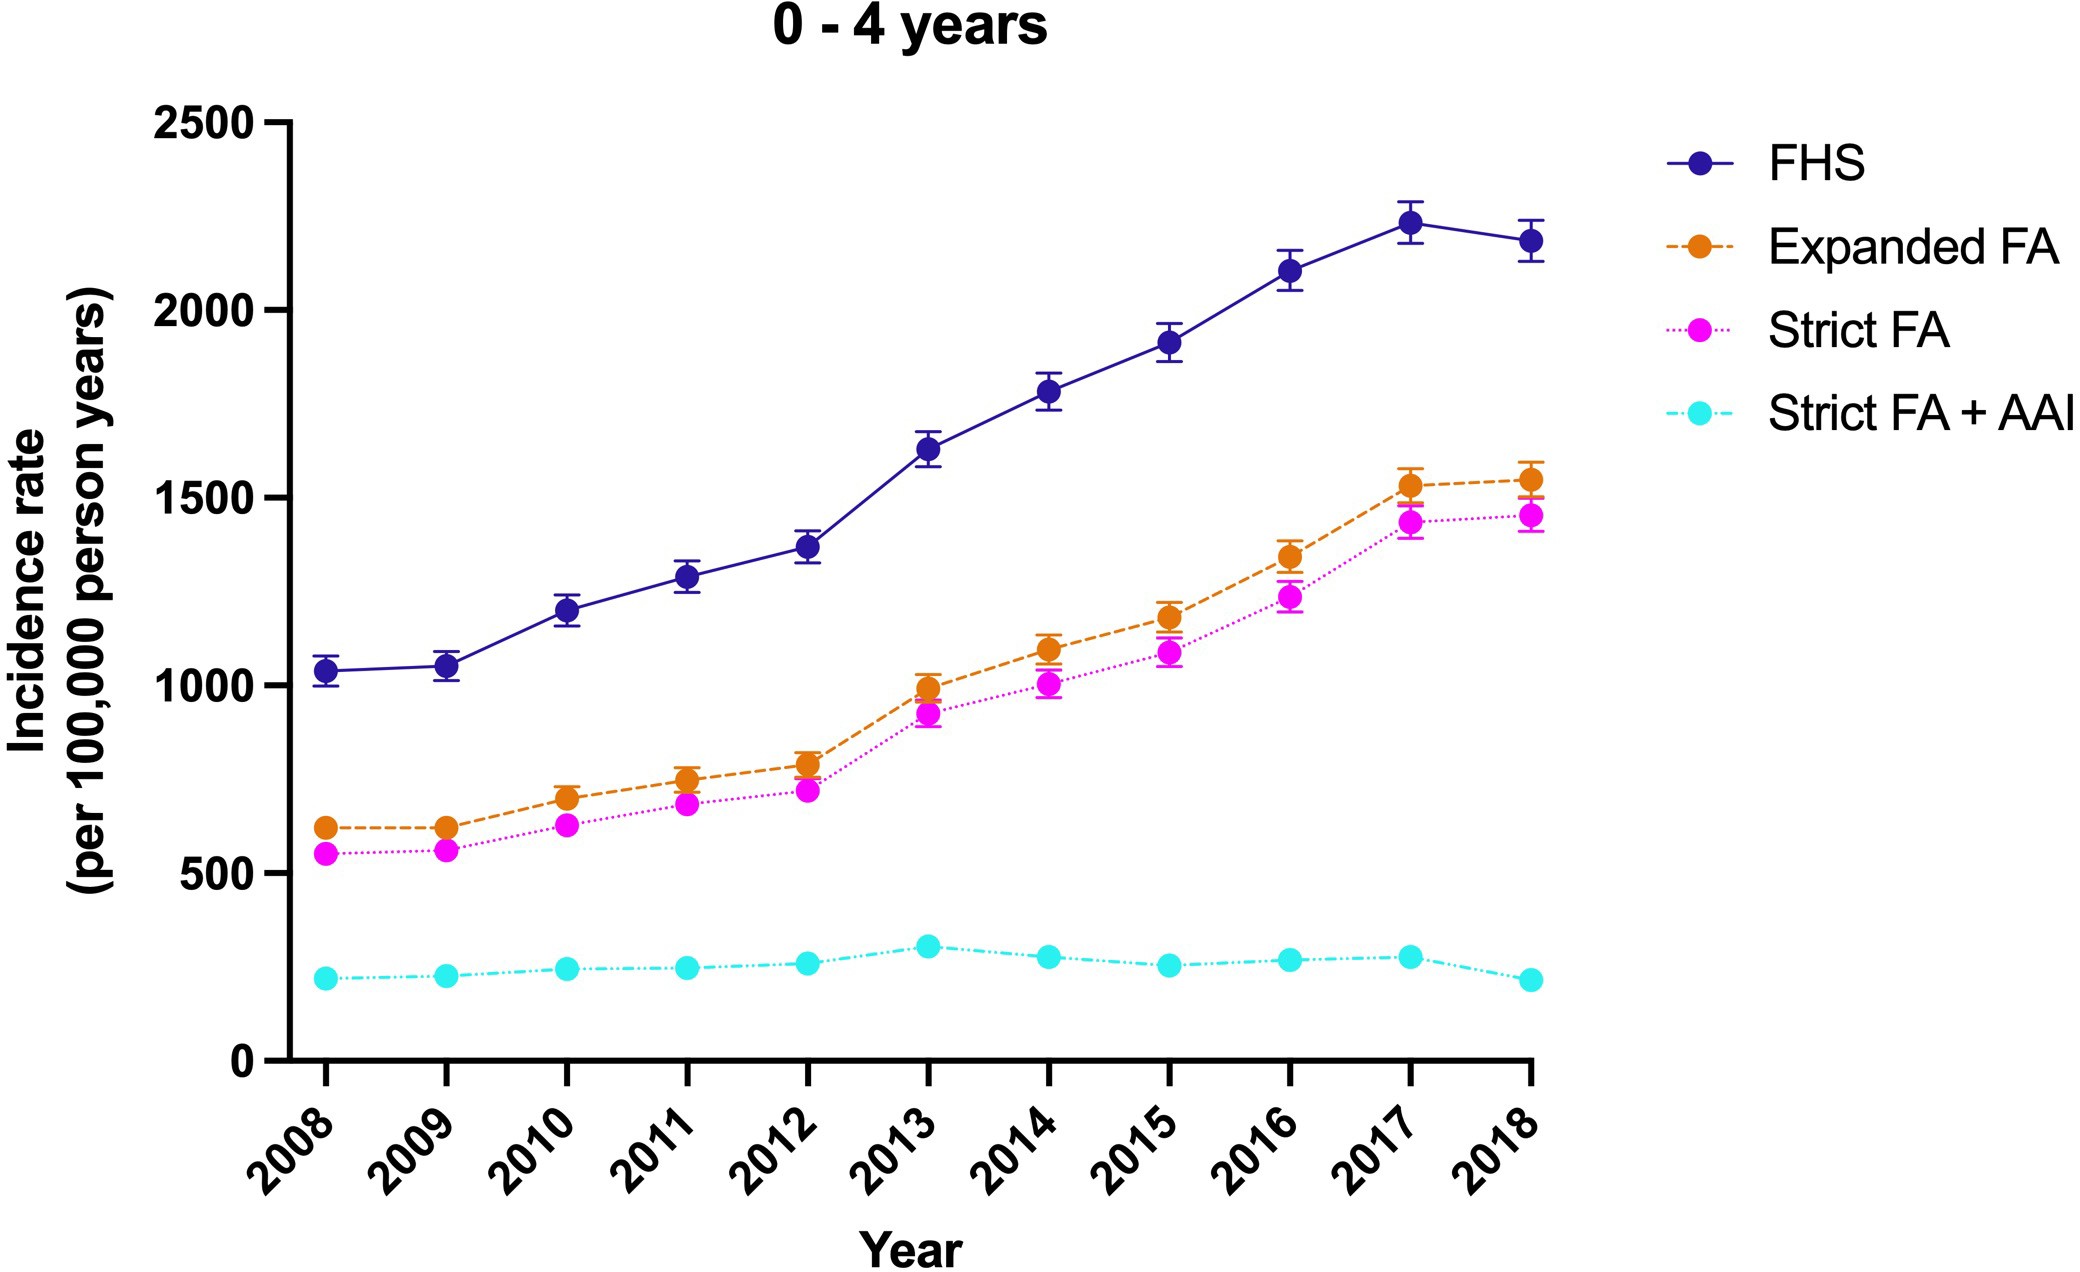
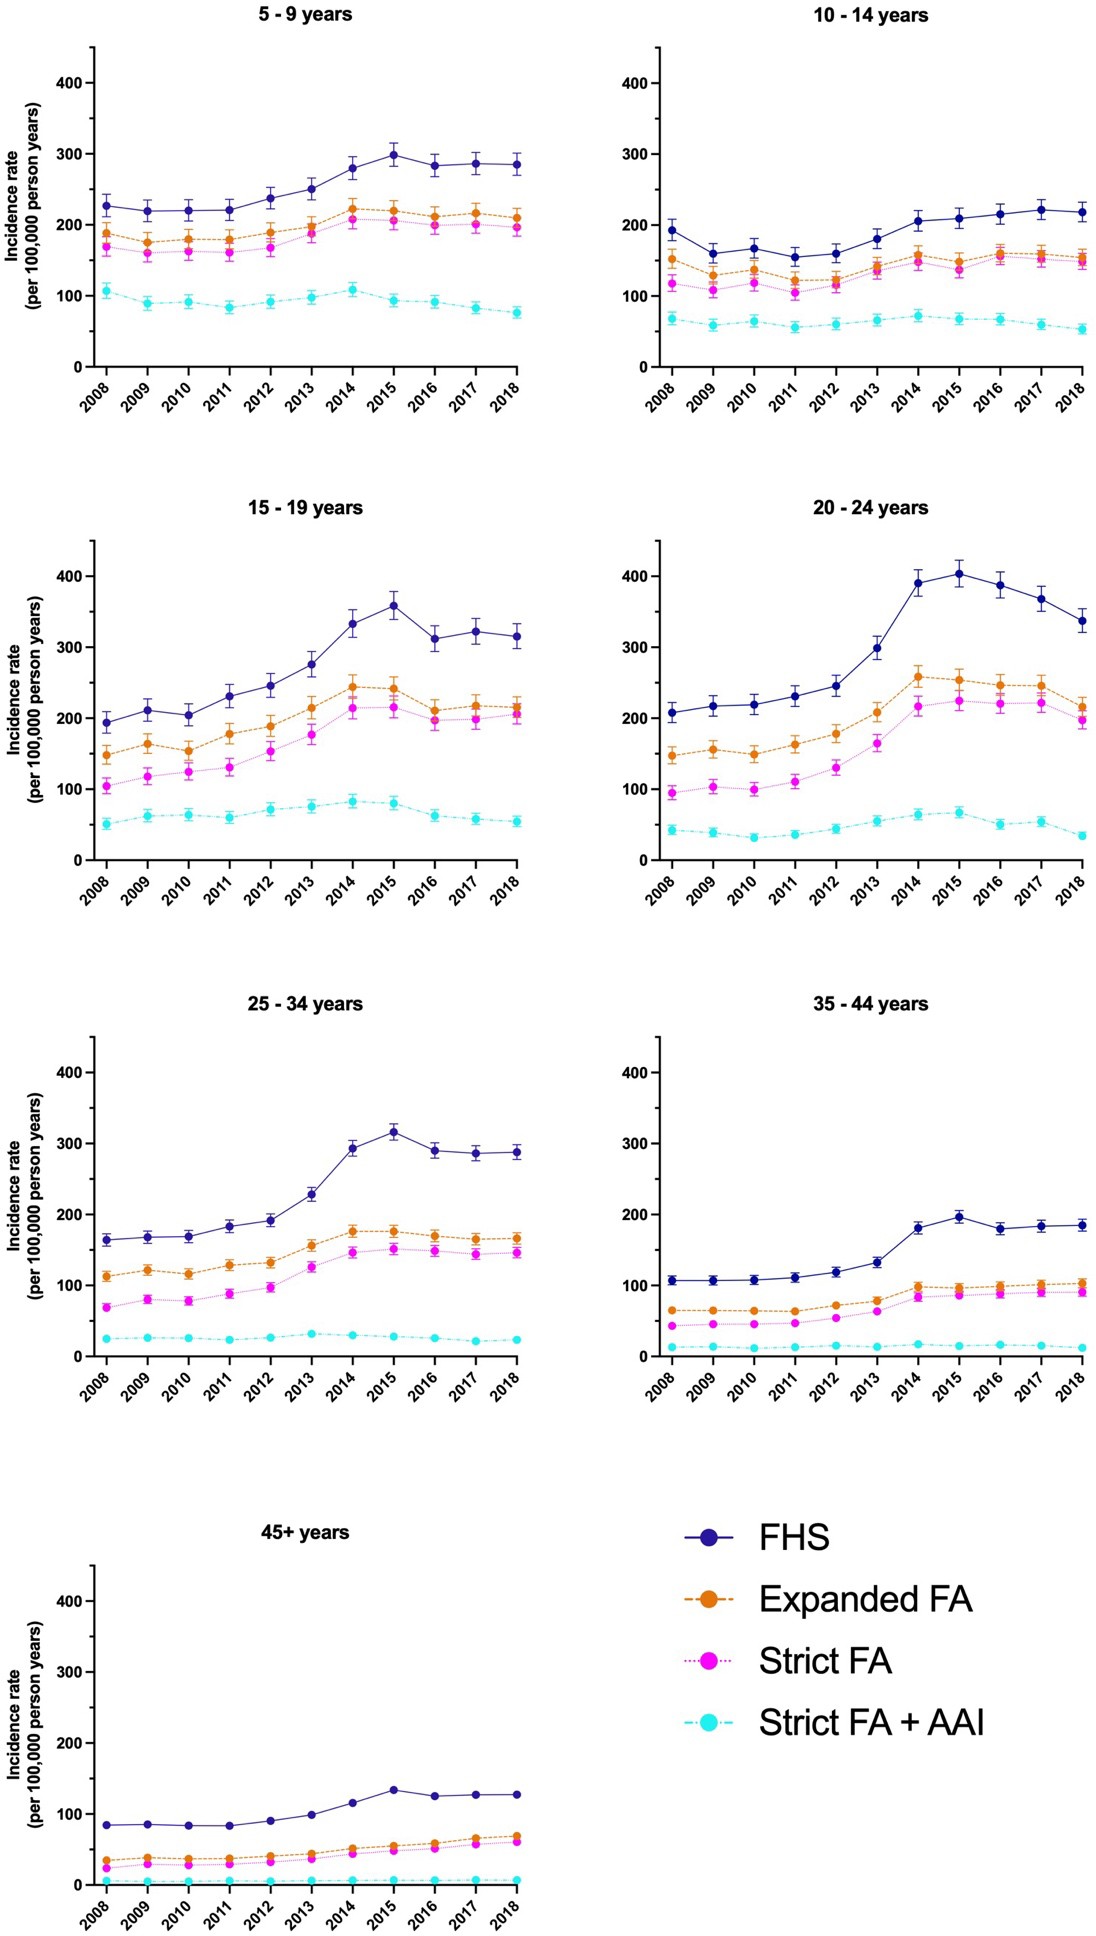
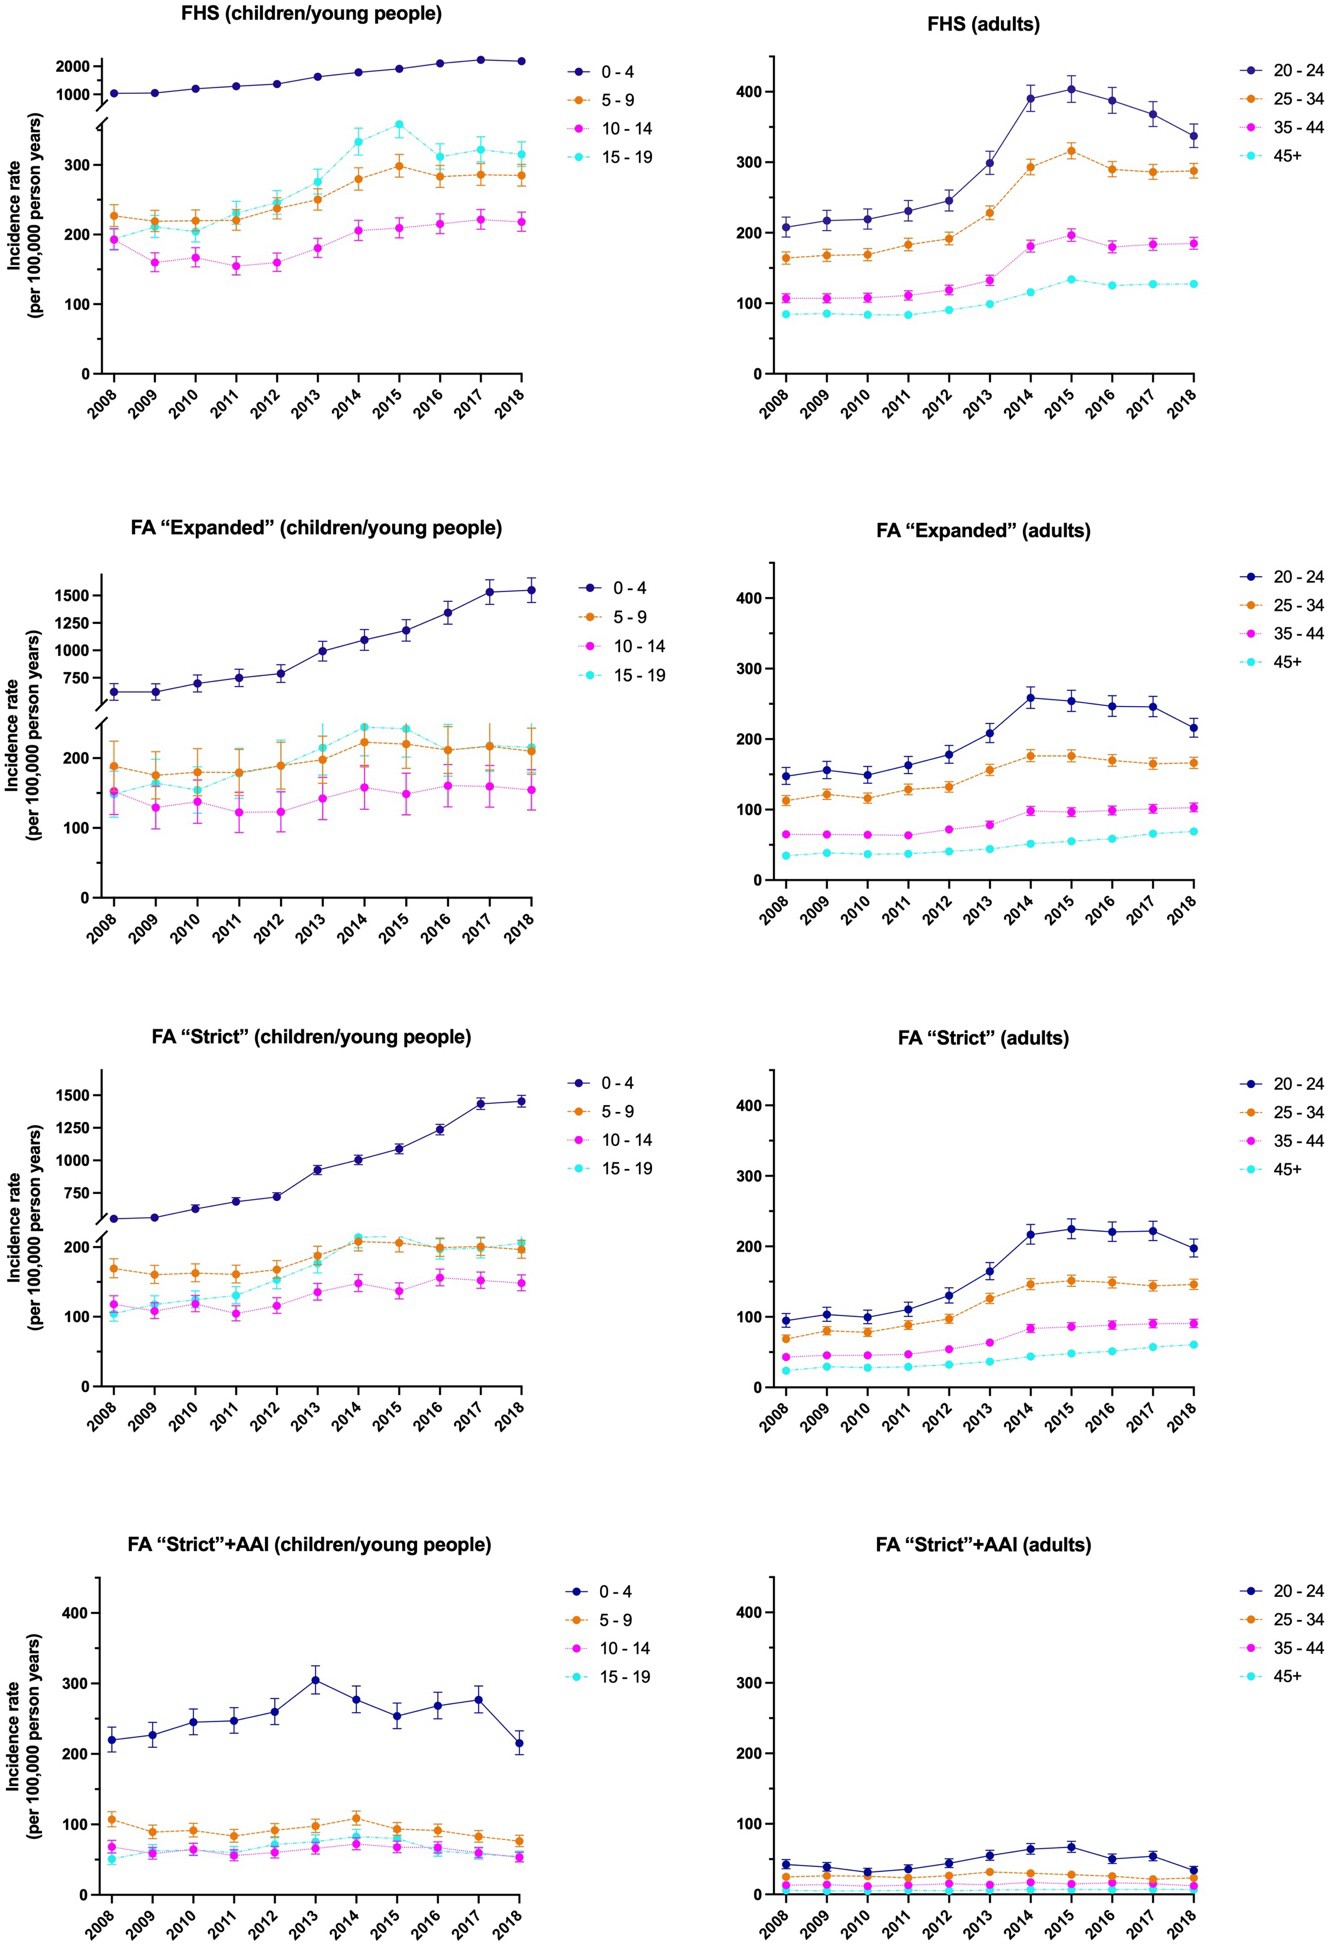
In the under 5s cohort, the estimated incidence of FHS increased from 1038 to 2185 per 100,000 PYrs from 2008-2018, representing an increase of 110%. This increase was 149% and 163% when using the “expanded” and “strict” definitions for food allergy, respectively. There was no increase in incidence when using the strictest definition which includes prescription of AAI, however as noted above the provision of AAI in this age group is variable. Applying a strict definition reduced these rates but only very slightly, from 552.06 per 100,000 PYrs in 2008 to 1453.9 per 100,000 PYrs in 2018. Incidence is essentially stable for a stricter definition with AAI prescribed (Figure 5). For the other age cohorts, trends in the incidence of FHS/food allergy are shown in Figures 6 and 7, and summarised in Table S3 in Appendix 9.1.
_of_food_hypersensitivity_(fh.jpeg)
_and_food_allergy_(fa)__a.jpeg)
_and_food_allergy_(fa)_(ac.jpeg)
In general, incidence was lowest in older age cohorts, although a notable exception is the 20-25 years age band where incidence was higher than in other age cohorts (aside from preschool children) after 2014. The increase in incidence for food allergy between 2012 and 2015 (Figure 4) can largely be attributed to the change in incidence observed from adolescence to mid-adulthood (Figures 6 and 7). This increase was not seen with the strictest definition for food allergy (“strict” with AAI prescription), which might imply that the increase seen was driven by less severe forms of food allergy (such as pollen food allergy syndrome); this is discussed further in the discussion (Section 7).
Finally, we also evaluated incidence by gender, by calculating the ratio of incidence in females to males in each age cohort, in 2008 compared with 2018 (Table 9). These ratios are consistent with previous observations of higher rates of food allergy in males compared with females in childhood, which then reverses after puberty (Afify & Pali- Schöll, 2017).
5.2.3. Prevalence of food hypersensitivity and food allergy
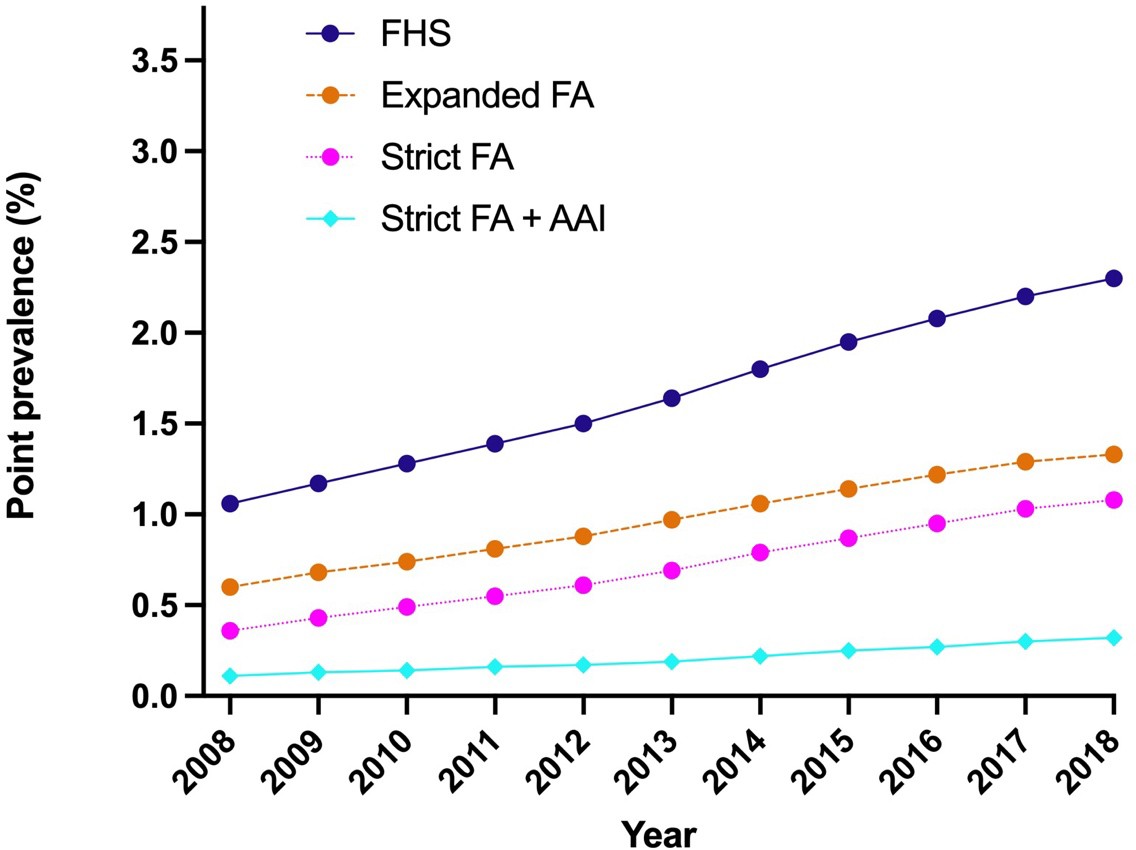
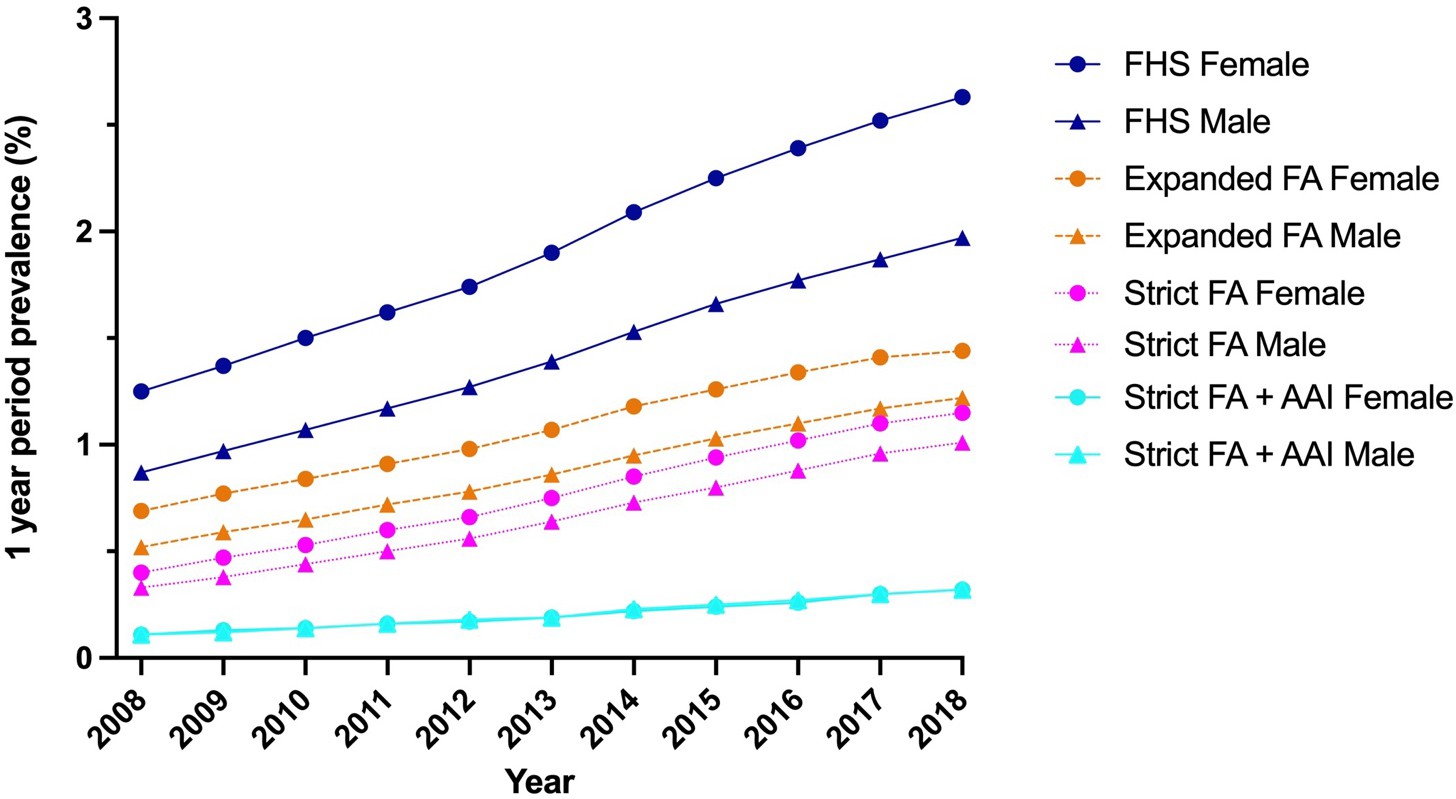
Prevalence was estimated according to one-year period prevalence for each calendar year from 2008 to 2018. Across the population, the estimated prevalence of FHS and food allergy more than doubled during the study period: for FHS, from 1.1% in 2008 to 2.3% in 2018. For food allergy, the increase in prevalence was even more marked when applying a strict definition, with an almost 3-fold increase in estimated prevalence. (Figure 8 and Table 10, with further data in Table S4 in Appendix 9.2). In 2018, 1.1% of the population were estimated to have food allergy by the strict definition used, and 0.3% had food allergy with a prescription of AAI.
_and_food_allergy_(fa)_according_.jpeg)
5.2.3.1. Prevalence of food allergy by gender
The rate of increase in estimated prevalence did not differ between males and females, although prevalence was higher in females than males for all definitions used apart from when analysing patients with the strictest definition (“strict” definition of Food Allergy with AAI prescription) (Figure 9 and Table S5 in Appendix 9.2).
_and_food_allergy_(fa)_by_gender.jpeg)
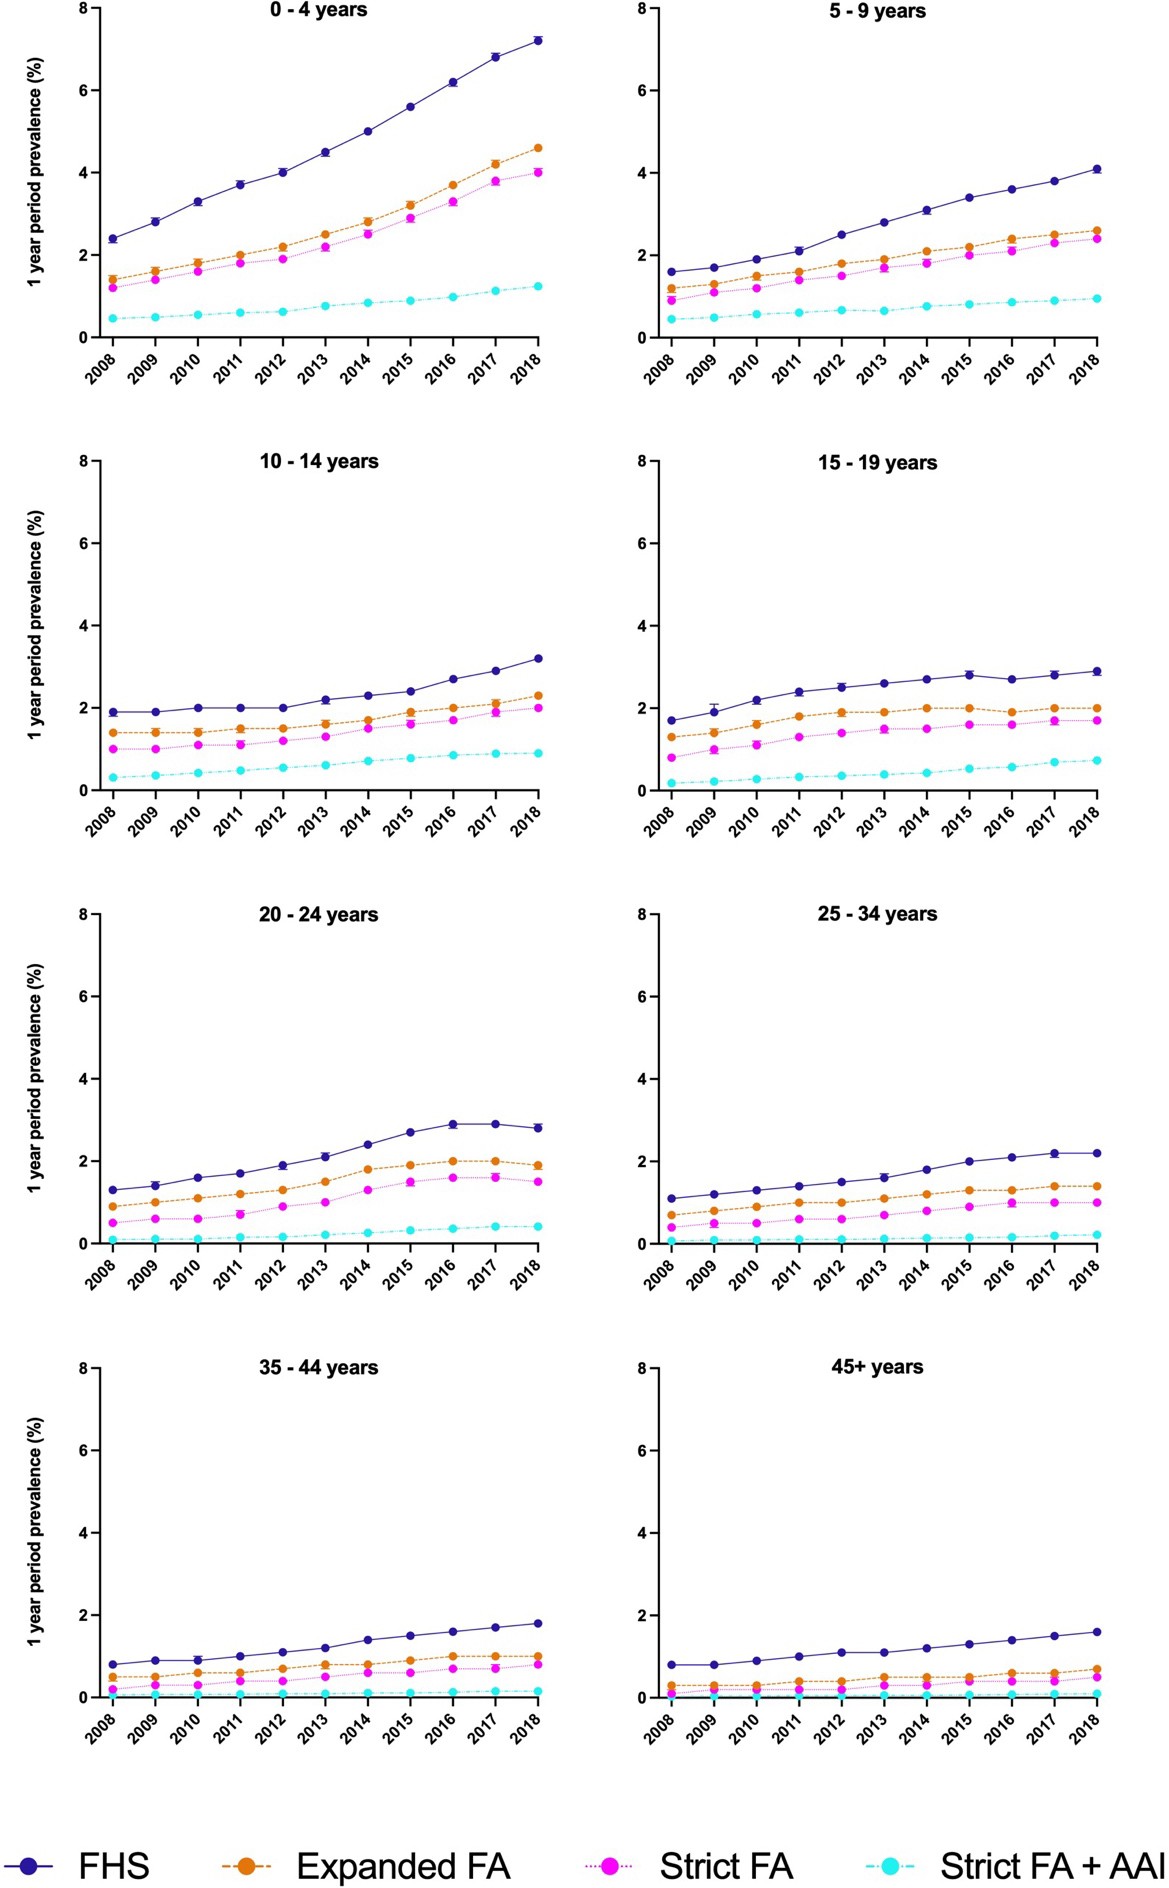
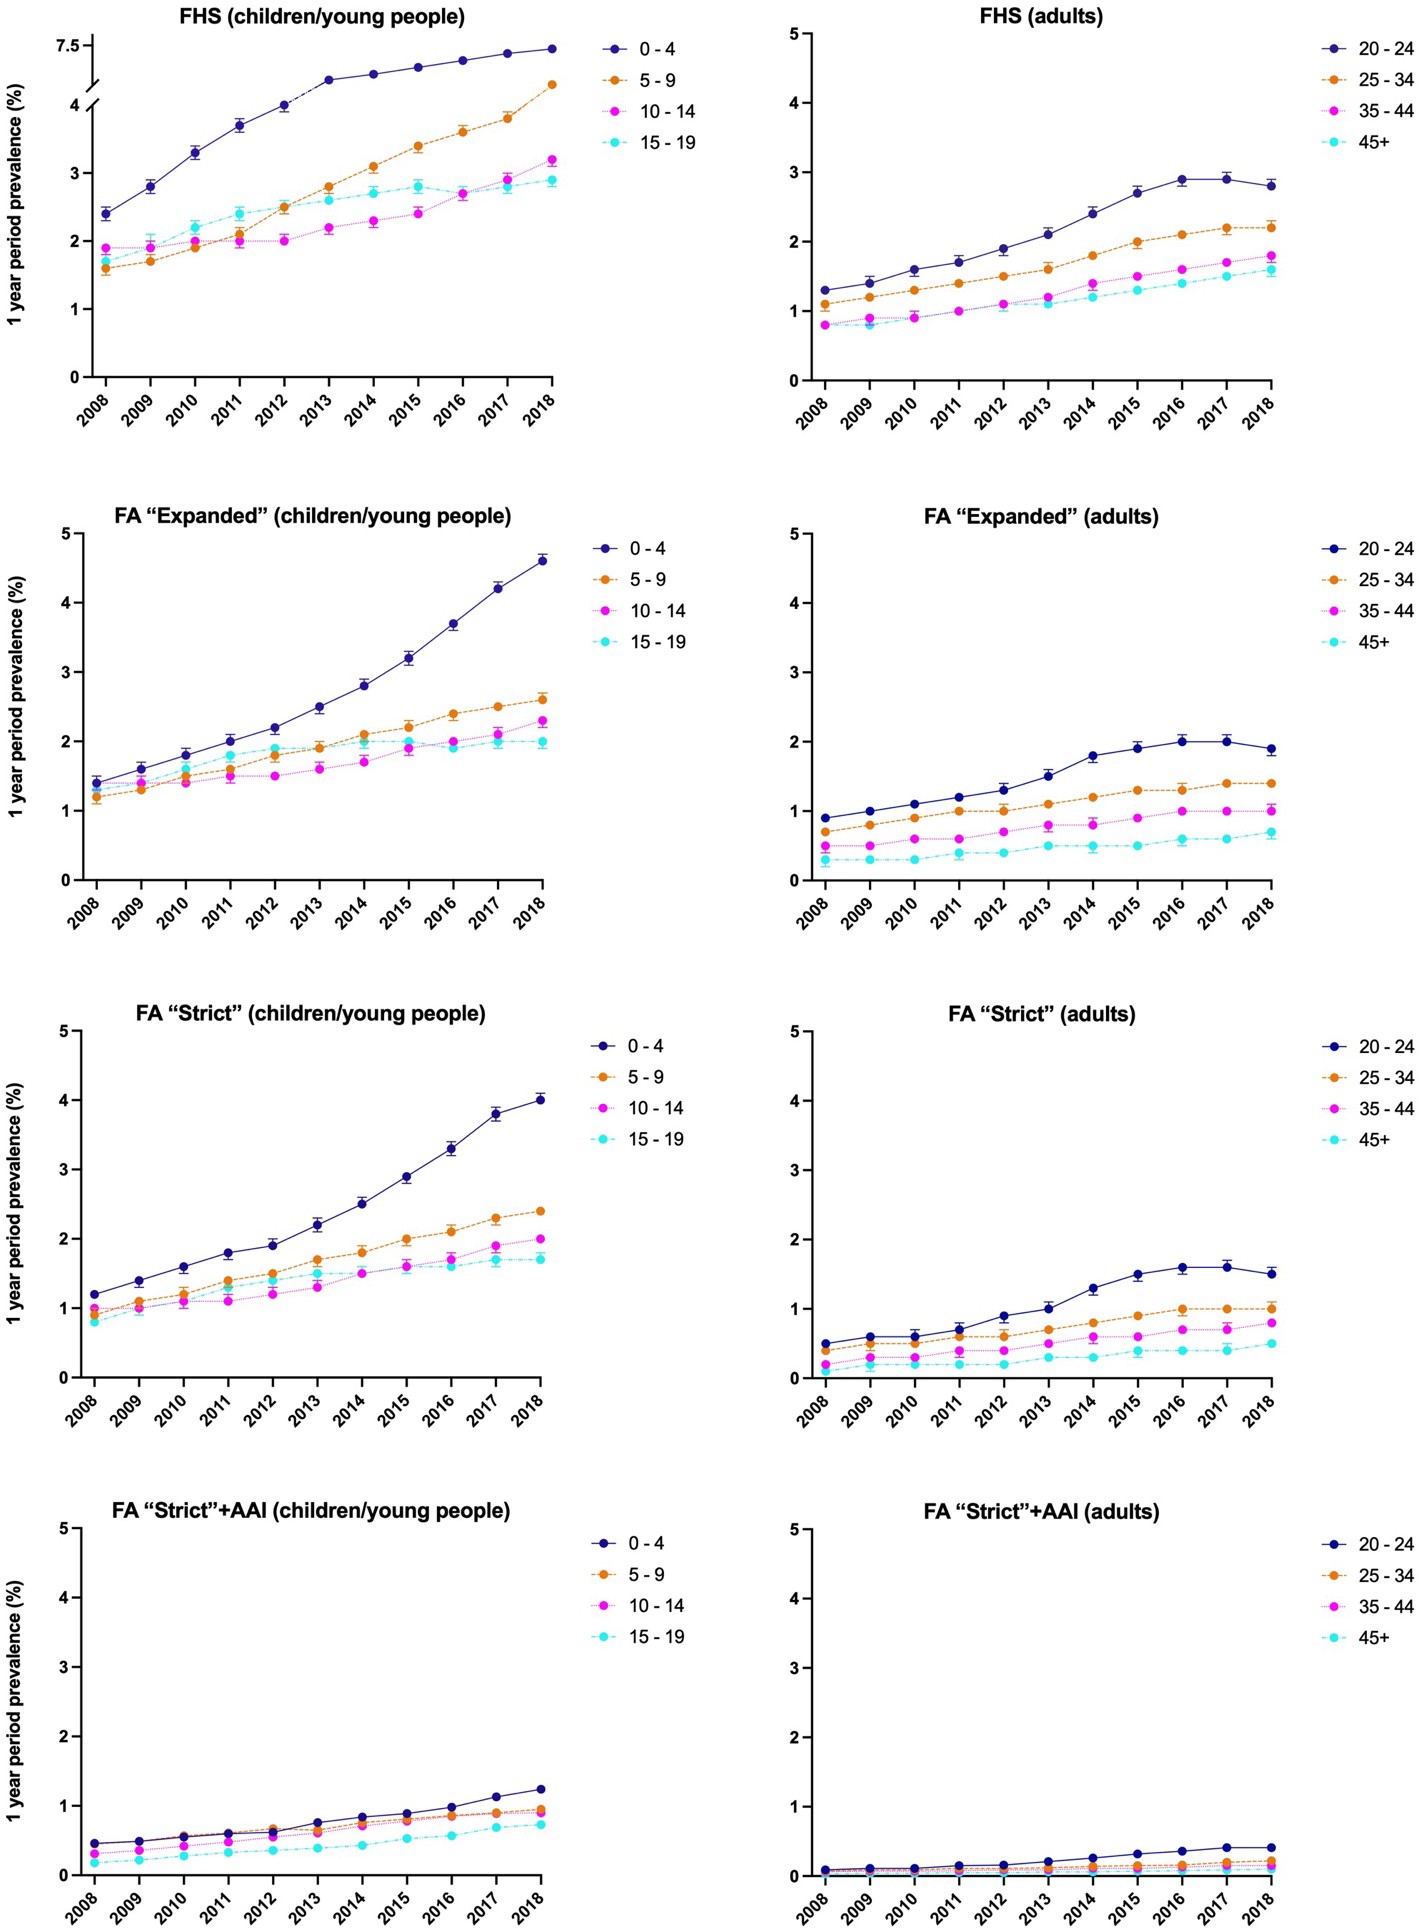
5.2.3.2. Prevalence of food allergy by age
The increase in estimated 1-year period prevalence was greatest for the 0-4 years age group (Figures 10 and 11). In children, the prevalence of food allergy more than doubled from 2008 to 2018 for all definitions used, with an estimated prevalence of 2.4% using the “strict” definition. A similar increase was noted in adults, with a prevalence of between 0.7% and 1% for food allergy (Table 11, and Table S6 in Appendix 9.2).
_and_food_allergy.jpeg)
_and_foo.jpeg)
We also evaluated the ratio of prevalence of FHS/food allergy in female:male individuals, in each age cohort, in 2008 compared with 2018 (Table 12). As with incidence, these ratios are consistent with previous data (Afify & Pali-Schöll, 2017).
5.2.4. Linkage to Hospital Admissions data in HES
We analysed records in CPRD Aurum where data from HES were also available. HES records were not available for all patients. In total, data from 102,376 individuals with a “strict” definition of food allergy in CRPD were available for analysis, of whom 32.4% has been prescribed adrenaline autoinjectors.
Within the cohort of individuals, 5,406 (5.3%) had an ICD-10 code for a hospital admission for food allergy or food-induced anaphylaxis (T78.0/T78.1) recorded in HES. The age distribution of this cohort is shown in Table 13.
Thus, within the cohort, at least 5.3% had evidence of a hospital admission due to food allergy during the study period. These visits were disproportionately highest in preschool- aged children, age 0-4 years. Overall, 35.9% of hospital admissions recorded were in this age group, with 16.5% in 5-9 years and 8.9% in 10-14 years.
5.2.5. Exploratory analysis of patient pathways
This exploratory analysis included 130,832 individuals with at least one diagnostic code for food allergy in CPRD Aurum from 1 January 2008 to 31 December 2018 (although the analysis itself included data up to 31 December 2019 in order to account for delays in data entry in the final study year). Only individuals with a patient care record successfully linked to other NHS datasets (HES) were included.
A summary of the demographics of the sub-cohort appears in Table 14. As noted in the original report, the diagnostic codes used in Aurum (consisting of READ 2, SNOMED-CT and local EMIS® codes) are variable and might be assigned for a variety of different reasons. As a result, it was not possible to use the codes to provide data to inform the relative proportions of allergy due to specific food allergens.
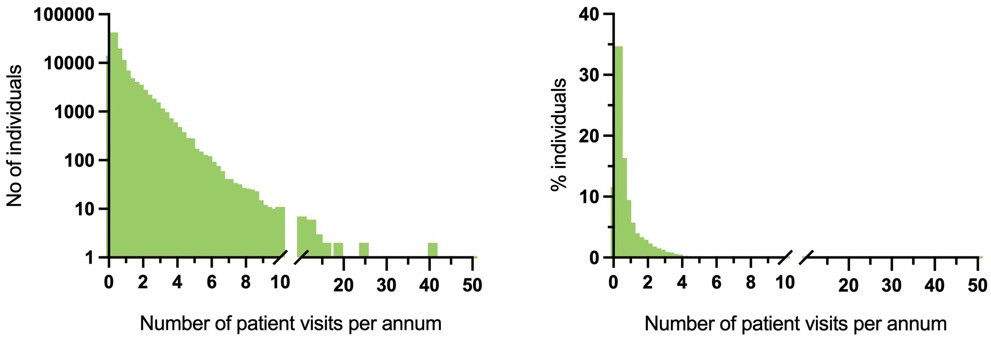
On average, the mean duration for which data was available relating to patient visits was 6.1 ± 3.2 years; 28.8% of individuals had patient visits logged for at least 8 years. 47,205 (36%) individuals were born during the study period. Figure 12 shows the average number of visits per year in participants. The mean and median number of visits was 0.82 and 0.42 per annum.

Overall, 3,592 (2.7%) of individuals in this sub-cohort had a diagnostic code consistent with an episode of anaphylaxis. 872 (24%) of these individuals had a diagnostic code of “nut allergy” and 7.3% “multiple allergy”.
5.2.5.1. Patient healthcare encounters
Overall, there were 503,198 healthcare encounters in 130,832 individuals during the study period. 97.1% of these took place in primary care (see Table 15). Only 3.3% of encounters were outpatient clinic visits, while 0.5% were visits to A&E departments.
15,125 (11.6%) individuals had attended a hospital at least once during the study period. Thus, 88.4% of included individuals (92% in children/young people ≤18 years) had only ever seen an NHS professional for their food allergy within the primary care setting during the study period. 3904 (3.0%) had attended A&E at least once during the study period.
Young children were less likely to have attended A&E compared to older children and adults (see Table 16). The odds of having a documented visit to A&E was greatest for adults (odds ratio, OR, 1.93 [95% CI 1.80-2.06]). Interestingly, adults were less likely to be cared for exclusively within primary care, compared to children (OR 0.48, 95%CI 0.46- 0.49).
Limiting to children ≤18 years of age with a prescription record for AAI (at least once during the study period), 93.5% of patients were still exclusively seen within primary care. For children/young people without any AAI prescription, this proportion was 91.6%.
Individuals with a stated diagnosis of food allergy to a priority allergen (as opposed to a less specific diagnosis of “food allergy”) were less likely to have a visit to A&E recorded (OR 0.17, 95%CI 0.15-0.18), and more likely to be cared for exclusively within primary care (OR 5.37, 95%CI 5.18-5.57).
Prescription of an adrenaline auto-injector was associated with a slightly higher odds of a recorded visit to A&E (OR 1.20, 95%CI 1.15-1.25) or GP-care only (OR 1.12, 95%CI 1.04-1.21).
A prior history of anaphylaxis (prior to the study period) was associated with a higher odds of a recorded visit to A&E (OR 3.89, 95%CI 3.35-4.52) and a lower rate of GP-care only (OR 0.26, 95%CI 0.23-0.28).
The English Index of Multiple Deprivation (IMD) is a measure of the overall deprivation experienced by people living in a neighbourhood, although not everyone who lives in a deprived neighbourhood will be deprived themselves. IMD is based on 37 indicators, across seven domains of deprivation (income deprivation; employment deprivation; health deprivation and disability; education; skills and training deprivation; crime; barriers to housing and services; and living environment deprivation). Areas are classified into quintiles (fifths), with IMD-1 being the least deprived. There was a statistically significant trend with higher levels of deprivation being associated with a higher odds ratio for A&E attendance, and lower likelihood of GP-care only (p<0.001).
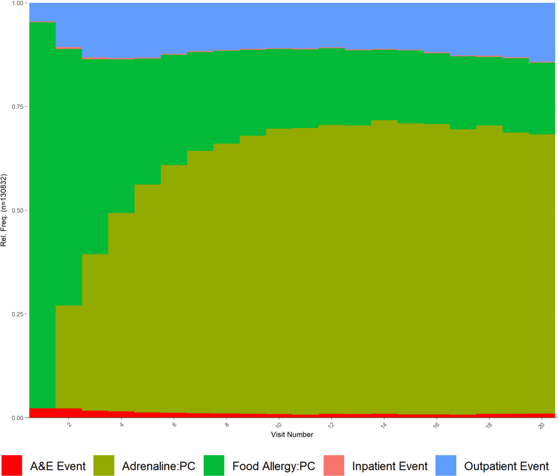
Figure 13 shows the relative different types of patient encounters at each visit type. As can be seen, a significant proportion of initial encounters involve primary care visits for clinical diagnosis and management, with a gradual transition towards more of these visits being for the sole purpose of adrenaline autoinjector prescription. Only a very small minority of encounters involve acute visits to hospital.

5.2.5.2. Patient pathways
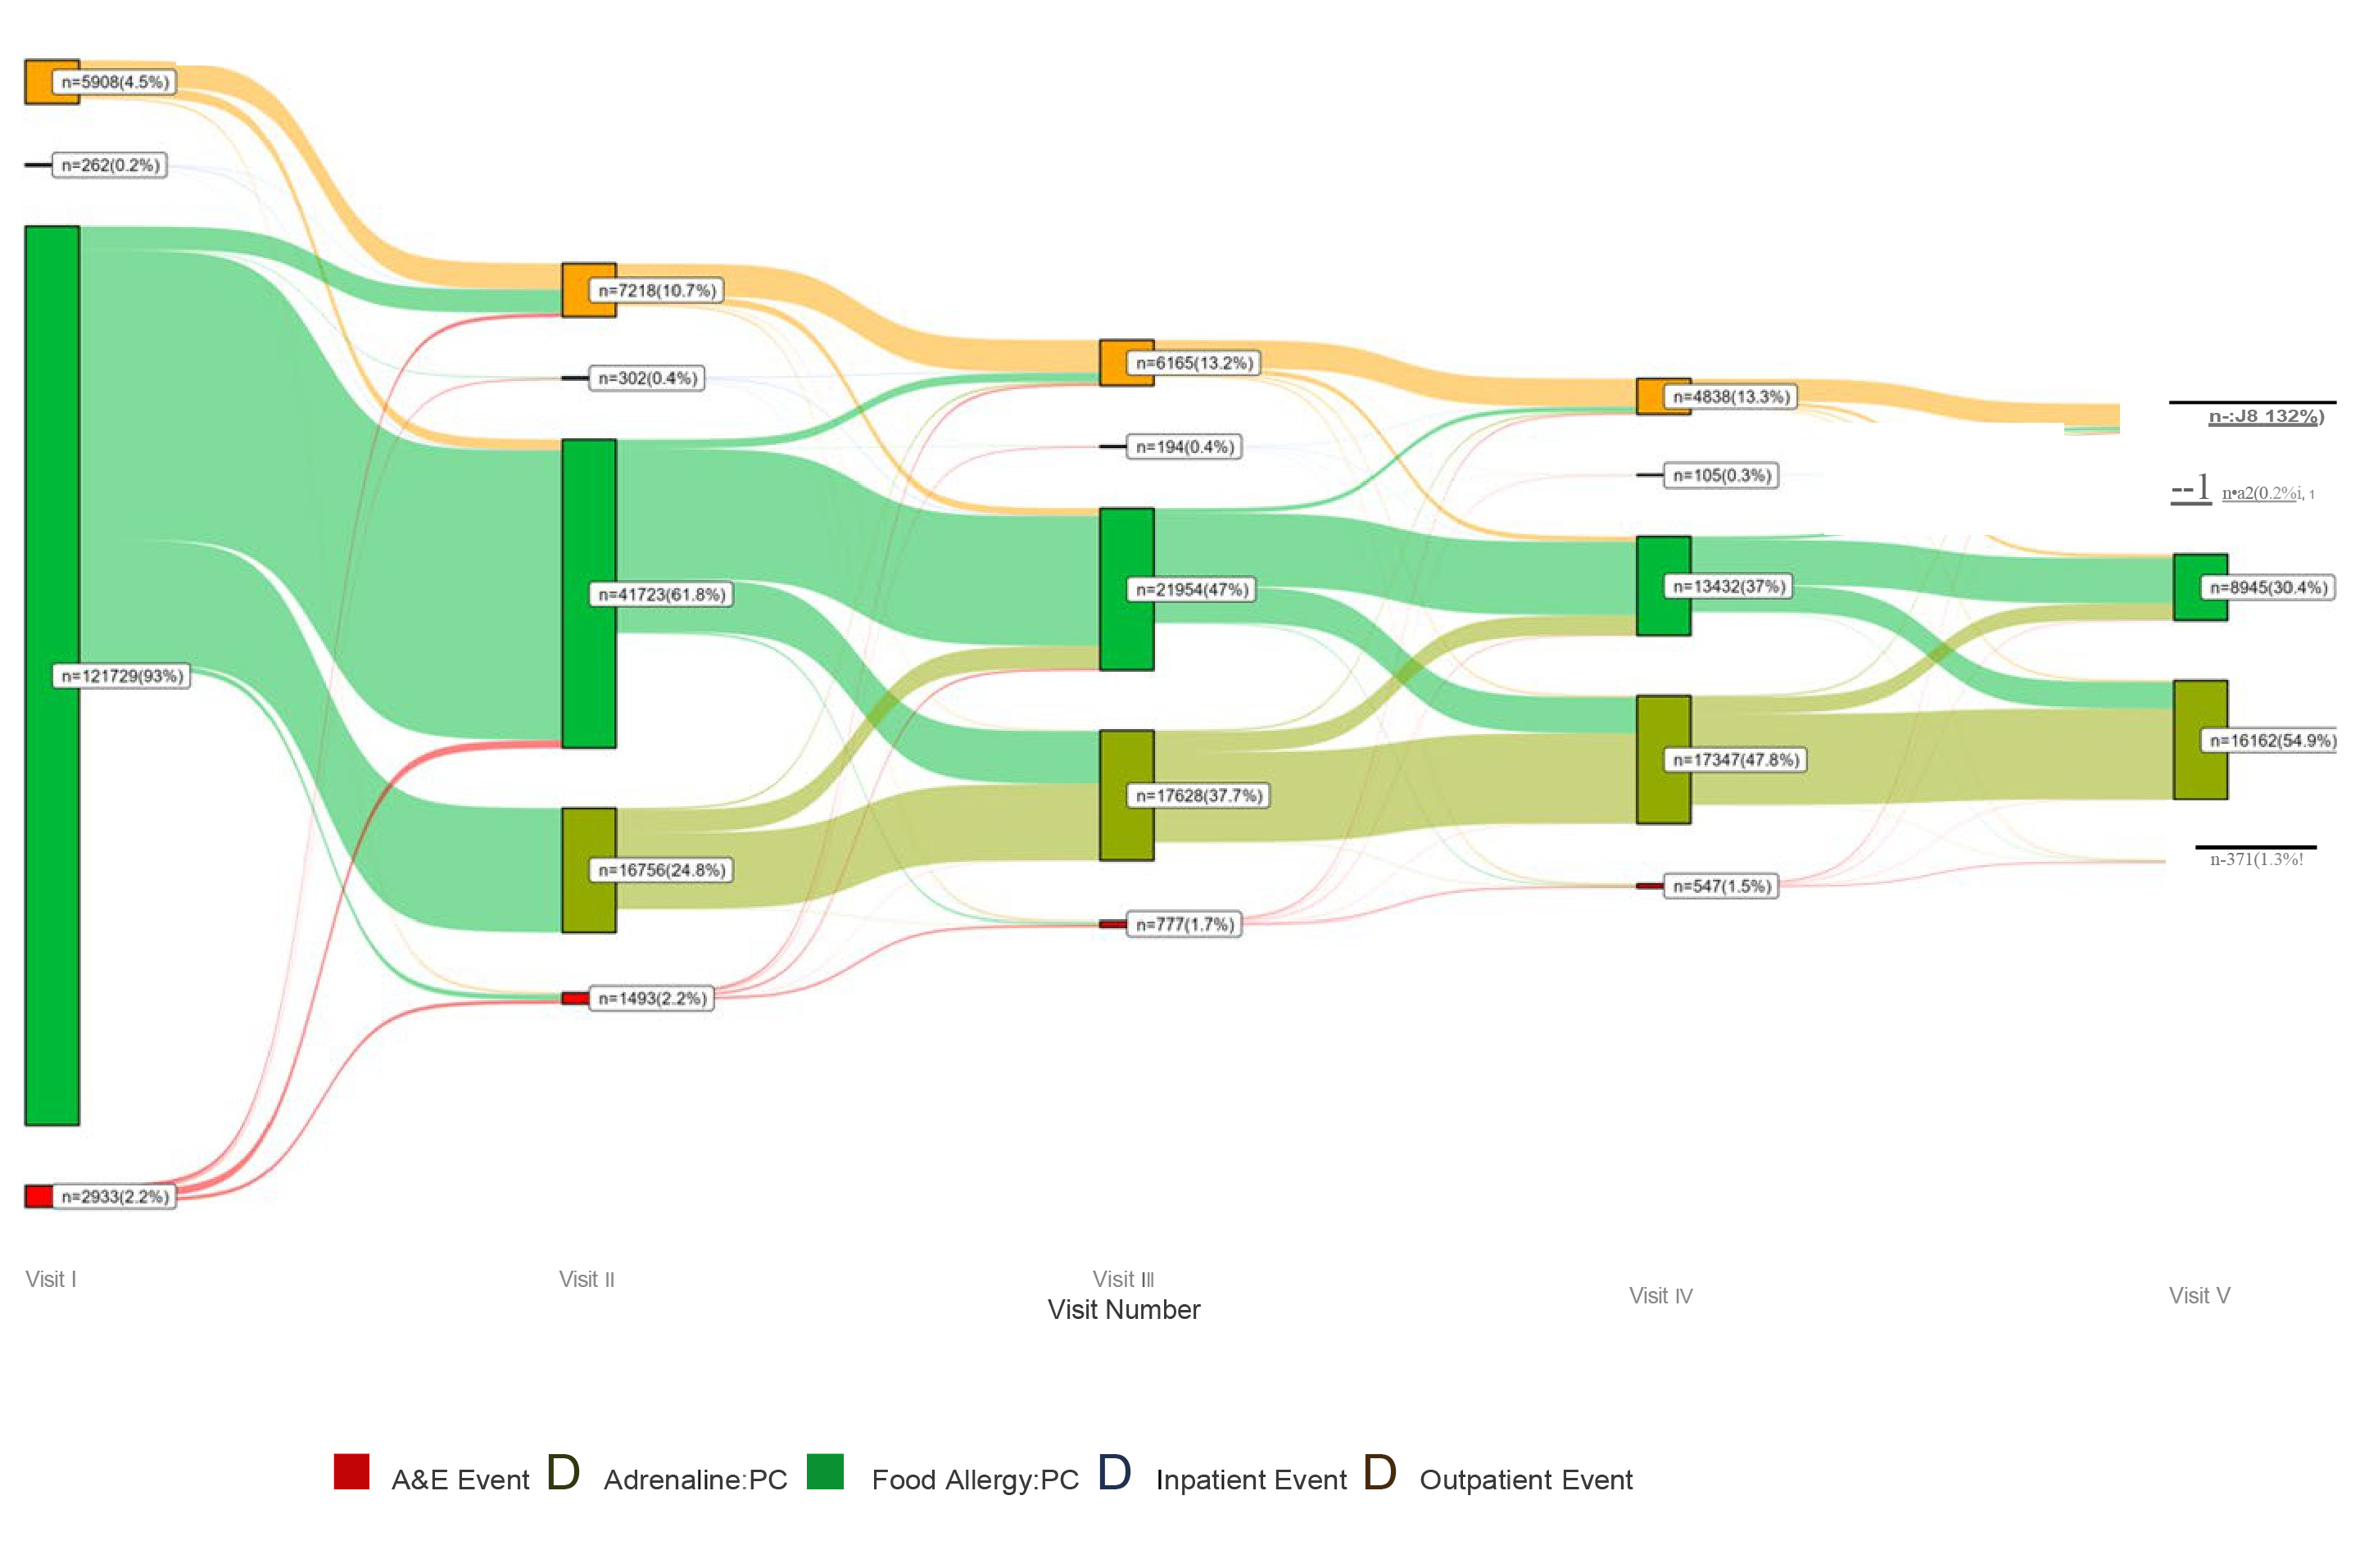
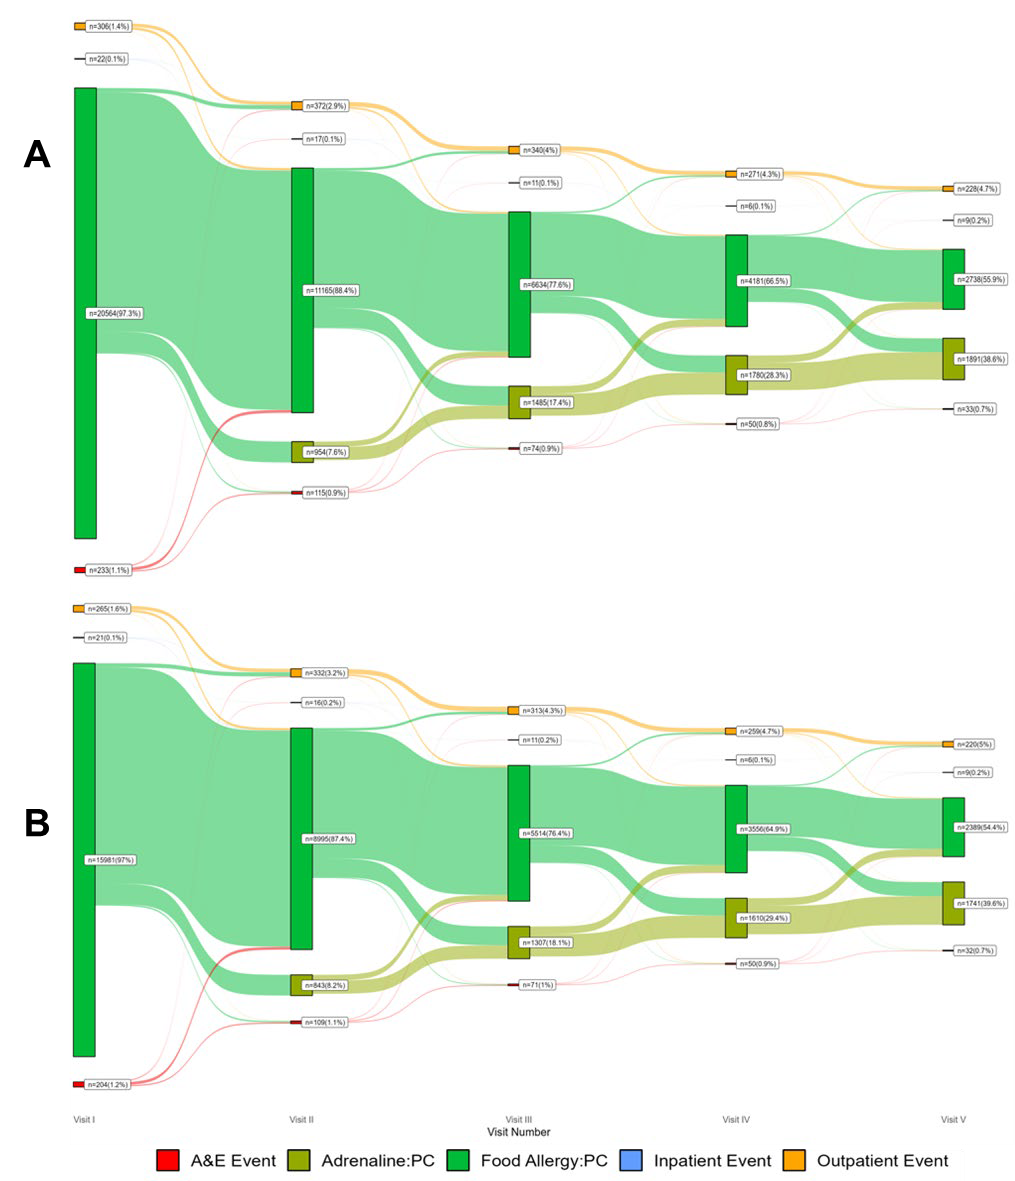
We applied data science techniques to evaluate the different patterns or sequences of patient encounters. A number of different sequences were identified, as shown in Figure 14. There were no obvious differences in patient pathways in the sensitivity analyses, i.e. children whose entire health encounter history was present in the dataset (Figure 15a) and then the same children with at least 5 years of visits recorded (Figure 15b).

_children_with_a_complete_history_of_health.png)
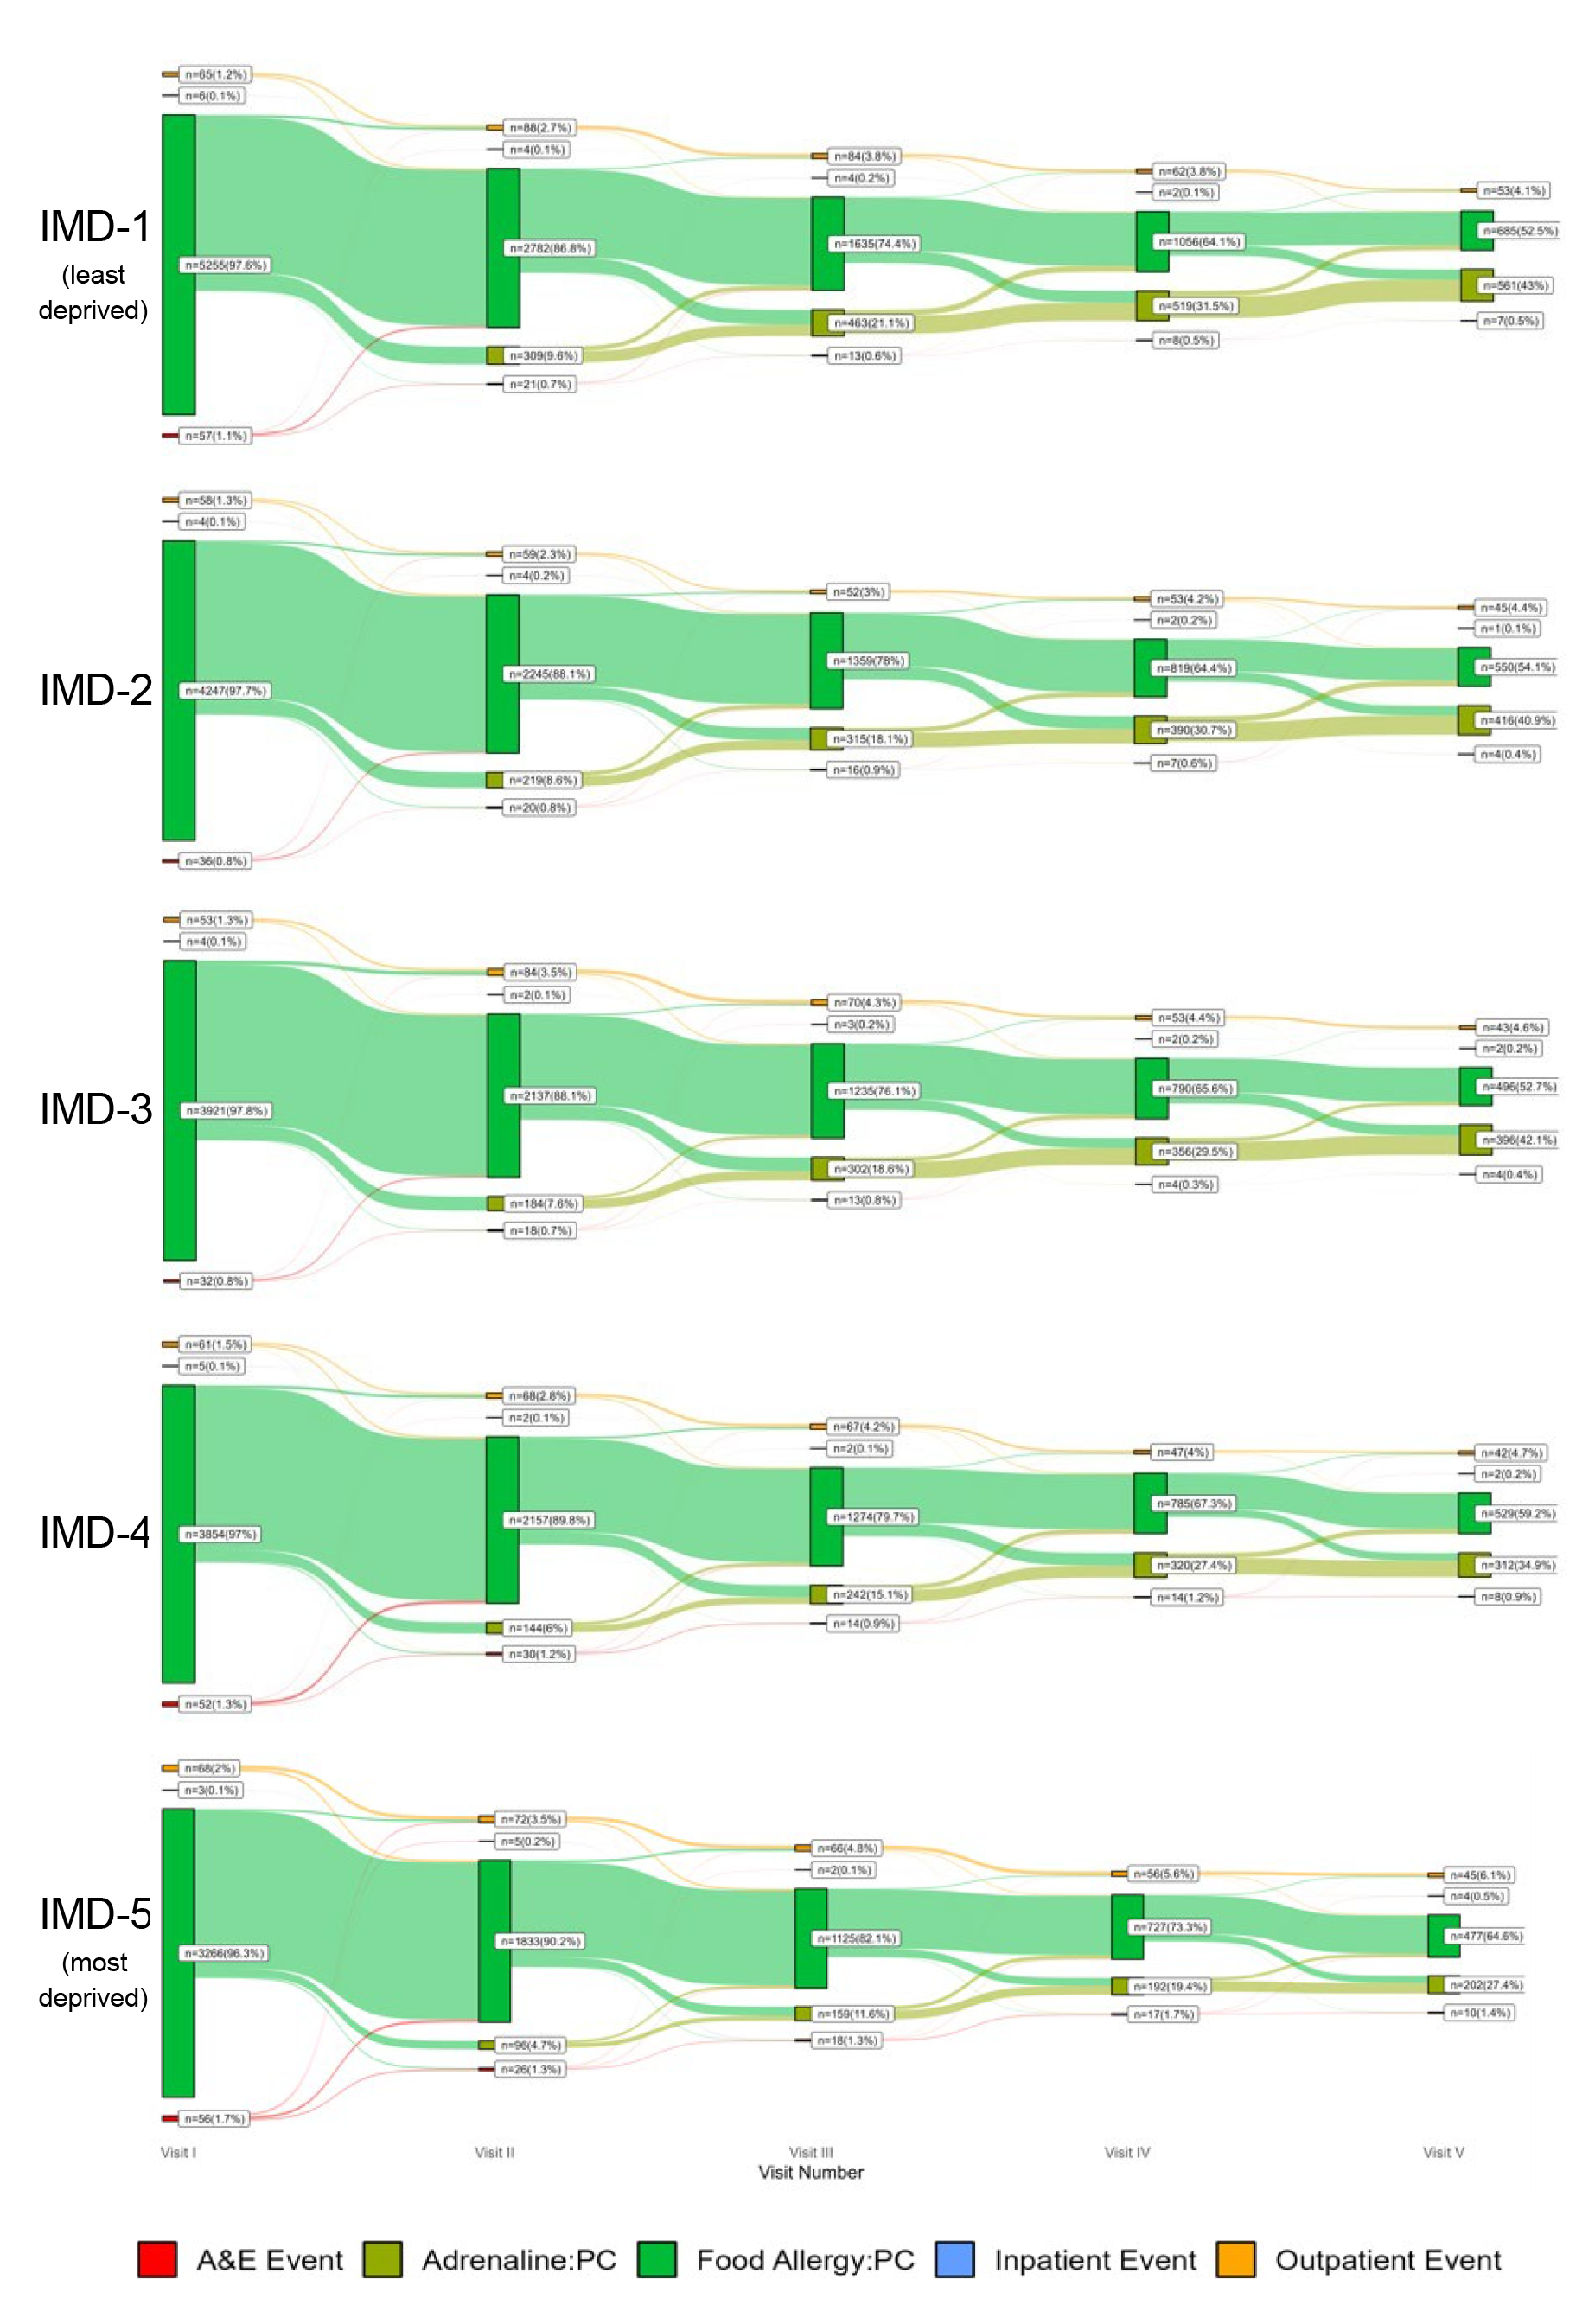
Next, we analysed whether there was any evidence that these different patient pathways may be affected by IMD status. We did not find any evidence that IMD status affected the different patterns of visits within the healthcare system, as shown in Figure 16.
.png)
5.2.6. Prescription of adrenaline autoinjector devices
We first evaluated the proportion of individuals with a “strict” definition of food allergy who were prescribed an AAI device. These data are shown in Table 17.
The analysis of individual patient pathways (section 5.2.5) allowed a more detailed analysis of AAI prescription. In this further analysis of 130,832 (23.6%) individuals with a diagnostic code of food allergy, 30,911 (23.6%) had at least one AAI prescribed during the study period.
3589 (2.7%) patients were coded as having had an unplanned hospital encounter due to anaphylaxis during the study period. National guidelines (from the National Institute for Health and Care Excellence (NICE) and the Medicines and Healthcare products Regulatory Agency (MHRA)) in the UK recommend AAI prescription in all individuals with previous food-induced anaphylaxis, due to the risk of recurrence. However, in this analysis, only 60% of individuals with prior documented anaphylaxis (68% in children, 55% in adults) were prescribed AAI at least once, and only 41% (54% in children, 33% in adults) had AAI prescribed on “repeat prescription” (i.e. more than 3 AAI prescriptions within a 4 year period). Children were 63% (95%CI 50-78%) more likely to receive multiple AAI prescription than adults (OR 2.4, 95%CI 2.0-2.8, p<0.001 chi-squared test).
Arguably, lack of ongoing prescription for AAI might be due to resolution of the food allergy, something which is not uncommon in younger children, particularly those with food allergy to cow’s milk or egg. However, when we analysed AAI prescription in children aged 11-18 years inclusive (in whom resolution of food allergy would be unlikely), only 62% had at least one prescription for AAI, and 46% had a repeat prescription for AAI.
Interestingly, in contrast to AAI prescribing in all food-allergic individuals, the IMD status did not impact on prescription rates in this cohort of patients with prior anaphylaxis.
6. Hospital admissions and fatalities due to food anaphylaxis in the UK
6.1. Methods
6.1.1. Hospital admissions
Hospital admissions data for England and the devolved administrations (Scotland, Wales and Northern Ireland) are collected in the HES database (coordinated through NHS Digital) for England, Patient Episode Database for Wales (NHS Wales Informatics Service), Information Services Division (NHS Scotland) and Hospital Activity Statistics (Health-NI), respectively. We extracted data from these datasets relating to hospital admissions from 1998 to 2018, where the primary diagnosis was anaphylaxis.
Attendances to the emergency department that did not result in a hospital admission were excluded. The following ICD-10 codes were used: anaphylactic shock due to adverse food reactions (T78.0); anaphylactic shock, unspecified (T78.2); and anaphylactic shock due to adverse effects of correct drug or medicament properly administered (T88.6). Admissions to hospital where a primary T78 code was associated with a secondary code of X23 were classified as being caused by insect sting related anaphylaxis. We also included the following codes used to categorise non-anaphylaxis admissions due to an allergic cause: other adverse food reactions, not elsewhere classified (T78.1); and other and unspecified allergy (T78.4). Due to the restrictions on data access, “children” encompassed young people up to 15 years of age.
6.1.2. Fatal food-induced anaphylaxis
Deaths in England and Wales are recorded by a medical doctor and these data are collected by the Office for National Statistics (ONS). Since 1992, anaphylaxis fatality data have also been collected by the UK Fatal Anaphylaxis Registry (UKFAR). We updated previously published data from UKFAR (Turner et al., 2015) using Inquest Reports and reports in the national media, using an identical methodology since the attribution and coding of deaths can be unreliable. For each death, the probability that it was caused by food-induced anaphylaxis was assessed; deaths caused by an acute asthma exacerbation were included only where there was strong evidence that the episode was triggered by an identified food allergen to which the deceased patient had a known allergy. Cases were cross-checked with cases from the ONS database where sufficient information was available to determine the likely cause of death. While we included reports of fatal food-anaphylaxis for residents in Scotland and Northern Ireland, we were unable to cross-check these with the equivalent databases in these nations.
6.1.3. Statistical Analyses
Hospital admissions data were expressed per 100,000 population for the equivalent ONS population estimate for that year. Age-specific rates for hospital admissions and fatalities were calculated by standardizing to the age distribution of the population to mid-2009 estimates as reported by ONS. Poisson regression was used to estimate the rate ratio (and 95% CIs) for the annual increase in rates, for the following time periods, as previously described (Turner et al., 2015). All statistical analyses were run in the programming language R. A rate ratio of 1.0 implies no annual change in rate, and a 95% CI that includes 1.0 indicates the observed rate ratio is not statistically significant. We estimated rate ratios for the overall study period (1998-2018), but also the most recent 5- and 10-year periods in order to assess for possible changes in time trends.
6.2. Results
6.2.1. Hospitalisations due to “allergy”
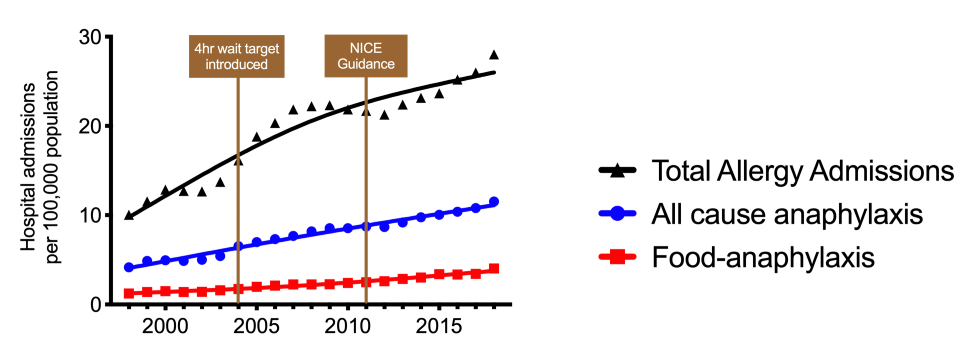
Hospital admissions due to “allergy” increased steadily across all ages since 1998 (Figure 17), from 8.0 to 20.8 admissions per 100,000 population, an increase of 160%. The estimated rate ratio (multiplicative increase of the rate per year over the study period) was 1.039 (95% CI, 1.038 to 1.040; p<0.0001). However, only 50.7% of these admissions were coded as being due to (all-cause) anaphylaxis; the remainder also included day cases (for example, for allergy testing such as food challenges). Limiting the analysis to anaphylaxis (T78.0, T78.2, T88.6), hospital admissions increased by 174%, from 4.2 to 11.5 per 100,000 p.a., equivalent to a rate ratio of 1.047 (95% CI 1.046 to 1.048, p<0.0001). Consistent with our previous data, there was no obvious impact noted following the introduction of maximum waiting time targets in Emergency Departments introduced by the UK government in 2004.

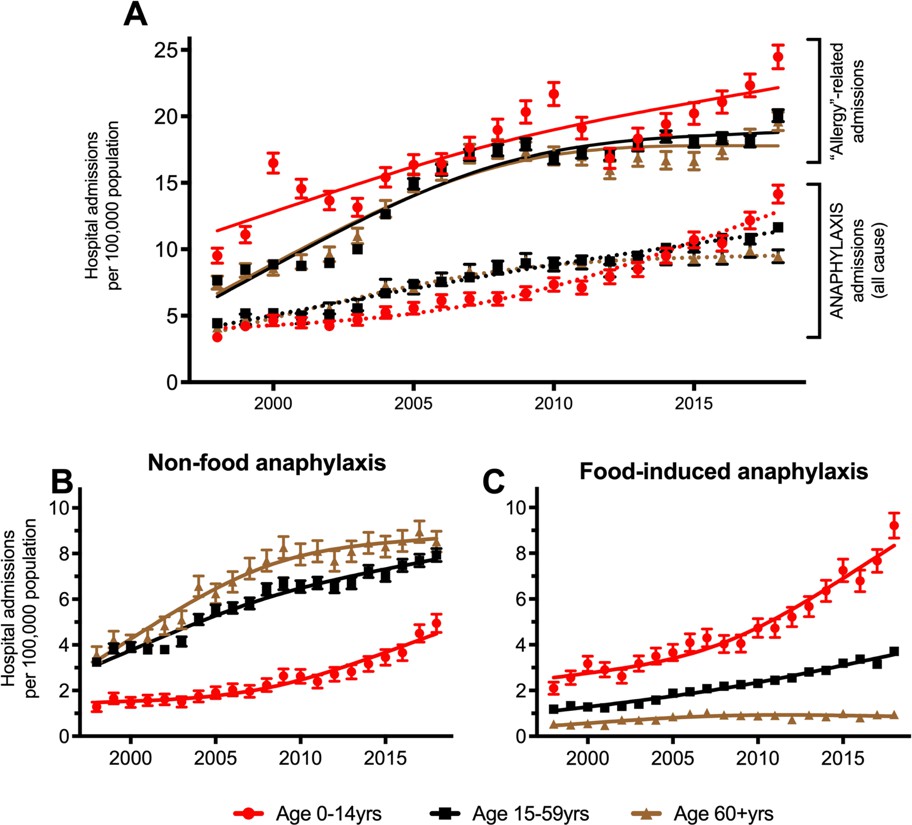
Analysing these data by age group (0-14 years, 15-59 years, 60+ years), a similar trend was noted although there was evidence of a plateau in adult “allergy” admissions but not for anaphylaxis since 2014 (Figure 18). Anaphylaxis hospitalisations where the trigger was unknown or due to a non-food trigger are shown in Figure 19. Across all age groups, age-specific rates for hospitalisations increased, with rate ratios of 1.065 (95% CI 1.060 to 1.069) for 0-14 years, 1.041 (95% CI 1.039 to 1.042) for 15-59 years, and 1.050 (1.048 to 1.053) for 60+ years.

6.2.2. Hospitalisations due to food-induced anaphylaxis
Food-induced anaphylaxis represented 29.4% of reported “allergy” admissions, and significantly increased over the study period from 1.23 to 4.02 admissions per 100,000 population per annum (estimate rate ratio 1.057 (95% CI 1.055 to 1.059); p<0.001) (Figure 17). The greatest increase in admissions due to food-anaphylaxis was noted for young people under age 15 years: from 2.6 to 9.2 admissions per 100,000 population per annum (an increase of 260%), equivalent to a year-on-year increase of 6.6% (rate ratio 1.066 (95% CI 1.063 to 1.070), p<0.0001). This compares to an increase of 178% (rate ratio 1.059 (95% CI 1.056 to 1.062), p<0.0001) for age 15-59 years, 93% increase (rate ratio 1.021 (95% CI 1.02 to 1.03), p<0.0001) for age 60+ years over the same time period (Figure 18).
In 2011, guidance from the NICE was published which recommended that children under age 16 years should be admitted to hospital under the care of a paediatric medical team following emergency treatment for suspected anaphylaxis (NICE, 2011). We therefore calculated rate ratios for the increase in hospitalisations due to food anaphylaxis in children for the time periods 1998-2010 (prior to guideline), 2011-2018 and 2014-2018.
The rate ratios were 1.057 (95% CI 1.049 to 1.065), 1.091 (95% CI 1.079 to 1.103) and 1.086 (95% CI 1.064 to 1.109) respectively. This implies that there was a significant increase in hospital admissions after 2011, but also that the rate of increase has continued to persist from 2014 onwards. Therefore, the increase over the last 5 years cannot be attributed to the impact of NICE guidance.
6.2.3. Impact of gender on rates of hospitalisations
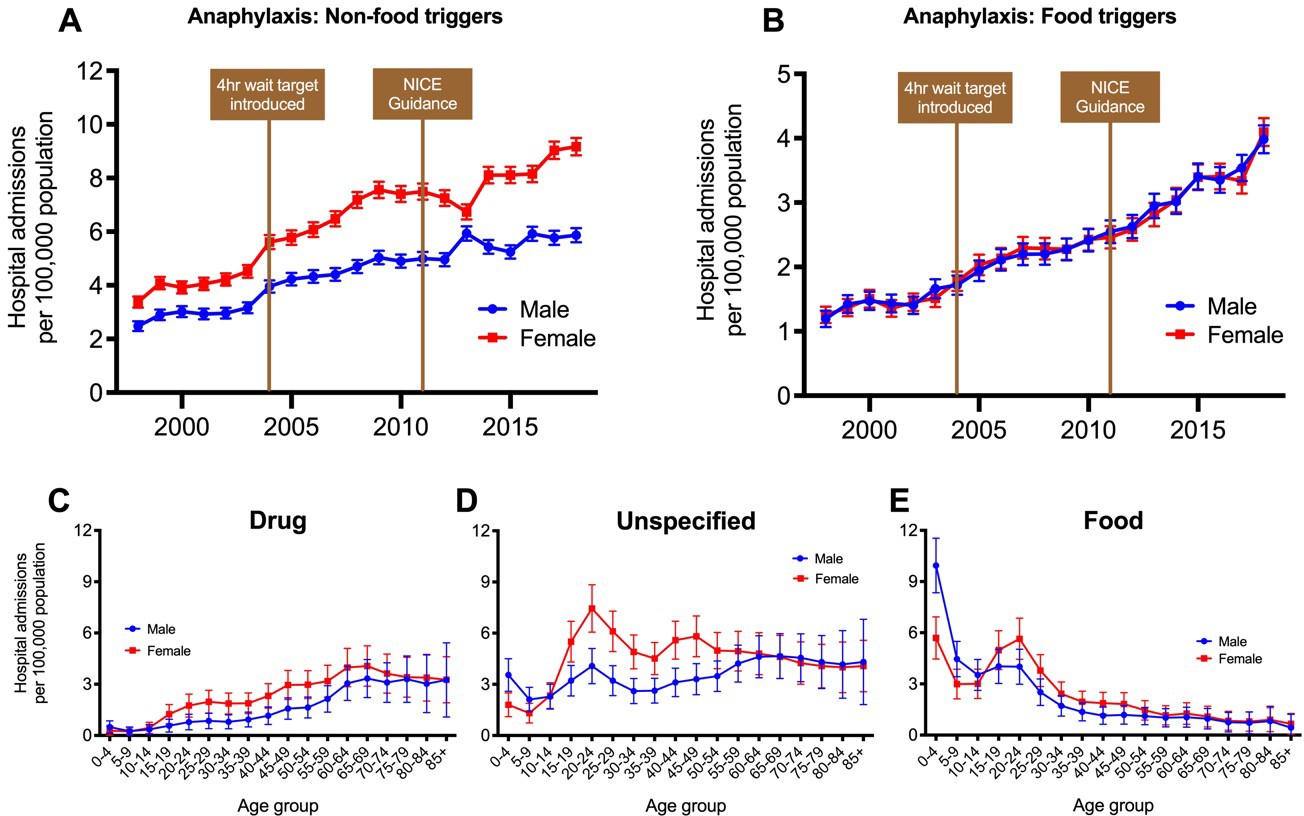
A clear female predominance was seen for non-food triggers of anaphylaxis admissions throughout the study period (Figure 19), whereas this was not apparent for food anaphylaxis (Figure 19). On further analysis, looking at gender differences by age, there was a clear male predominance in food anaphylaxis admissions prior to puberty (M:F ratio 1.6:1), which then reversed from age 15 years onwards (Figure 19), consistent with previous data (Jensen-Jarolim & Untersmayr, 2008). Given that anaphylaxis to non-food triggers is very rare in children, the gender ratio for anaphylaxis admissions due to an “unspecified” trigger in younger children (Figure 19) likely implies that many of these prepubertal cases may have been due to a food trigger but coded incorrectly.

6.2.4. Time-trends for anaphylaxis admissions by devolved nation
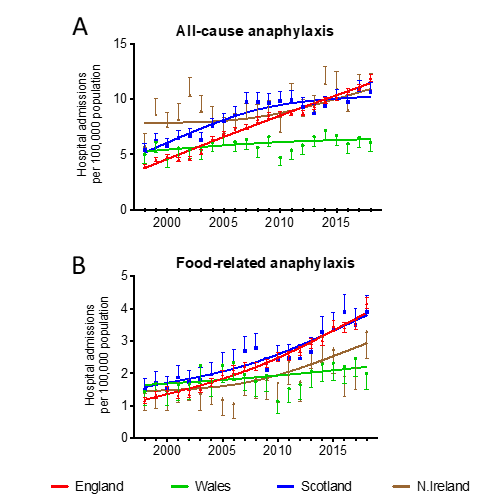
Analysing hospital admissions by devolved nation, we observed a significantly lower rate of admissions per 100,000 in Wales compared with the other devolved nations for all- cause anaphylaxis (Figure 20). This may be due to Welsh residents who seek medical attention in English hospitals as they live closer to hospitals in England rather than Wales. Unfortunately, due to data restrictions, we were unable to assess this. With respect to food-induced anaphylaxis, admissions were higher in England and Scotland than in Northern Ireland and Wales, although this difference was not statistically significant.

The annual increase in admissions showed evidence of plateauing in Wales and Northern Ireland, as reflected by the estimated rate ratio for the year-on-year increase in admissions when considering the period 2014-2018 (Table 18). However, the CIs for these data are wider due to the lower number of cases of anaphylaxis in Wales (3.7%) and Northern Ireland (3.2%).
6.2.5. Fatal food-induced anaphylaxis
Between 1998 and 2018, we identified 152 fatalities where there was a high level of suspicion that the fatal event was due to food-induced anaphylaxis; in 120 cases, the cause of death at coronial inquiry was for food-induced anaphylaxis, while in the remaining 32 cases, there was sufficient information from the inquest and/or other sources that the fatal event had been associated with exposure to a food allergen to which the individual was allergic. Since fatal food-induced anaphylaxis is so rare, we also included an additional 35 fatalities which had been recorded in the UK Fatal Anaphylaxis Register since inception, i.e. between 1992 and 1997, making a total of 187 fatalities over a 27 year period (Table 19).
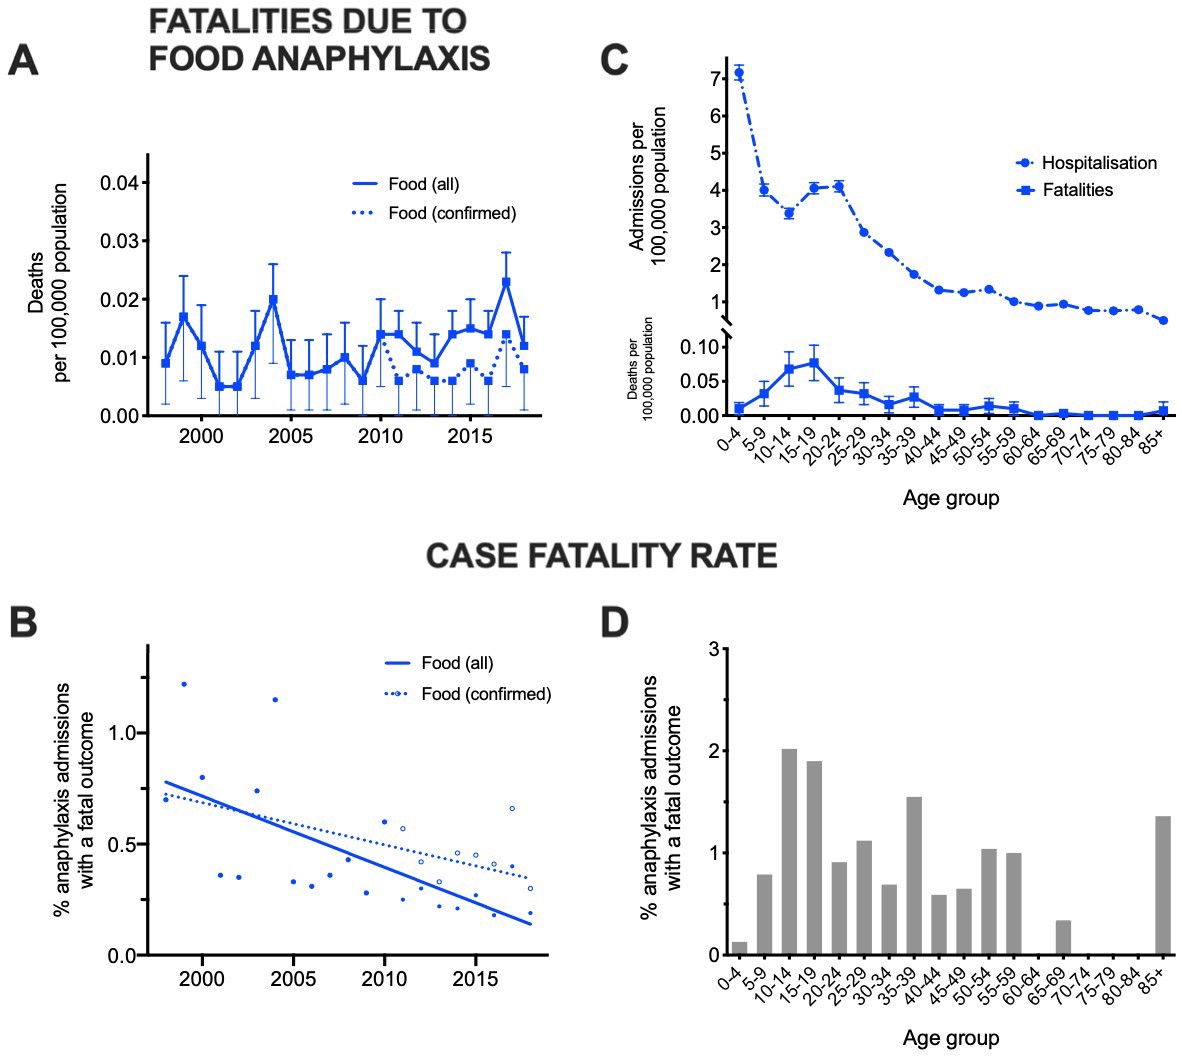
The annual fatality rate due to food-induced anaphylaxis was 0.009 fatalities per 100,000 population in 1998 and 0.008 fatalities per 100,000 population in 2018 (Figure 21). The case fatality rate (number of fatalities expressed as a proportion of hospital admissions for food-anaphylaxis) decreased from 0.70% in 1998 to 0.19% (suspected cases) or 0.30% (confirmed cases) in 2018 (Figure 21). The estimated rate ratio was 0.931 (95% CI 0.904 to 0.959; p<0.0001) for confirmed cases and 0.970 (95% CI 0.945 to 0.996; p=0.024) for suspected fatal food anaphylaxis. The age distribution for fatal cases demonstrated a peak in the teenage years (Figure 21); however, this age was also associated with a peak in hospital admissions.
Assessing the case fatality rate by age group, the highest fatality rate was seen in teenage years but remained elevated throughout adulthood (Figure 21). While those under 5 years were most likely to be admitted to hospital with anaphylaxis, the rate of fatalities in this age group was very low.

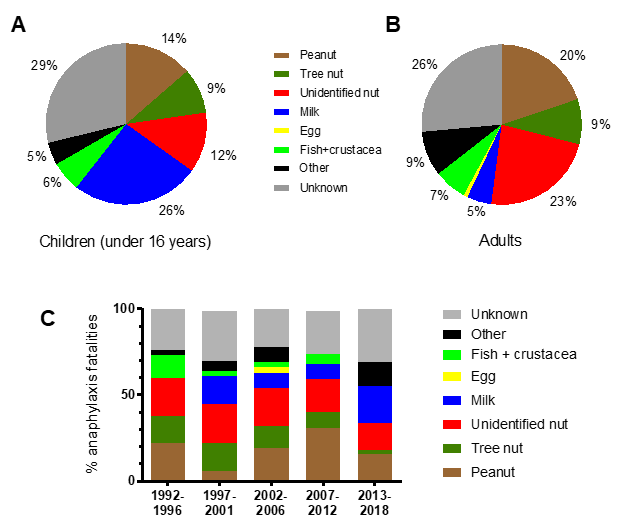
The triggers for these events are shown in Figure 22. In over one quarter of cases, the precise food could not be identified. At least 86 (46%) fatalities were triggered by peanut/tree nut. However, cow’s milk was responsible for 26% of fatalities in children and 5% of adults, despite allergy to cow’s milk allergy being uncommon in older children and adults. Since 1992, there has been a downwards trend in the proportion of deaths due to peanut / tree nuts but an increase in those due to cow’s milk exposure (Figure 22).
_and_adults_(b)_a.png)
7. Discussion
A number of methodologies have been used to assess the epidemiology of food allergy in a population setting, including self-report and birth cohort studies. To our knowledge, this is the first attempt to describe the epidemiology of food allergy in the UK, using a large, population-based dataset with linked primary and secondary care data (Section 5 of this report). The data analysed with respect to primary care was only available for England, but is likely to be representative of the United Kingdom. On the basis of primary care diagnostic codes, we found evidence of an increase in both incidence and prevalence of food allergy between 2008 and 2018, particularly in the preschool age group. While this may, in part, reflect a true increase in the incidence of food allergy, it is possible that greater awareness of food allergies and a shift in provision of allergy care to primary care are also contributory factors. The apparent plateauing of incidence observed since 2014 for many age groups is noteworthy and requires confirmation.
Unfortunately, the COVID-19 pandemic and its impact on NHS visits and data collection did not allow this to happen within the scope of this work.
The increase in incidence was not evident when using AAI prescription as a means to further validate diagnostic coding. In contrast, an increase in prevalence was still evident when restricting to patients with a food allergy diagnosis and prescribed AAI. This may be partly explained by the greater increase in incidence seen in the preschool age group compared with other age groups. Preschool-aged children are frequently not prescribed AAI for reasons which include dose-restrictions (AAIs administer a minimum dose of 150 micrograms adrenaline, which is often considered too high a dose in children under 2 years unless there is a significant risk of anaphylaxis) as well as a consensus amongst many healthcare professionals that preschool-aged children do not in general require AAI in the absence of a history of prior anaphylaxis (Kemp et al, 2003). In addition, there is no doubt that the prescription of AAI to older ages has significantly increased over the same time period (Diwakar, Cummins, Ryan, et al., 2017).
Our analysis found that the majority (88.4%) of patients with a food allergy diagnosis are managed exclusively in the primary care setting. This is consistent with previous reports of healthcare worker surveys in the literature, which found a gap between demand for allergy services and the ability of specialist hospital services to provide for that demand (Agache et al., 2013; Diwakar, Cummins, Lilford, et al., 2017). Children, particularly in the preschool age group, were more likely to only be seen in primary care. Interestingly, adults were more likely than children to be seen at least once in hospital due to their food allergy, although 85% of adults were still only seen exclusively in primary care. Analysing this pattern by IMD, higher levels of deprivation were associated with a higher rate of unscheduled presentations to A&E departments, which reflects the situation with other medical diagnoses. However, IMD status did not seem to alter the actual patient pathways (sequences of patient visits). Unfortunately, due to incomplete coding of ethnicity data in NHS datasets, we were unable to include ethnic background in this analysis.
Only one third of patients with a diagnosis of food allergy were prescribed AAI, which probably reflects both the heterogeneity of food allergy (including patients who are not at risk of anaphylaxis) as well as a lack of understanding in terms of identifying patients at risk of anaphylaxis (Turner & Boyle, 2014). Interestingly, the IMD status did not impact on prescription rates, something which is contrary to other chronic health conditions including asthma (Mooney et al., 2022). Perhaps of greater concern is the fact that under- prescription of AAI extended to even those where national guidelines explicitly state AAI should be prescribed, i.e. those with previous anaphylaxis to a food allergen (NICE, 2011). Only 54% of children and 33% of adults had AAI prescribed on “repeat prescription,” despite having a documented episode of previous anaphylaxis. This is noteworthy, since the provision of AAI as rescue medication is an essential component of managing risk in food-allergic individuals (NICE, 2011). Reasons for this are unclear but likely to be multifactorial: there may be an element of miscoding, but also communication issues between hospitals and primary care in flagging which patients require ongoing AAI prescription. A further factor is whether patients with prior anaphylaxis are contacting their GP surgeries to request repeat prescription.
The estimates for prevalence are consistent with those previously reported for the UK. We found a prevalence for food allergy of 4.6% in the preschool age group, which is likely to be an overestimate of the true rate of IgE-mediated food allergy, in part because of the prevalence of non-IgE-mediated allergy to cow’s milk which is seen in infancy but typically resolves by school age. The UK-based EAT study reported a prevalence of challenge-proven food allergy at age 3 years of 7.1%, although this was in a selected cohort with a higher-than-expected proportion of infants with early-onset eczema, a known risk factor for food allergy (Perkin et al., 2016).
Based on open food challenge and/or suggestive history and skin tests (which is probably equivalent to the diagnostic algorithms used in the NHS setting), the FSA-funded FAIR birth cohort study in the IoW reported a rate of IgE-mediated food allergy of 5.0% (95% CI: 3.7–6.5), 2.5% (95% CI 1.5–3.8) and 3.0% at age 3, 6 and 10 years respectively (Venter et al., 2006, 2008; Venter, Maslin, et al., 2016). The consistency between these estimates for food allergy in children and those reported in the current analysis give further confidence in the reported estimated prevalence (of around 1%) for food allergy in adults on the basis of CPRD data.
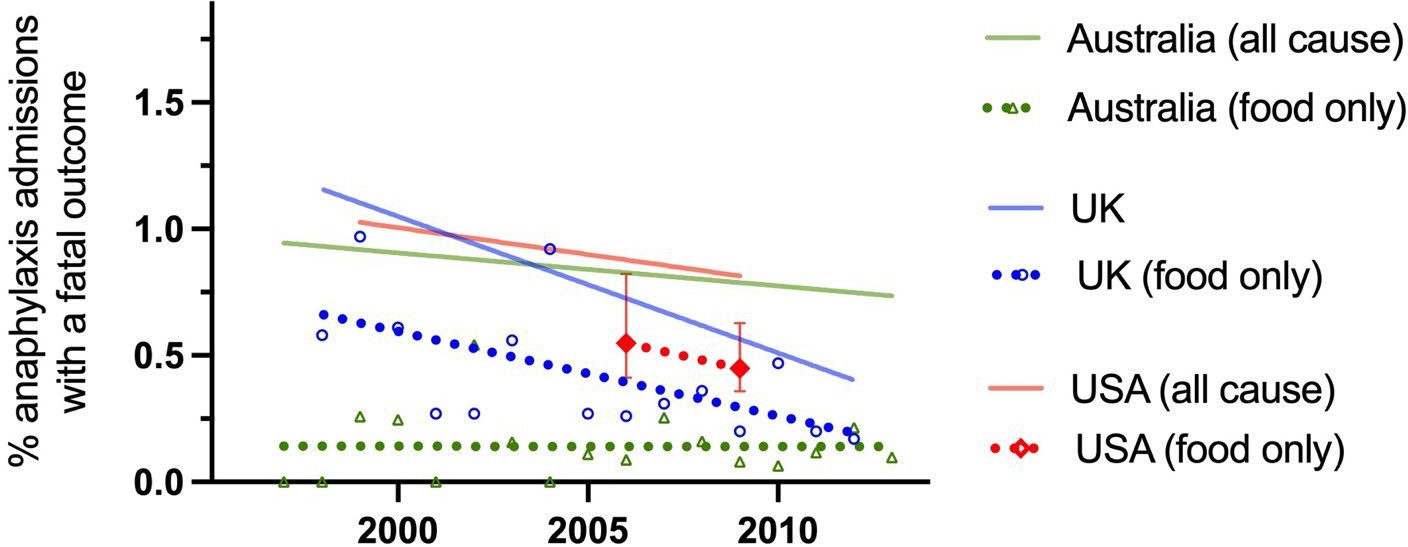
In the analysis of hospitalisations and fatalities due to food anaphylaxis over a 20-year period (Section 6 of this report), we demonstrated that while hospitalisations have continued to increase across all age groups, fatalities due to food anaphylaxis have not. Furthermore, over the same time period, the case fatality rate has more than halved, from 0.7% in 1998 to 0.3% in 2018. These data extend previous findings reported for England and Wales to encompass the UK population (Turner et al., 2015), and are consistent with epidemiological trends in hospitalisations for anaphylaxis from USA and Australia (Figure 23) (Turner et al., 2020).
_in_uk__australia_and_usa.jpeg)
Improvements in the recognition and management of anaphylaxis may explain, at least in the part, the decrease in case fatality rate despite increasing anaphylaxis hospitalisations. There is no evidence to suggest that the clinical criteria used to diagnose anaphylaxis has changed in the UK over the study period. It is likely that the introduction of national guidance from the NICE in 2011 resulted in a small increase in hospitalisations due to anaphylaxis, but the year-on-year increase has persisted since.
Whether this is due to a true increase in the prevalence of anaphylaxis (rather than a reduction in the threshold to admit patients presenting with anaphylaxis) is unclear, as the evidence for an increase in prevalence of food allergy in the UK (and elsewhere) over the same time period is lacking (Venter et al., 2010).
These data represent the largest published series of food-anaphylaxis fatalities in the literature, and clearly demonstrate that while preschool-aged children have the highest rate of hospitalisation due to anaphylaxis, the case fatality rate in this age group is very low. Teenagers are considered to be at highest risk for fatal reactions (Marrs & Lack, 2013; Turner et al., 2015), but our data imply that while this is true, the case fatality rate remains elevated well into mid-adulthood. This challenges the traditional view that teenagers are more at risk of fatal outcomes due to risk-taking behaviours (Marrs & Lack, 2013), and supports our hypothesis that there may be a specific, age-dependent vulnerability to severe outcomes from food-induced allergic reactions in early-mid adulthood (Turner et al., 2015).
By including published data relating to fatal food anaphylaxis in this analysis, we observed that over the past 25 years, there has been a decrease in the proportion of fatal reactions due to peanut/tree nuts (which we attribute to removal of these ingredients from many confectionery brands and general avoidance by food businesses), but a concerning increase in those due to cow’s milk, such that cow’s milk is now the most common cause of fatal food anaphylaxis in children in the UK. The increase in milk as a cause of severe anaphylaxis has also been noted in North America and Israel (Hoffer et al, 2022, Levy et al., 2012; Ramsey et al., 2019). Furthermore, in the UK, cow’s milk allergy is relatively uncommon in adults but was still responsible for 5% of fatal food reactions in this age group. There is increasing awareness amongst food business operators and the general public over food allergy related to peanut and tree nuts, but not to cow’s milk (Turner et al, 2013, Barnett et al., 2018). Cow’s milk is ubiquitous in the Western diet, and has a relatively high protein content so very low levels of exposure may be sufficient to cause reactions. Allergen control is further complicated by the possibility of homogenous (where the allergen is equally dispersed throughout the food product) rather than particulate contamination in food preparation (Brough et al., 2015). The majority of children with cow’s milk protein allergy outgrow their allergy in early childhood (L. B. Grabenhenrich et al., 2016), but those with persisting milk allergy tend to have other concomitant atopic diseases including asthma (Turner, 2013). Furthermore, the lower proportion of food-anaphylaxis reported to milk in older children in the European Anaphylaxis Registry raises a concern that those reactions which do occur triggered by milk exposure in older children may be of a greater severity (L. B. Grabenhenrich et al., 2016).
It is interesting to compare the apparent increase in food allergy prevalence reported in Section 5, with the increase in hospital admissions reported in Section 6 over the same time period. Our analysis shows that across all ages, incidence and prevalence has approximately doubled over 2008-2018. In terms of hospital admissions for food-induced anaphylaxis, there has also been a doubling in rates over the same time period in the 0- 14 and 15-64 year age groups. This consistency is noteworthy, but it is unclear whether these data reflect a true increase in food allergy prevalence.
As has been highlighted in a recent commentary in the British Medical Journal, “when we review prevalence data for food allergy, we see a familiar pattern—sharp increases in softer indicators of allergy such as self-report, prescription, and healthcare attendance rates; but no increase in markers of severe disease such as fatal reactions, or in objective markers such as allergic sensitisation, or challenge-proven food allergy” (Turner & Boyle, 2021). Whether there has been a true increase in the rate of food allergies over the past 2–3 decades in the UK is unclear. The IoW cohorts did not demonstrate any evidence for an increase in peanut allergy between the cohort born in 1989 and that in 2001/2 (Venter et al., 2010). The reported rate of peanut allergy was 1.2–1.4% (95%CI 0.6–2.2%) in an unselected cohort, compared with 2.5% (95%CI 1.3–4.2%) for peanut at the same age (3 years) in a selected cohort arguably at higher risk of food allergy, in the EAT study (Perkin et al., 2016). It is therefore entirely possible that the increase in incidence and prevalence observed in the CPRD dataset reflects greater awareness of food allergy amongst the public and healthcare professionals.
Finally, the observation that from 2014–2018, there has been a plateauing in the incidence/prevalence of food allergy, and potentially even a reduction in 2018, requires further analysis. One of the biggest changes in public policy with respect to food allergy has come from a series of primary prevention trials which demonstrated that the introduction of potential food allergens into the infant diet before age 12 months reduces the risk of subsequent development of food allergy, at least for peanut and egg (Turner, Campbell, et al., 2018; Turner, Feeney, et al., 2018). It would therefore be interesting to assess whether this pattern has continued beyond 2018. Unfortunately, the data for 2020/21 are very likely to be affected by the impact of the COVID-19 pandemic.
7.1. Strengths and limitations
The use of a national dataset in the context of the UK health system provides a unique opportunity to draw robust conclusions as to changes in hospital admissions and outcomes due to food anaphylaxis, compared with other countries where data collection may be less systematic and not applied to the entire population. However, our data do have some limitations as previously discussed elsewhere (Turner et al., 2015, 2019; Turner & Campbell, 2016), including miscoding (both for the eliciting trigger but also misdiagnosis, with non-anaphylaxis reactions being miscoded as anaphylaxis). By using the same methods throughout the study period, we were able to monitor time trends irrespective of the risk of miscoding which is unlikely to have been affected by time.
Unfortunately, we were unable to include cases of anaphylaxis seen in Emergency departments that did not require hospitalisation, as these datasets are incomplete and very prone to miscoding (Turner et al., 2015).
Of more concern is the fact that the vast majority of healthcare visits for food allergy occurred in primary care. Less than 3% of individuals with a diagnosis of food allergy attended A&E during the study period, 2008-2018. Therefore, using hospital data in isolation to analyse patterns of health service utilisation with respect to food allergy and FHS is unlikely to provide a comprehensive overview.
A further consideration is whether our analysis captured individuals with Pollen Food Allergy Syndrome (PFAS). This occurs when patients – primarily sensitised to aeroallergens such as birch pollen – develop symptoms to structurally-similar proteins in plant foods (particularly stone fruit, nuts, apples and carrots). Systemic reactions in PFAS are less common compared to “primary” food allergy; this is because the allergen is heat- labile and typically denatured by gastric acid which thus limits potential for more severe symptoms. Patients with PFAS therefore tend to react only to the raw food, typically experiencing mild “hay fever symptoms” of the mouth/throat such as oral itch. PFAS affects around 2% of the UK adult population (Skypala et al., 2013); these individuals may be less likely to seek medical review due to the milder nature of their symptoms. In the current study, only 2905 patients had a diagnosis of PFAS out of a total adult cohort of >6 million patients. Therefore, the prevalence estimates in the current analysis of CPRD data is unlikely to have adequately captured patients with PFAS.
Our data highlight some of the potential pitfalls in analysing health datasets in terms of anaphylaxis admissions. Hospital admissions for anaphylaxis are often used as a surrogate measure for the occurrence of anaphylaxis, but this is a false assumption. González-Pérez reported that under half of anaphylaxis presentations in a UK analysis presented to Emergency Departments (González-Pérez et al., 2010). There is little evidence that the incidence of food allergy or anaphylaxis has increased over the past decade in the UK (Venter et al., 2010); prescriptions of AAI have increased at a year-on- year rate of 11% (despite anaphylaxis hospitalisations increasing at around half that rate over the same period), but this does not imply an increase in prevalence of individuals at risk of anaphylaxis (Baseggio Conrado et al., 2021). At least in the UK, “allergy” admissions include elective day-case procedures such as oral food challenges. As a result, only approximately 30% of hospital admissions for “allergy” are due to food anaphylaxis. Due to the limitations of ICD-10, food-related anaphylaxis reactions will often be coded as anaphylactic “shock”, despite the fact that “shock” is a rare occurrence in food anaphylaxis (Turner et al., 2015, 2019; Turner & Campbell, 2016). Thus, no conclusions can be drawn as to the severity of anaphylaxis when analysing hospital admissions, unless other considerations are taken into account (such as admission to intensive care or fatal outcomes). The introduction of ICD-11 will hopefully address many of the current limitations of ICD-10 (Tanno et al., 2020) – for example, due to the inclusion of common specific allergens as part of the coding – although a proposal to include a classification of anaphylaxis by clinical severity was rejected (Tanno et al., 2017).
The use of a large, population-based dataset including linked primary and secondary care data allowed the evaluation of trends in food allergy epidemiology over time. However, the findings are limited by the limitations of the diagnostic process used to inform diagnosis (Turner & Boyle, 2014), and the risk of miscoding/misclassification. In particular, we identified a potential issue with the use of ICD-10 codes within secondary care, although steps were taken to limit this by using secondary care ICD-10 codes based on first two diagnostic positions and using consistent similar methodology throughout the study period.
We identified a significant proportion of patients with an apparent ICD-10 code for food allergy but no corresponding diagnostic code on the primary care record. There are a number of limitations of ICD-10 codes for food allergy, which has been outlined elsewhere (Tanno et al., 2017, 2020). These include miscoding of non-acute visits to hospital for food allergy, for which a new code (Z91.01) was introduced in 2016, but not in the UK. The introduction of ICD-11 (currently under evaluation for use in the NHS) will hopefully address many of the current limitations of ICD-10.
7.2. Conclusions and policy implications
We have demonstrated a fall in case fatality rates due to food anaphylaxis between 1998 and 2018 in the UK, despite a three-fold increase in hospital admissions due to food anaphylaxis over the same time. Cow’s milk is increasingly seen as the culprit allergen for fatal food reactions, and is now the commonest cause of fatal anaphylaxis in children. More education is needed to highlight the specific risks posed by cow’s milk to allergic individuals, to increase awareness amongst food businesses (L. B. Grabenhenrich et al., 2016).
The analysis of the CPRD Aurum dataset provided an estimated prevalence of food allergy in children very similar to that previously reported in birth cohort studies and clinical trials, of up to 4% in the preschool age group (age 0-4 years). The prevalence of food allergy in adults was around 1%. The incidence and prevalence of food allergy may have doubled over the past decade, but this may also reflect increased awareness of food allergy resulting in more diagnosis, rather than a true increase in disease.
Importantly, with respect to food allergy and FHS, analyses which rely solely on hospital data to provide information as to health service utilisation are unlikely to provide a comprehensive overview. These data therefore highlight a crucial need to improve the diagnosis and correct coding of food allergy in all sections of the healthcare system, to better provide for those living with food allergy and address the significant impairment a diagnosis of food allergy has on health-related quality of life.
The data presented in Section 6 have been published open-access in the British Medical Journal (https://doi.org/10.1136/bmj.n251) under a Creative Commons Attribution (CC BY 4.0) license, which permits others to distribute, remix, adapt and build upon this work, for commercial use, provided the original work is properly cited.
Acknowledgements
We thank Dr Julia Stowe and Professor Elizabeth Miller at the UK Health Security Agency (UKHSA) for their assistance in providing data from the HES national database.
The following study team members contributed to the analyses presented in Section 5:
-
Eimear O’Rourke
-
Dr Constantinos Kallis
We also thank the following individuals who contributed to the exploratory analyses presented in Section 5.2.5:
-
Professor Adnan Custovic
-
Dr Sadia Haider
-
Anhar Ullah
-
Dr Darije Custovic
-
Dr Sara Fontanella
This report has been produced by Imperial College London under a contract placed by the Food Standards Agency (the Agency). The views expressed herein are not necessarily those of the Agency. Imperial College London warrants that all reasonable skill and care has been used in preparing this report. Notwithstanding, Imperial College London shall not be under any liability for loss of profit, business, revenues or any special indirect or consequential damage of any nature whatsoever or loss of anticipated saving or for any increased costs sustained by the client or his or her servants or agents arising in any way whether directly or indirectly as a result of reliance on this report or of any error or defect in this report.
Related publications
Baseggio Conrado, A., Ierodiakonou, D., Gowland, M. H., Boyle, R. J., & Turner, P. J. (2021). Food anaphylaxis in the United Kingdom: analysis of national data, 1998-2018. BMJ, 372, n251. https://doi.org/10.1136/bmj.n251
Turner, P. J., Baseggio Conrado, A., Kallis, C., O’Rourke, E., Haider, S., Ullah, A., Custovic, D., Custovic, A., & Quint, J. Q. (2024). Time trends in the epidemiology of food allergy in England: an observational analysis of Clinical Practice Research Datalink data. The Lancet Public Health, 9(9), 664-673. https://doi.org/10.1016/S2468-2667(24)00163-4