Executive summary
About the research
Infectious Intestinal Disease (IID) is a major cause of illness in the UK with an estimated 17 million cases in the UK every year. Of these around 2.4 million are thought to be attributed to food.
Following the start of the COVID-19 pandemic in the UK the Food Standards Agency (FSA) and Food Standards Scotland (FSS) commissioned a series of surveys examining the prevalence of self-reported IID. The aims of these surveys were to better understand the impact of the pandemic on the prevalence of IID and underreporting of IID. Ipsos UK were commissioned to undertake nationally representative online panel surveys to explore the impact of the COVID-19 pandemic on the prevalence of IID among the general population.
A key objective of this research was to test the hypothesis that behavioural changes put in place due to the pandemic (for example, reduced travel, less eating out, and leaving the house less often) had an impact on the prevalence of IID. A second key objective was to gain information on the underreporting of IID, which is likely to have been affected by fewer people with symptoms accessing healthcare during the pandemic. The FSA usually tracks IID rates for major pathogens using confirmed laboratory reports as a proxy. While there is known to be underreporting, as not everyone who gets ill goes to their GP, these underreporting rates are assumed to be stable over time. During the COVID-19 pandemic such an assumption was unlikely still to hold true as contacts with GPs were expected to be reduced.
Other information was also collected as part of this research from those self-reporting IID, including access to medical care and whether the participant had COVID-19. Questions on specific behaviours were asked to those with IID, in addition to a representative sample of participants who had no symptoms to act as a control group, allowing a comparison between those with IID and those without, to test the correlation of each behaviour with IID.
Six waves of the survey were undertaken across the UK between August 2020 and March 2022, collecting data at different stages of the COVID-19 pandemic. Survey fieldwork for each wave happened in response to when different lockdown restrictions were in place nationally or locally (for example limited access to schools, retail and hospitality and workplaces), or during periods when restrictions were reduced or removed. Fieldwork for adults and children was carried out at the same time for the first four waves, with the final waves run separately. (Wave 5 with adults only and Wave 6 with children only). In total, five waves of research were conducted for both adults and children (see Annex A for further information about the lockdown restrictions in place at the time of each survey wave).
-
Wave 1 (27 August – 17 September 2020): adults 8,545 and children 1,988
-
Wave 2 (2 December – 18 December 2020): adults 8,993 and children 2,297
-
Wave 3 (15 February – 3 March 2021): adults 8,916 and children 2,445
-
Wave 4 (26 August – 20 September 2021): adults 9,000 and children 2,363
-
Wave 5 (9 December 2021 – 5 January 2022): adults only 8,933
-
Wave 6 (15 February – 10 March 2022): children only 2,459
Findings for adults were self-reported, while parents or guardians were asked to answer on behalf of children in their care (throughout the rest of this report the term parents is used to refer to both parents and guardians). The findings are subject to a range of potential biases, including social desirability bias, and care should be taken when interpreting findings. These biases may also be different for adults and children given the different approaches taken, for example recall bias (where participants must recall past behaviours some time after they happened) is likely to be different for adults answering on behalf of their children (See section ‘Notes on interpreting the data’ for more information on recall and social desirability bias).
Key findings
Estimates for the prevalence of domestic IID
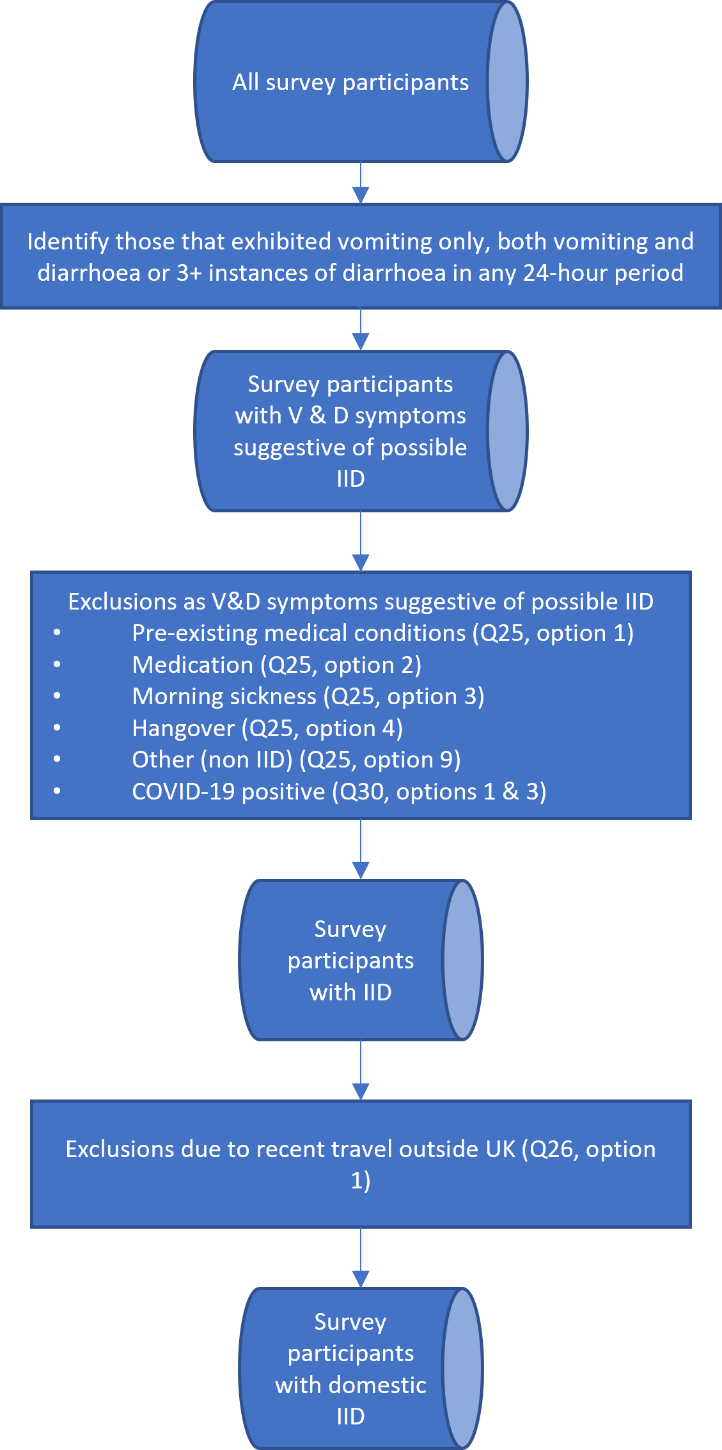
An estimate for the prevalence of domestic IID in the UK was calculated after excluding some self-reported causes (on the basis that these were not directly related to IID), and removing those who had COVID-19 at the time of their symptoms (vomiting and diarrhoea are also symptoms associated with COVID-19) or who had travelled outside the UK in the two weeks before their symptoms started.
The overall estimate for domestic IID among UK adults in the previous 28 days was significantly higher in Wave 4 (7.8%), and Wave 5 (6.5%) compared to the previous three waves (W1 5.6%, W2 5.7%, W3 5.2%). Restrictions put in place to manage COVID-19 infections changed over time but were being eased nationally when Waves 4 and 5 were carried out.
The overall estimate for domestic IID among UK children in the previous 28 days were significantly higher in Wave 6 (12.7%) compared to the previous four waves (W1 6.4%, W2 8.1%, W3 7.8%, W4 7.2%). The fieldwork for Wave 6 happened during term time and when most COVID-19 restrictions had been lifted. Prevalence rates in Wave 2 and Wave 3 were both significantly higher than Wave 1.
There is likely to be some seasonality in IID so differences in waves conducted at similar times of year are particularly noteworthy (i.e. for adults Waves 1 and 4 and Waves 2 and 5 and Waves 3 and 6 for children).
Medical care and test results
Overall, there was a significant increase from Wave 1 in the proportion of adults with domestic IID seeking medical help for their illness, with 22% in Wave 1, rising to 34% reporting doing so in Wave 5. Adults with domestic IID were more likely to attend their usual GP practice in person in Wave 4 (5%) and Wave 5 (6%) compared with Wave 3 (2%). Similarly, adults were also less likely to consult with a pharmacist in Wave 1 (5%), compared with Wave 2, Wave 3 and Wave 5 (all 8%).
Significantly more parents of children with domestic IID reported seeking medical help during their child’s most recent bout of illness in Wave 6 (54%), as most restrictions were lifted, compared with Wave 1 (41%) and Wave 2 (44%). Parents were less likely to consult with their GP on the phone or online in Wave 1 (11%) compared with Wave 3 (20%), Wave 4 (22%) and Wave 6 (20%).
The proportion of adults with domestic IID that visited A&E was significantly higher in Wave 1, Wave 3 and Wave 5 (all 3%) compared with Wave 4 (1%). There were no significant differences between survey waves in the proportion of children that visited A&E (W1 and W2 both 3%, W3 6%, W4 5% and W6 3%).
The proportion of adults with domestic IID that reported attending hospital during their illness ranged between 4% and 6% (W1 to W3 all 4%, W4 5%, W5 6%), with no statistically significant differences between survey waves. Similarly, among parents of children with domestic IID there were no statistically significant differences in the percentage of children that attended hospital in each wave (W1 4%, W2 7%, W3 8%, W4 and W6 both 7%).
Overall, similar proportions of those with domestic IID provided a stool or blood sample across all waves, both among adults (W1 7%, W2 10%, W3 9%, W4 7%, and W5 9%) and among children (W1 9%, W2 7%, W3 and W4 both 9%, W6 10%). These differences are not statistically significant.
Behavioural and contextual comparisons
Findings about behavioural and contextual comparisons are included in this report to give an indication of the overall similarities and differences between those with domestic IID and the comparison group (adults and children that did not report IID symptoms). Further analysis is required to understand the relationship between these behaviours and IID symptoms, and the differences described do not on their own provide evidence of causation. It is also worth noting that many of the behaviours themselves will be correlated. For example, those leaving the house less often will be less likely to use public transport, eat out, and so on.
Leaving the house
The proportion of adults with domestic IID that reported they had left the house in the previous four weeks was significantly higher than for the comparison group in all waves of the adult survey – Wave 1 (47% IID vs. 31% comparison), Wave 2 (53% vs. 39%), Wave 3 (37% vs. 28%), Wave 4 (51% vs. 36%), Wave 5 (61% vs. 50%). The proportion of adults with domestic IID where any member of the household had left the home in the previous four weeks was also significantly higher than the comparison group (W1 65% IID vs. 51% comparison, W2 73% vs. 61%, W3 61% vs. 47%, W4 72% vs. 56%, W5 78% vs. 65%).
Children with domestic IID were more likely to be reported as having left the house in the previous four weeks than children in the comparison group in Wave 1 (41%, IID vs. 26% comparison), Wave 3 (34% vs. 21%) and Wave 4 (43% vs. 34%). Overall, in Wave 1, Wave 3, Wave 4 and Wave 6 the proportion of children with domestic IID where any member of the household had left the home in the previous four weeks was significantly higher than the comparison group (W1 84% IID vs. 63% comparison, W3 78% vs. 60%, W4 84% vs. 70%, W6 91% vs. 86%).
Using public transport
Across all five waves, the proportion of adults with domestic IID that had left the house and had used public transport in the previous four weeks was significantly higher than the comparison group (W1 40% IID vs. 28% comparison, W2 35% vs. 20%, W3 30% vs. 18%, W4 50% vs. 41%, W5 55% vs. 44%).
The equivalent proportion of children with domestic IID who had left the house and had used public transport was also significantly higher compared with those children in the comparison group in Waves 1 to 3 (W1 37% IID vs. 23% comparison, W2 27% vs. 18%, W3 32% vs. 10%).
Consuming food outside the home
In each survey wave, the proportion of adults with domestic IID that reported consuming food prepared outside the home across a range of settings was generally higher than for those in the comparison group. For example, the proportion of adults with domestic IID that had eaten food provided in workplace or education settings was consistently significantly higher compared with adults that had no IID symptoms (W1 23% IID vs. 15% comparison, W2 29% vs. 18%, W3 31% vs. 15%, W4 37% vs. 24%, W5 30% vs. 23%). This was also the case for adults that had bought and consumed ‘ready to eat’ food (W1 49% IID vs. 31% comparison, W2 42% vs. 31%, W3 51% vs. 23%, W4 50% vs. 36%, W5 53% vs. 35%).
The proportion of children with domestic IID consuming food prepared outside the home in the previous four weeks was often higher compared with children with no IID symptoms. A quarter (25%) of children with domestic IID in Wave 2, Wave 3 and Wave 6, had consumed bought ‘ready to eat’ food when in a work (children can work part time from the age of 13), education or a childcare setting. This was significantly higher than those in the comparison group (W2 9% comparison, W3 8%, W6 13%). In Wave 4, children with domestic IID were significantly more likely than those in the comparison group to eat food provided in the setting (63% IID vs. 46% comparison), across other survey waves the differences for this behaviour were not statistically significant.
Handwashing
Questions relating to handwashing behaviours will be subject to a degree of self-reporting and recall bias. Parents may not be able to accurately report on their child’s handwashing behaviours and it is possible that participants will over-report socially desirable handwashing behaviours and under-report socially undesirable behaviours.
Across all survey waves, the proportion of adults with domestic IID that reported always washing their hands after going to the toilet was significantly lower compared with those in the comparison group (W1 83% IID vs. 90% comparison, W2 83% vs. 89%, W3 78% vs. 86%, W4 78% vs. 83%, W5 78% vs. 84%). Self-reported handwashing behaviours among adults in the domestic IID group and comparison group were similar in other situations (after a trip outside the home, after blowing their nose or coughing, before cooking/preparing food or eating).
Handwashing behaviours reported by parents among children in the domestic IID group and comparison group were broadly similar. However, there were some significant differences between survey waves in reported handwashing behaviours in specific situations. For example, in Wave 2 and Wave 6 children with domestic IID were significantly more likely than those in the comparison group to report that they never washed their hands after blowing their nose, sneezing or coughing into their hands (W2 11% IID vs. 6% comparison, W6 10% vs. 6%). In Wave 1, Wave 2 and Wave 4 the proportion of children with no IID symptoms that always washed their hands after going to the toilet was significantly higher than those with domestic IID (W1 56% IID vs. 69% comparison, W2 58% vs. 68%, W4 43% vs. 67%).
Introduction
Background
The COVID-19 outbreak and associated measures put in place by the government, businesses and individuals have changed many of our eating habits. Lockdowns and other restrictions have closed restaurants and changed availability and demand around take away services. COVID-19 has also reduced and changed social contact, as well as raising the profile of good hygiene practices. All these measures have the potential to play an important role on the likelihood of people getting diseases, including Infectious Intestinal Disease (IID). Although the FSA’s main interest is IID transmitted via food, this study covers IID more generally as it was not possible to determine the proportion due to different transmissions routes.
The prevalence of IID in the population has previously been estimated using several different approaches. To better assess the prevalence of IID during the COVID-19 pandemic, the FSA commissioned Ipsos UK to undertake a nationally representative online panel survey to gather information about foodborne diseases (FBD, also known as food poisoning) and IID among the general population. The research was originally designed to include a first wave while there was still significant community COVID-19 infection with a second wave carried out once the restrictions linked to COVID-19 had been lifted. As restrictions tightened following the fieldwork for the first wave, further waves of research were carried out.
Longer term, this work will enable the FSA to test the effectiveness of an online panel survey as a possible rapid measurement tool for use between larger IID cohort studies. This project supports the FSA’s strategic objectives of reducing foodborne disease, making food safe, and improving its evidence base.
Research questions
The specific research questions for this study are set out below.
-
What is the self-reported level of IID in the community during the COVID-19 pandemic, and how does it compare across survey periods with varying degrees of COVID-19 restrictions?
-
What proportion of people reporting IID symptoms had COVID-19 as the causal illness?
-
How many people reporting IID consulted a doctor and/or medical practitioner, and if so, were lab tests taken to look for the causative agent of the IID?
-
What are the self-reported differences in major IID risk factors (such as eating, lifestyle and travel) between 1) those who get ill and those who don’t and 2) between survey waves?
This report summarises the findings from six waves of survey fieldwork undertaken to gather evidence to address the research questions. Additional analysis will be undertaken by the FSA to fully answer research question 4.
Methodology
Previous self-reported survey research with the public about IID symptoms has been carried out by telephone using Random Digit Dialling. The move to an online panel quota survey approach has the benefits of being faster, more cost effective, more flexible, and more suited to capturing self-reported findings on a sensitive topic related to IID symptoms and relevant behaviours because no interviewers were involved in data collection. Quota sampling does not offer the same degree of statistical purity as random probability sampling but has a long track record in practice of producing reliable results, and is the main quantitative methodology used across market and social research.
Online quota surveys using Ipsos’ online panel were therefore used to meet the objectives of the study. The size and flexibility of the panel enabled us to establish measures of the national prevalence of IID among adults and children throughout the UK, screening for the groups of interest to this study.
Quota sampling begins by developing targets to ensure the profile of the sample matches ONS or other robust estimates for the population of interest on key characteristics (in this case age, gender, region and social grade). In the case of online panel surveys, large numbers of panellists are invited to take part and screened on these characteristics to build an overall sample that is representative of the population on these characteristics. When sufficient numbers have been reached for a specific characteristic (e.g. an age group or region), the survey is closed to any further respondents with that characteristic. Other technical and quality assurance controls are in place to ensure panellists are real, engaged and unique.
Sample sizes were designed to achieve an appropriate balance between the cost of completing a large-scale survey for screening purposes, with ensuring sufficiently large samples to enable analysis to address the research questions among enough adults and children who had experienced IID symptoms.
As with any research methodology, there are limitations associated with online panel quota surveys, including the lack of coverage of people who are offline, and limited coverage of over 75s. However, the final data was weighted to be representative of the UK population using the ONS 2019 mid-year estimates for age, gender and region, with social grade profile data from PAMCo, a large scale random probability survey run by Ipsos.
Both adult and child populations are of interest to the FSA and FSS, as IID can affect someone of any age. Surveys for adults and children were therefore designed and administered separately, and the data presented separately throughout this report. Adults aged over 16 were asked directly about relevant symptoms of vomiting and diarrhoea, with follow-up questions about their experiences and relevant behaviours.
Panellists were separately screened for the presence of dependent children in the household to build the sample for the children’s survey. In order to have a consistent approach for all children under 16, parents or guardians (throughout the rest of this report the term parents is used to refer to both parents and guardians) who live with their children were asked tailored versions of the same questions as the adult survey. The parents answered on behalf of children, and quotas set based on the profile of under 16-year-olds in the UK. This had practical and cost benefits, as well as allowing better quality evidence to be captured for the youngest children. However, there is a risk that some parents may not have known their child had experienced IID, particularly among older children. Similarly, they may not have known about their child’s behaviours around eating outside the home, travelling or handwashing.
Comparison samples for adults and children at each wave were selected from those who said they had no symptoms of diarrhoea or vomiting in the last four weeks. The comparison sample was designed to be nationally representative on demographic characteristics, with quotas based on gender, age, region and social grade. The quotas for the comparison groups were set on the same basis as for the overall population samples screened for self-reported IID symptoms. Quotas were filled from those who had not experienced self-reported IID symptoms. All those who said they (or their child) had not reported any relevant symptoms were routed to the comparison survey and screened based on key demographic characteristics, as for the overall survey. As quotas filled up, those who were not needed for the comparison sample were screened out. This was done to reduce the overall costs of the survey, avoiding a disproportionately large (and more expensive) comparison sample.
The sample sizes for the Wave 1 screening surveys were based on the approximate percentage of people likely to self-report IID symptoms in the previous 28 days. This approximation was based on a telephone survey with 28 day recall conducted as part of the second study of infectious intestinal disease in the community (IID2 study). This survey found that around 4% of people reported getting ill every 28 days. It should be noted that the IID2 study used a different methodology and is not directly comparable. Based on this previous evidence, the survey samples were expected to identify enough adults and children with IID symptoms to allow for further analysis in line with the objectives. For analysis reasons, the comparison samples were designed to be around 10% of the those screened. It was not proportionate or necessary to capture comparison data from all those who had not experienced IID symptoms as this would have added to the cost without substantial benefits for the subsequent analysis.
Questionnaire development
Ipsos UK worked closely with the FSA to develop a suitable questionnaire for the study, which included questions from previous IID research. In later waves some additional questions were added based on the results of the earlier waves to probe some issues further (these additional questions are highlighted in the questionnaires in Annex G). The adult questionnaire, once finalised, was then adapted for parents to answer on behalf of their child.
Screening for IID symptoms
Self-reported prevalence of IID was measured using two questions. The first question asked participants whether they (parents answered these questions on behalf of their child in the case of the children’s survey) had symptoms of diarrhoea or vomiting in the last four weeks. Those who had experienced vomiting or vomiting and diarrhoea in the last four weeks passed the screening at this first question. Those who had experienced diarrhoea only were asked a follow-up question to determine whether they had experienced more than three instances of diarrhoea in any 24-hour period in the last four weeks. If they had experienced more than three instances, they passed the screening at the second question and completed a 15-minute online survey about relevant behaviours and characteristics, symptoms experienced, and medical assistance, diagnosis, and treatment where relevant. Those who said they had more than one bout of IID symptoms in the last four weeks were asked to report about their most recent bout of illness for the remaining survey questions and they have only been counted once when estimating prevalence rates.
The findings attributed to children throughout the report are based on the responses of parents answering on their behalf. To identify those who have any children who have had IID symptoms, a sample of parents with children in the desired age range was screened. Parents with more than one child provided the age and gender of all children in the household and one of these was randomly selected through the survey script. Quotas were set to ensure we reached a nationally representative sample of children on the basis of age of child, gender of child, region and parent social grade.
This approach gives a prevalence figure for the proportion of children under 16 who had experienced IID symptoms in the last 28 days. Those parents with a child who had experienced IID were then asked a modified version of the follow-up questionnaire, relevant for the age group and that could be answered by parents on the child’s behalf.
The following samples were achieved:
-
Wave 1: adults 8,545 and children 1,988
-
Wave 2: adults 8,993 and children 2,297
-
Wave 3: adults 8,916 and children 2,445
-
Wave 4: adults 9,000 and children 2,363
-
Wave 5: adults only 8,933
-
Wave 6: children only 2,459
Wave 5 with adults only was commissioned rapidly in response to the emergence of the Omicron variant of COVID-19 and to complete the fieldwork prior to any further lockdown restrictions being put in place. A decision had to be made to prioritise the adult survey on the basis that there was only resource to deliver one survey at such short notice and before Christmas. In the end no further lockdown was introduced. Wave 6 with children only was commissioned once the impact of the Omicron variant was better understood and resource pressures had eased.
Among those adults and children who had not experienced IID symptoms, a nationally representative comparison sample was built based on screening quotas from those who had not experienced any IID symptoms. They were routed to a 10-minute survey capturing data about the same behaviours and demographic characteristics as those who had experienced IID.
The following samples were achieved:
-
Wave 1: adults 855, children 461
-
Wave 2: adults 995, children 500
-
Wave 3: adults 1,050, children 500
-
Wave 4: adults 1,000, children 500
-
Wave 5: adults only 1,000
-
Wave 6: children only 500
Quotas for the overall sample were set for age, gender, region, and social grade, to ensure the profile represented the UK population (the make-up of the panel meant we could not set a hard quota on ethnicity for the surveys, but this was monitored closely to get as representative split as possible). These same quotas applied to the comparison sample.
Fieldwork timings
The fieldwork was carried out at different stages of the COVID-19 pandemic, both when strict restrictions were in place, nationally or locally (for example limited access to schools, retail and hospitality and workplaces) and during periods when restrictions were reduced or removed. Figure 1 sets out the fieldwork timings for each wave within a timeline of COVID-19 restrictions. A more detailed timeline can be found in Annex A. It is important to note that in each wave participants were asked to use a four-week reference period for reporting symptoms. Fieldwork in Wave 2 and Wave 3 were completed in approximately two weeks, other waves took three weeks to achieve the quota samples.
Figure 1.Fieldwork timings and general UK lockdown conditions
| Fieldwork timings and general lockdown conditions (UK) |
Wave 1
27 Aug-17 Sep 2020 |
Wave 2
2-18 Dec
2020 |
Wave 3
15 Feb-3 Mar 2021 |
Wave 4
26 Aug-20 Sep 2021 |
Wave 5
9 Dec 2021
-5 Jan 2022 |
Wave 6
15 Feb-10 Mar 2022 |
| General context |
Restrictions easing, ‘Eat out to help out’ scheme |
Lockdowns enforced across the UK |
Restrictions lifting |
Restrictions lifting, legal limits on social distancing removed |
Omicron variant, work from home guidance, return of social distancing and venue closures |
Restrictions lifted, work from home guidance removed and isolation period reduced |
| Schools |
Open |
Open |
Closed in England
Phased reopening of schools in Scotland from February |
Open |
Open |
Open |
| Restaurants |
Open with restrictions |
Open with restrictions |
Closed |
Fully open |
Fully open |
Fully open |
| Travel outside the UK |
Travel corridors in play |
Travel corridors in play |
Mandatory hotel quarantine for anyone returning to the UK having visited a country on the travel ban "red list" (Applies only to UK citizens and residents - others refused entry) |
Mandatory hotel quarantine for anyone returning to the UK having visited a country on the travel ban "red list" (Applies only to UK citizens and residents - others refused entry) |
Mandatory hotel quarantine for anyone returning to the UK having visited a country on the travel ban "red list" (Applies only to UK citizens and residents - others refused entry) |
No restrictions |
| Public transport |
Mandatory face covering in public spaces |
Mandatory face covering in public spaces |
Mandatory face covering in public spaces |
Mandatory face covering in public spaces |
Mandatory face covering in public spaces |
Mandatory face coverings in public spaces dropped in England only |
Sampling and weighting
Quota sampling was used for both the adult and children surveys to achieve two separate representative samples for estimating the prevalence of IID and understanding relevant behaviours among: (i) adults aged 16+ across the UK, and (ii) children aged under 16 in the UK, via a survey of parents. Quota samples are used extensively in social and market research and have in practice been shown to give good estimates of population characteristics. They also have the benefit of helping to reduce participation bias – which might otherwise be an issue for this sensitive topic. But it is important to emphasise that the online panel is designed to be representative of the online population, which means there are some limitations in terms of population coverage. However, the panel is maintained with comparability and tracking in mind, meaning changes from wave to wave will not be as a result of changes to the underlying sample.
Further details of the quotas and achieved samples for adults and children are included in the appendices to this report.
For both the adult and children surveys, final data was weighted to adjust the profile based on quotas set for age, gender, region and social grade for each sample. Separate weighting schemes apply to the adult and children samples, and to the comparison samples in each wave. Weighting was carried out using a standard research industry technique called Random Iterative Method (RIM) weighting. Given a set of targets on key demographics, RIM weighting adjusts the sample until a solution is found which is as close as possible to the required sample profile. Weighting is used to adjust the demographic profile of the achieved sample to match that of the population overall. This is a standard approach for quota samples. Weighting was applied to adjust the final overall sample of adults and children screened for IID symptoms, and this has been used when estimating incidence figures and for analysing responses among those reporting IID symptoms. A second weight was calculated for the comparison group. The comparison weight was based on achieving a nationally representative sample of those who had not experienced any IID symptoms.
Notes on interpreting the data
Self-reporting and recall bias
Participants were asked to recall their own or their child’s IID symptoms and a range of specific behaviours over the previous 28 days. There is a risk that their responses may be inaccurate (particularly when parents are reporting on behalf of their child) and they will also be subject to a range of self-reporting biases. This limitation is evident in surveys, where participants must recall past behaviours some time after they happened. To reduce this risk, participants were only asked about symptoms and behaviours within a relatively short timescale of the previous 28 days. However, it is not possible to completely eliminate issues around recall, as participants must still accurately remember and record responses to the survey questions.
Social desirability bias
Social desirability bias (SDB) in social research means participants may change their answers to look better to others or to feel better about themselves. This causes over-reporting of socially desirable attitudes or behaviours and under-reporting of socially undesirable attitudes or behaviours. SDB is more likely in social research designs that include self-reported measures, personal and sensitive topics, such as IID symptoms or handwashing behaviours. Using a self-administered online survey method was designed to reduce the impact of SDB. In addition, each question included a ‘prefer not to say’ option, questions could be skipped if the participant did not want to supply an answer and they could withdraw from the survey at any time. Participants were also informed that their survey responses would be anonymous and used only for research purposes. All these mitigations help to limit this bias but do not eliminate it completely.
Sampling variation and statistical significance
Survey results are subject to sampling variation and this uncertainty is often expressed as confidence intervals. In the case when the statistic of interest is expressed as a percentage, these vary according to the size of the sample and the percentage value concerned. Statistically significant differences at the 5% level between sub-groups were ascertained by the two-sample independent t-test.
Many of the apparent differences in the report are not statistically significant on this basis and differences between findings for children and adults should also be treated with caution because of the different methodologies used.
Significant difference is indicated through the use of letters.
In the example shown in figure 2, each column has a letter, for example Wave 1 (A), Wave 2 (B), and so on. If a percentage in the table has a letter next to it in brackets, it indicates that the figure in the corresponding column (in this case separate waves of the adult survey) is the subgroup with the higher percentage. In these tables comparisons are only made between variables within the same row.
Figure 2.Type of medical help sought for recent bout of illness by adults
| Medical help sought for recent bout of illness among adults |
Wave 1
27 Aug-17 Sep 2020
(A) |
Wave 2
2-18 Dec
2020
(B) |
Wave 3
15 Feb-3 Mar 2021
(C) |
Wave 4
26 Aug-20 Sep 2021
(D) |
Wave 5
9 Dec 2021-
5 Jan 2022
(E) |
| Adults: Base sizes (n) |
476 |
508 |
465 |
681 |
556 |
| Attended usual GP practice in person |
4% |
3% |
2% |
5%
(C) |
6%
(C) |
| Consulted with usual GP practice on phone/online |
7% |
10% |
10% |
10%
(A) |
13%
(A) |
In this example among adults in the UK with domestic IID the proportion that attended their usual GP practice in person was significantly different in Wave 4 and Wave 5 than in Wave 3 (C) and the proportion who reported consulting with their usual GP practice on the phone or online was significantly different in Wave 4 (D) and Wave 5 (E) than in Wave 1 (A). Where there are significant differences, these will usually be described as significantly higher or significantly lower depending on the comparison being made.
In example figure 3, each row has a letter, for example Wave 1 domestic IID (A), Wave 1 comparison (B), and so on. In these cases, the tables are designed to highlight differences within a survey wave between domestic IID and comparison samples, rather than between findings for different waves. In this example the proportion of adults in the comparison sample reporting always washing their hands in Wave 1 (B) and Wave 2 (D) was significantly higher than adults with domestic IID in Wave 1 (A) and Wave 2 (C). In Wave 2 (C) the proportion of adults with domestic IID reporting washing their hands most of the time was significantly higher than adults in the comparison group (D).
Figure 3.Frequency of handwashing after going to the toilet by adults
| Frequency of handwashing after going to the toilet |
Adults: Base sizes (n) |
Always |
Most of the time |
Sometimes |
Never |
Prefer not to say |
Wave 1
27 Aug-17 Sep 2020 Domestic IID
(A) |
476 |
83% |
10% |
5% |
1% |
1% |
Wave 1
27 Aug-17 Sep 2020 Comparison
(B) |
855 |
90%
(A) |
7% |
3% |
*% |
*% |
Wave 2
2-18 Dec 2020
Domestic IID
(C) |
508 |
83% |
11%
(D) |
5% |
1% |
1% |
Wave 2
2-18 Dec 2020
Comparison
(D) |
995 |
89%
(C) |
7% |
3% |
1% |
*% |
Please note that statistically significant differences should be interpreted with caution where they are relatively small, particularly for behavioural comparisons that use frequency or other scale measures. The statistical tests have not been adjusted for multiple comparisons.
Further work will be undertaken by the FSA to explore differences in behaviours between domestic IID and comparison samples across the six waves. Some of the behaviours captured are also likely to be correlated, such as leaving the home and using public transport.
Percentages that are greater than 0 but under 0.5% are indicated using * throughout. Please note that answers may not sum to totals because of weighting and computer rounding, because multiple responses were possible to some questions or survey participants preferred not to answer or in the case of gender identified in another way. In instances where the bases are small, unweighted figures are shown in the tables, where this is the case figures do not show a %. Numbers either weighted or unweighted are indicated using ‘n’ throughout. Please note that any numbers reported in tables without a % show unweighted survey responses – see example below.
Estimates of the prevalence of IID
This chapter describes the self-reported prevalence of IID symptoms among representative samples of adults and children in the UK. It estimates the prevalence of vomiting and diarrhoea (vomiting and/or diarrhoea) based on all those who passed the relevant survey screening questions about IID symptoms. Further refinements were made to estimate the prevalence of domestic IID, based on responses to other questions in the survey. These are described in more detail below.
Adjustments to IID estimates
The vomiting and diarrhoea estimates were refined by excluding some self-reported causes (on the basis that these were not directly related to IID), as well as removing those who had COVID-19 at the time of their symptoms (as COVID-19 can also cause diarrhoea), or who had travelled outside the UK recently. These exclusions allowed for an estimate of the prevalence of domestic IID.
Those who attributed their most recent bout of vomiting and/or diarrhoea to any of the following were excluded from the estimates for domestic IID:
In Waves 1 and 2 food hypersensitivity was included in ‘pre-existing illness’ or coded by the research team to ‘other non-IID’ if participants reported food hypersensitivity as the cause of their symptoms in an additional response. In Waves 3 to 6, additional questions were added to capture this specific exclusion criteria. These results suggest that approximately 10% of domestic IID in this report may be linked to food hypersensitivity (figures are similar for both adults and parents of children with domestic IID – see Annex B). This has not been corrected so that a consistent comparison can be made between all six waves. Datasets from all waves have been published allowing analysis to be conducted independently with the exclusion in place for Waves 3 to 6.
In addition to selecting pre-coded options in the survey, participants were also able to provide their own description of the self-reported cause as an additional response (although only a minority did so). This data was reviewed by the research team (at Ipsos UK and the FSA) and ‘other’ responses were either re-coded to options in the survey question or were allocated a new code: ‘other IID’ or ‘other non-IID’. Data for these self-reported causes are included in Annex B.
In addition to exclusions based on these self-reported causes, the following were also removed from estimates of the prevalence of domestic IID:
-
Those who had a positive COVID-19 test during their most recent IID symptoms, as COVID-19 may have been the causal illness. This was because diarrhoea, feeling sick or being sick were also symptoms of COVID-19
-
Those who had travelled outside the UK in the two weeks before their symptoms to generate estimates for the prevalence of domestic IID, as those who have recently travelled are likely to have caught the illness outside the UK

Figure 4.Flow chart showing exclusion criteria applied
Positive COVID-19 tests
Figure 5 shows the proportions of adults and children with vomiting and diarrhoea symptoms that tested positive for COVID-19 during most recent bout of IID symptoms (after exclusions for other non IID causes of vomiting and diarrhoea, but not including travel outside the UK exclusions).
Figure 5.Tested positive for COVID-19 during most recent bout of IID symptoms by adults and children (after exclusions for other non IID causes of vomiting and diarrhoea, but not including travel outside the UK exclusions)
Tested positive for COVID-19 during most recent bout of IID symptoms
(children and adults) |
Wave 1
27 Aug-17 Sep 2020
(A) |
Wave 2
2-18 Dec
2020
(B) |
Wave 3
15 Feb-3 Mar 2021
(C) |
Wave 4
26 Aug-20 Sep 2021
(D) |
Wave 5
9 Dec 2021-
5 Jan 2022
(E) |
Wave 6
15 Feb-
10 Mar 2022
(F) |
| Adults: Base sizes (n) |
517 |
570 |
523 |
730 |
687 |
N/A |
| Tested positive for COVID-19 |
1% |
2% |
4%
(A) |
5%
(AB) |
6%
(ABC) |
N/A |
| Children: Base sizes (n) |
153 |
210 |
251 |
234 |
N/A |
396 |
| Tested positive for COVID-19 |
5% |
2% |
5% |
7%
(B) |
N/A |
8%
(B) |
Source: Online survey of adults aged 16-75/parents of children aged 0-15 all with IID symptoms:
Wave 1: Adults (517)/Children (153), 27 Aug-17 Sep 2020; Wave 2: Adults (570)/Children (210), 2-18 Dec 2020; Wave 3: Adults (523)/Children (251), 15 Feb-3 Mar 2021; Wave 4: Adults (730)/Children (234), 26 Aug-20 Sep 2021; Wave 5: Adults only in Wave 5 (687), 9 Dec 2021-5 Jan 2022; Wave 6: Children only in Wave 6 (396), 15 Feb-10 Mar 2022
The proportion of adults and children that reported testing positive for COVID-19 during their recent bout of illness reflects the rates of infection in the population at the time. More analysis is needed to understand the role of COVID in IID symptoms.
Adults
The proportion of adults with symptoms suggestive of IID, that reported testing positive increased steadily each wave. Wave 3 (4%) was significantly higher compared with Wave 1 (1%), and Wave 4 (5%) was higher Wave 1 (1%) and Wave 2 (2%). Wave 5 (6%) was also higher than Waves 1 to 3.
Children
The proportion of children with symptoms suggestive of IID, testing positive for COVID-19 was significantly lower in Wave 2 (both 2%) compared with Wave 4 (7%) and Wave 6 (8%).
Travel outside the UK
Figure 6 shows the proportions of adults and children with IID that had travelled outside the UK two weeks before their IID symptoms started. This is based on the survey participants with IID group of participants (see Figure 4).
Adults
There were no statistically significant differences across the survey waves in the proportion of adults with IID that had travelled outside the UK.
Children
Among parents of children with IID the proportion that had travelled outside the UK was higher in Wave 4 (18%) compared with Wave 2 (9%)
Figure 6.Travel outside the UK in the two weeks before IID symptoms started by adults and children
| Travel outside the UK in the two weeks before IID symptoms started (children and adults) |
Wave 1
27 Aug-17 Sep 2020
(A) |
Wave 2
2-18 Dec
2020
(B) |
Wave 3
15 Feb-3 Mar 2021
(C) |
Wave 4
26 Aug-20 Sep 2021
(D) |
Wave 5
9 Dec 2021-
5 Jan 2022
(E) |
Wave 6
15 Feb-10 Mar 2022
(F) |
| Adults: Base sizes (n) |
512 |
560 |
505 |
746 |
616 |
N/A |
| Travelled outside the UK |
8% |
10% |
8% |
10% |
10% |
N/A |
| Children: Base sizes (n) |
145 |
199 |
215 |
199 |
N/A |
349 |
| Travelled outside the UK |
12% |
9% |
10% |
18%
(B) |
N/A |
12% |
Final exclusions
It is worth clarifying that survey participants with vomiting and diarrhoea symptoms, who met any of the exclusion criteria were removed, with some meeting more than one exclusion criteria.
The following participants were excluded on the basis of one or more of the exclusion criteria:
-
Wave 1: adults 503, children 101
-
Wave 2: adults 560, children 90
-
Wave 3: adults 474, children 118
-
Wave 4: adults 673, children 160
-
Wave 5: adults 611
-
Wave 6: children 237
This gave a final domestic IID sample, allowing for estimates of domestic IID rates and further analysis.
Results
This chapter describes the self-reported rates of IID symptoms in the previous 28 days, among representative samples of adults and children in the UK. An estimate for domestic IID rates in the UK was calculated after excluding some self-reported causes (on the basis that these were not directly related to IID) and removing those who had COVID-19 at the time of their symptoms or had outside the UK recently. Please note that these incidence figures are based on weighted data.
Estimates of domestic IID rates in adults in the UK
Among adults living in the UK that reported experiencing IID symptoms in the previous 28 days, the overall estimate for domestic IID was significantly higher in Wave 4 (7.8%), followed by Wave 5 (6.5%) compared with the previous three waves (W1 5.6% and W2 5.7%, W3 5.2%). Due to the likely seasonality of IID, differences between waves conducted at similar times of year are particularly noteworthy e.g. Waves 1 and 4, and Waves 2 and 5.
Figure 7.Estimates of the prevalence of domestic IID among adults in the UK
| Estimates of prevalence of domestic IID among adults in the UK |
Wave 1
27 Aug-17 Sep 2020
(A) |
Wave 2
2-18 Dec
2020
(B) |
Wave 3
15 Feb-3 Mar 2021
(C) |
Wave 4
26 Aug-20 Sep 2021
(D) |
Wave 5
9 Dec 2021-5 Jan 2022
(E) |
| Adults: Base sizes (n) |
8545 |
8993 |
8916 |
9000 |
8933 |
| UK: domestic IID prevalence |
5.6% |
5.7% |
5.2% |
7.8%
(ABCE) |
6.5%
(ABC) |
| Indicative Confidence Intervals |
+/-0.5 ppts |
+/-0.5 ppts |
+/-0.5 ppts |
+/-0.5 ppts |
+/-0.5 ppts |
Source: Online survey of adults aged 16-75:
Wave 1: Adults (8545), 27 Aug-17 Sep 2020; Wave 2: Adults (8993), 2-18 Dec 2020; Wave 3: Adults (8916), 15 Feb-3 Mar 2021; Wave 4: Adults (9000), 26 Aug-20 Sep 2021; Wave 5: Adults only in Wave 5 (8933), 9 Dec 2021-5 Jan 2022
Estimates of domestic IID rates in children in the UK
Among parents of children living in the UK that reported their child had experienced IID symptoms in the previous 28 days, the overall estimate for domestic IID was significantly higher in Wave 6 (12.7%) when most restrictions had been lifted, compared to the previous four waves (W1 6.4%, W2 8.1%, W3 7.8%, W4 7.2%). The prevalence of IID in Wave 2 and Wave 3, when restrictions were tightened, were both higher than Wave 1. Due to the likely seasonality of IID the difference between Wave 3 and Wave 6 is particularly noteworthy as both waves were conducted at similar times of the year.
Estimates of domestic IID rates among adults in the four nations
The overall estimate for the prevalence of domestic IID for adults living in England was significantly higher in Wave 4 (7.6%), followed by Wave 5 (6.4%) compared with the previous three waves (W1 5.6% and W2 5.4%, W3 5.0%).
Estimates for the prevalence of domestic IID for adults living in Scotland were only significantly higher in Wave 4 (9.3%) and Wave 5 (8.4%) compared with Wave 1 (5.1%).
The prevalence of domestic IID among adults in Northern Ireland in Wave 2 (10.3%) was significantly higher compared to Wave 5 (4.5%).
Among adults living in Wales there were no statistically significant differences between waves for the overall estimates for domestic IID.
Sample sizes for parents of children with domestic IID were too small to allow for estimates of prevalence to be calculated in each of the four nations.
Figure 8.Estimates of the prevalence of domestic IID among children in the UK
| Estimates of the prevalence of domestic IID among children in the UK |
Wave 1
27 Aug-17 Sep 2020
(A) |
Wave 2
2-18 Dec
2020
(B) |
Wave 3
15 Feb-3 Mar 2021
(C) |
Wave 4
26 Aug-20 Sep 2021
(D) |
Wave 6
15 Feb-10 Mar 2022
(E) |
| Children: Base sizes (n) |
1988 |
2297 |
2445 |
2363 |
2459 |
| UK: domestic IID prevalence |
6.4% |
8.1%
(A) |
7.8%
(A) |
7.2% |
12.7%
(ABCD) |
| Indicative Confidence Intervals |
+/-1.0ppts |
+/-1.1ppts |
+/-1.1ppts |
+/-1.0ppts |
+/-1.3ppts |
Source: Online survey of parents of children aged 0-15 living in the UK, all with domestic IID: Wave 1: (1988), 27 Aug-17 Sep 2020; Wave 2: (2297), 2-18 Dec 2020; Wave 3: (2445), 15 Feb-3 Mar 2021; Wave 4: (2363), 26 Aug-20 Sep 2021;
Wave 6: Children only in Wave 6 (2459), 15 Feb-10 Mar 2022
Figure 9.Estimates of the prevalence of domestic IID among adults in the four nations
| Estimates of domestic IID prevalence |
Wave 1
27 Aug-17 Sep 2020
(A) |
Wave 2
2-18 Dec
2020
(B) |
Wave 3
15 Feb-3 Mar 2021
(C) |
Wave 4
26 Aug-20 Sep 2021
(D) |
Wave 5
9 Dec 2021-5 Jan 2022
(E) |
| England: Base sizes (n) |
7187 |
7588 |
7522 |
7564 |
7676 |
| England: domestic IID prevalence |
5.6% |
5.4% |
5.0% |
7.6%
(ABCE) |
6.4%
(ABC) |
| Indicative Confidence Intervals |
+/-0.5ppts |
+/-0.5ppts |
+/-0.5ppts |
+/-0.6ppts |
+/-0.5ppts |
| Wales: Base sizes (n) |
432 |
426 |
456 |
469 |
397 |
| Wales: domestic IID prevalence |
4.4% |
6.4% |
5.1% |
7.3% |
6.3% |
| Indicative Confidence Intervals |
+/-1.9ppts |
+/-2.3ppts |
+/-2.0ppts |
+/-2.4ppts |
+/-2.4ppts |
| Scotland: Base sizes (n) |
736 |
784 |
736 |
798 |
718 |
| Scotland: domestic IID prevalence |
5.1% |
6.8% |
6.7% |
9.3%
(A) |
8.4%
(A) |
| Indicative Confidence Intervals |
+/-1.6ppts |
+/-1.7ppts |
+/-1.8ppts |
+/-2.0ppts |
+/-2.0ppts |
| Northern Ireland: Base sizes (n) |
190 |
195 |
202 |
169 |
142 |
| Northern Ireland: domestic IID prevalence |
8.9% |
10.3%
(E) |
7.2% |
9.6% |
4.5% |
| Indicative Confidence Intervals |
+/-4.0ppts |
+/-4.3ppts |
+/-3.6ppts |
+/-4.4ppts |
+/-3.4ppts |
Source: Online survey of adults aged 16-75:
Wave 1: Adults (England 7187, Wales 432, Scotland 736, Northern Ireland 190), 27 Aug-17 Sep 2020; Wave 2: Adults (England 7588, Wales 426, Scotland 784, Northern Ireland 195), 2-18 Dec 2020; Wave 3: Adults (England 7522, Wales 456, Scotland 736, Northern Ireland 202), 15 Feb-3 Mar 2021; Wave 4: Adults (England 7564, Wales 469, Scotland 798, Northern Ireland 169), 26 Aug-20 Sep 2021; Wave 5: Adults (England 7676, Wales 397, Scotland 718, Northern Ireland 142), 9 Dec-5 Jan 2022.
Estimates of domestic IID by age (adults)
Among adults aged 16-24 the rates of domestic IID were higher in Wave 4 (10%) compared with Wave 1 (6%) and Wave 5 (7%) and Wave 2 (8%) was higher than Wave 3 (5%).
The rates of domestic IID among adults aged 25-34 was higher in Wave 1 (9%), Wave 4 (10%) and Wave 5 (11%) compared with Wave 3 (7%), and Wave 5 (11%) was significantly higher than Wave 2 (8%).
Rates were significantly higher in Wave 4 for adults aged 35-44 (9%) and 65+ (5%) compared with Waves 1 (7% and 3%), Wave 2 (6% and 3%) and Wave 3 (7% and 2%).
Among those aged 45-54 with domestic IID, Wave 4 (7%) was higher than Wave 1, Wave 2 and Wave 5 (5%).
Among those aged 55-64 rates in Wave 4 (8%) were higher in comparison to Wave 1 (4%), Wave 2 (6%), Wave 3 (5%) and Wave 5 (4%) and Wave 2 was higher than Wave 1 and Wave 5.
Among those aged 65+ rates in Wave 4 (5%) were higher in comparison to Wave 1 and Wave 2 (both 3%) and Wave 3 (2%) and rates in Wave 5 (4%) were significantly higher compared with Wave 3 (2%).
Figure 10.Estimates of the prevalence of domestic IID by age (adults aged 16 – 65+)
| Estimates of the prevalence of domestic IID by age (adults) |
Wave 1
27 Aug-17 Sep 2020
(A) |
Wave 2
2-18 Dec
2020
(B) |
Wave 3
15 Feb-3 Mar 2021
(C) |
Wave 4
26 Aug-20 Sep 2021
(D) |
Wave 5
9 Dec 2021-
5 Jan 2022
(E) |
| Adult: Base sizes (n) |
8545 |
8993 |
8916 |
9000 |
8933 |
| Age band 16-24: Base sizes (n) |
848 |
1164 |
1007 |
821 |
1132 |
| 16-24: domestic IID prevalence |
6% |
8%
(C) |
5% |
10%
(AE) |
7% |
| Age band 25-34: Base sizes (n) |
1388 |
1530 |
1503 |
1420 |
1259 |
| 25-34: domestic IID prevalence |
9%
(C) |
8% |
7% |
10%
(C) |
11%
(BC) |
| Age band 35-44: Base sizes (n) |
1370 |
1440 |
1483 |
1575 |
1458 |
| 35-44: domestic IID prevalence |
7% |
6% |
7% |
9%
(ABC) |
8% |
| Age band 45-55: Base sizes (n) |
1516 |
1530 |
1574 |
1672 |
1601 |
| 45-54: domestic IID prevalence |
5% |
5% |
6% |
7%
(ABE) |
5% |
| Age band 55-64: Base sizes (n) |
1677 |
1350 |
1383 |
1479 |
1412 |
| 55-64: domestic IID prevalence |
4% |
6%
(AE) |
5% |
8%
(ABCE) |
4% |
| Age band 65+: Base sizes (n) |
1746 |
1979 |
1966 |
2033 |
2071 |
| 65+: domestic IID prevalence |
3% |
3% |
2% |
5%
(ABC) |
4%
(C) |
Source: Online survey of adults, all with domestic IID:
Wave 1: (8545), 27 Aug-17 Sep 2020; Wave 2: (8993), 2-18 Dec 2020; Wave 3: (8916), 15 Feb-3 Mar 2021; Wave 4: (9000), 26 Aug-20 Sep 2021; Wave 5: Adults only in Wave 5 (8933), 9 Dec 2021-5 Jan 2022
Estimates of domestic IID by age (children aged 0-15)
Rates among children aged 0-4 were highest in Wave 6 (17%), when most restrictions were lifted, compared with previous waves (W1 6%, W2 10%, W3 9%, W4 12%) and lowest in Wave 1 (6%).
Among children aged 5-9 the estimated incidence rates of domestic IID were highest in Wave 6 (15%), when most restrictions were lifted, compared to the previous fieldwork periods (W1 7%, W2 8%, W3 7%, W4 5%). Rates in Wave 2 (8%) were higher compared with Wave 4 (5%).
There were no statistically significant differences in the incidence rates among children aged 10-15 across all five waves.
Figure 11.Estimates of incidence rates of domestic IID by age (children aged 0 – 15)
| Estimates of domestic IID incidence rates by age (0-15) |
Wave 1
27 Aug-17 Sep 2020
(A) |
Wave 2
2-18 Dec
2020
(B) |
Wave 3
15 Feb-3 Mar 2021
(C) |
Wave 4
26 Aug-20 Sep 2021
(D) |
Wave 6
15 Feb-10 Mar 2022
(E) |
| Children: Base sizes (n) |
1988 |
2297 |
2445 |
2363 |
2459 |
| Age band 0-4: Base sizes (n) |
593 |
705 |
761 |
688 |
728 |
| Age 0-4: domestic IID prevalence |
6% |
10%
(A) |
9%
(A) |
12%
(A) |
17%
(ABCD) |
| Age band 5-9: Base sizes (n) |
610 |
713 |
761 |
751 |
789 |
| Age 5-9: domestic IID prevalence |
7% |
8%
(D) |
7% |
5% |
15%
(ABCD) |
| Age band 10-15: Base sizes (n) |
785 |
879 |
923 |
924 |
942 |
| Age 10-15: domestic IID prevalence |
6% |
6% |
7% |
5% |
7% |
Source: Online survey of parents of children aged 0-15 living in the UK: Wave 1: (1988), 27 Aug-17 Sep 2020; Wave 2: (2297), 2-18 Dec 2020; Wave 3: (2445), 15 Feb-3 Mar 2021; Wave 4: (2363), 26 Aug-20 Sep 2021;
Wave 6: Children only in Wave 6 (2459), 15 Feb-10 Mar 2022
Estimates of domestic IID by gender
Figure 12 shows the prevalence of domestic IID in the past 28 days by the gender of adults and children.
Adults
The prevalence of domestic IID for adult men was higher in Wave 4 (8%) compared with the previous three waves (W1 and W2 6%, W3 5%). Among women the rates were lowest in Wave 2 and Wave 3 (both 5%), both lower than Wave 1 and Wave 5 (6%) and highest in Wave 4 (7%).
Children
For both boys and girls, the prevalence of domestic IID was highest in Wave 6 compared to the previous waves, for boys the prevalence in Wave 6 was 14%, higher than Wave 1 (6%), Wave 2 (9%) and Waves 3 and 4 (8%). Among boys, Wave 2 (9%) was also higher than Wave 1 (6%). Among girls the prevalence of domestic IID was highest in Wave 6 (12%) compared to Waves 1-4 (W1 and W2 7%, W3 8%, and W4 7%).
Figure 12.Estimates of the prevalence of domestic IID by gender by adults and children
| Estimates of domestic IID prevalence by gender (adults and children) |
Wave 1
27 Aug-17 Sep 2020
(A) |
Wave 2
2-18 Dec
2020
(B) |
Wave 3
15 Feb-3 Mar 2021
(C) |
Wave 4
26 Aug-20 Sep 2021
(D) |
Wave 5
9 Dec 2021-
5 Jan 2022
(E) |
Wave 6
15 Feb-10 Mar 2022
(F) |
| Adult: Base sizes (n) |
8545 |
8993 |
8916 |
9000 |
8933 |
N/A |
| Adult male: Base sizes (n) |
3830 |
4166 |
4065 |
3919 |
4343 |
|
| Adult male: domestic IID prevalence |
6% |
6% |
5% |
8%
(ABC) |
7% |
N/A |
| Adult female: Base sizes (n) |
4684 |
4790 |
4762 |
4999 |
4590 |
|
| Adult female: domestic IID prevalence |
6%
(BC) |
5% |
5% |
7%
(ABCE) |
6%
(BC) |
N/A |
| Child gender: Base sizes (n) |
1988 |
2297 |
2445 |
2363 |
N/A |
2459 |
| Child male: Base sizes (n) |
1024 |
1178 |
1240 |
1228 |
|
1251 |
| Child male: domestic IID prevalence |
6% |
9%
(A) |
8% |
8% |
N/A |
14%
(ABCD) |
| Child female: Base sizes (n) |
964 |
1119 |
1205 |
1135 |
|
1208 |
| Child female: domestic IID prevalence |
7% |
7% |
8% |
7% |
N/A |
12%
(ABCD) |
Source: Online survey of adults aged 16-75/parents of children aged 0-15 all with domestic IID:
Wave 1: Adults (8545)/Children (1988), 27 Aug-17 Sep 2020; Wave 2: Adults (8993)/Children (2297), 2-18 Dec 2020; Wave 3: Adults (8916)/Children (2445), 15 Feb-3 Mar 2021; Wave 4: Adults (9000)/Children (2363), 26 Aug-20 Sep 2021; Wave 5: Adults only in Wave 5 (8933), 9 Dec 2021-5 Jan 2022; Wave 6: Children only in Wave 6 (2459), 15 Feb-10 Mar 2022
Medical assistance and medication
This section outlines the medical help sought by those with domestic IID, including hospital admissions. It also describes any medication taken by those with domestic IID. See Annex C for detailed summary of the types of symptoms experienced by adults and children during their most recent bout of illness.
Type of medical assistance sought
Adults
Overall, there was a significant increase from Wave 1 in the proportion of adults with domestic IID seeking at least one of type of medical help for their illness, from 22% in Wave 1 to 34% in Wave 5. The proportion of adults with domestic IID that sought any medical help during their recent bout of illness was significantly higher in Wave 5 (34%) compared to the previous waves and Wave 4 (31%) and Wave 3 (28%) were significantly higher than Wave 1 (22%).
Adults with domestic IID were more likely to attend their usual GP practice in person, compared with Wave 3 (2%) this figure was higher in Wave 4 (5%) and Wave 5 (6%). Similarly, adults were more likely to consult with their GP on the phone or online in Wave 4 (10%) and Wave 5 (13%) compared with Wave 1 (7%).
Adults with domestic IID were less likely to consult with a pharmacist in Wave 1 (5%), compared with Wave 2, Wave 3 and Wave 5 (all 8%).
Visits to A&E were significantly higher in Wave 1, Wave 3 and Wave 5 (all 3%), compared with Wave 4 (1%).

Figure 13.Type of medical help sought for recent bout of illness by adults
Source: Online survey of UK adults all with domestic IID:
Wave 1: (476), 27 Aug-17 Sep 2020: Wave 2: (508), 2 Dec-18 Dec 2020: Wave 3: (465), 15 Feb-3 Mar 2021:
Wave 4: (681), 26 Aug -20 Sep 2021: Wave 5: Adults only in Wave 5 (556), 9 Dec 2021-5 Jan 2022
Figure 13.Type of medical help sought for recent bout of illness by adults
| Medical help sought for recent bout of illness among adults |
Wave 1
27 Aug-17 Sep 2020
(A) |
Wave 2
2-18 Dec
2020
(B) |
Wave 3
15 Feb-3 Mar 2021
(C) |
Wave 4
26 Aug-20 Sep 2021
(D) |
Wave 5
9 Dec 2021-
5 Jan 2022
(E) |
| Adults: Base sizes (n) |
476 |
508 |
465 |
681 |
556 |
| Attended usual GP practice in person |
4% |
3% |
2% |
5%
(C) |
6%
(C) |
| Consulted with usual GP practice on phone/online |
7% |
10% |
10% |
10%
(A) |
13%
(A) |
| Consulted with a pharmacist (in person, phone, online) |
5% |
8%
(A) |
8%
(A) |
7% |
8%
(A) |
| Visited A&E |
3%
(D) |
2% |
3%
(D) |
1% |
3%
(D) |
| Spoke to someone after dialling 111 |
4% |
5% |
5% |
5% |
4% |
| Visited NHS/other health related websites |
7% |
8% |
5% |
7% |
7% |
| Sought another kind of medical help |
2% |
2% |
3%
(D) |
1% |
2% |
| Any of these listed |
22% |
27% |
28%
(A) |
31%
(A) |
34%
(ABCD) |
| None of these |
77%
(DE) |
72%
(E) |
72%
(E) |
69% |
65% |
Source: Online survey of UK adults all with domestic IID:
Wave 1: (476), 27 Aug-17 Sep 2020: Wave 2: (508), 2 Dec-18 Dec 2020: Wave 3: (465), 15 Feb-3 Mar 2021:
Wave 4: (681), 26 Aug -20 Sep 2021: Wave 5: Adults only in Wave 5 (556), 9 Dec 2021-5 Jan 2022
Children
Significantly more parents of children with domestic IID reported seeking medical help during their child’s most recent bout of illness in Wave 6 (54%), as most restrictions were lifted, compared with Wave 1 (41%) and Wave 2 (44%).
The proportion of children that attended a GP practice during their most recent bout of illness was higher in Wave 6 (14%), as most restrictions lifted, compared with Wave 3 (6%).
Parents were less likely to consult with their GP on the phone or online in Wave 1 (11%) compared with Wave 3 (20%), Wave 4 (22%) and Wave 6 (20%). They were also less likely to consult a pharmacist in Wave 4 (10%) compared with Wave 3 (17%).

Figure 14.Type of medical help sought for recent bout of illness by children
Source: Online survey of parents of children aged 0-15 all with domestic IID:
Wave 1: (128), 27 Aug-17 Sep 2020: Wave 2: (182), 2 Dec-18 Dec 2020: Wave 3: (193), 15 Feb-3 Mar 2021: Wave 4: (165), 26 Aug-20 Sep 2021: Wave 6: Children only in Wave 6 (305), 15 Feb-10 Mar 2022
Figure 14.Type of medical help sought for recent bout of illness by children
| Medical help sought for recent bout of illness among children |
Wave 1
27 Aug-17 Sep 2020
(A) |
Wave 2
2-18 Dec
2020
(B) |
Wave 3
15 Feb-3 Mar 2021
(C) |
Wave 4
26 Aug-20 Sep 2021
(D) |
Wave 6
15 Feb-10 Mar 2022
(E) |
| Children: Base sizes (n) |
128 |
182 |
193 |
165 |
305 |
| Attended usual GP practice in person |
7% |
8% |
6% |
12% |
14%
(C) |
| Consulted with usual GP practice on phone/online |
11% |
16% |
20%
(A) |
22%
(A) |
20%
(A) |
| Consulted with a pharmacist (in person, phone, online) |
11% |
14% |
17%
(D) |
10% |
13% |
| Visited A&E |
3% |
3% |
6% |
5% |
3% |
| Spoke to someone after dialling 111 |
10% |
7% |
9% |
9% |
10% |
| Visited NHS/other health related websites |
11% |
10% |
8% |
7% |
10% |
| Sought another kind of medical help |
2% |
3% |
1% |
1% |
1% |
| Any of these listed |
41% |
44% |
52% |
49% |
54%
(AB) |
| None of these |
59%
(CE) |
56%
(E) |
48% |
50% |
46% |
Source: Online survey of parents of children aged 0-15 all with domestic IID:
Wave 1: (128), 27 Aug-17 Sep 2020: Wave 2: (182), 2 Dec-18 Dec 2020: Wave 3: (193), 15 Feb-3 Mar 2021: Wave 4: (165), 26 Aug-20 Sep 2021: Wave 6: Children only in Wave 6 (305), 15 Feb-10 Mar 2022
Hospital attendance for domestic IID
Adults
The proportion of adults with domestic IID that reported that they attended hospital because of their illness was similar across all five waves (W1 to W3 4%, W4 5% and W5 6%).

Figure 15.Attended hospital due to recent bout of illness by adults
Source: Online survey of UK adults all with domestic IID:
Wave 1: (476), 27 Aug-17 Sep 2020: Wave 2: (508), 2 Dec-18 Dec 2020: Wave 3: (465), 15 Feb-3 Mar 2021: Wave 4: (681), 26 Aug-20 Sep 2021: Wave 5: Adults only in Wave 5 (556), 9 Dec - 5 Jan 2022
Figure 15.Attended hospital due to recent bout of illness by adults
| Attended hospital due to recent bout of illness among adults |
Wave 1
27 Aug-17 Sep 2020
(A) |
Wave 2
2-18 Dec
2020
(B) |
Wave 3
15 Feb-3 Mar 2021
(C) |
Wave 4
26 Aug-20 Sep 2021
(D) |
Wave 5
9 Dec 2021-
5 Jan 2022
(E) |
| Adult: Base sizes (n) |
476 |
508 |
465 |
681 |
556 |
| Yes |
4% |
4% |
4% |
5% |
6% |
| No |
95%
(E) |
94% |
92% |
93% |
91% |
| Don’t know |
2% |
1% |
3% |
2% |
1% |
| Prefer not to say |
0% |
1% |
1% |
1% |
1% |
Source: Online survey of UK adults all with domestic IID:
Wave 1: (476), 27 Aug-17 Sep 2020: Wave 2: (508), 2 Dec-18 Dec 2020: Wave 3: (465), 15 Feb-3 Mar 2021: Wave 4: (681), 26 Aug-20 Sep 2021: Wave 5: Adults only in Wave 5 (556), 9 Dec - 5 Jan 2022
Children
There were no statistically significant differences between the five survey waves in the proportion of parents reporting that their child attended hospital because of their illness (W1 4% and W2 7%, W3 8%, W4 and W6 both 7%).

Figure 16.Attended hospital due to recent bout of illness by children
Source: Online survey of parents of children aged 0-15, all with domestic IID:
Wave 1: (128), 27 Aug-17 Sep 2020: Wave 2: (182), 2 Dec18 Dec 2020: Wave 3: (193), 15 Feb-3 Mar 2021: Wave 4: (165), 26 Aug-20 Sep 2021: Wave 6: Children only in Wave 6 (305), 15 Feb-10 Mar 2022
Figure 16.Attended hospital due to recent bout of illness by children
| Attended hospital due to recent bout of illness among children |
Wave 1
27 Aug-17 Sep 2020
(A) |
Wave 2
2-18 Dec
2020
(B) |
Wave 3
15 Feb-3 Mar 2021
(C) |
Wave 4
26 Aug-20 Sep 2021
(D) |
Wave 6
15 Feb-10 Mar 2022
(E) |
| Children: Base sizes (n) |
128 |
182 |
193 |
165 |
305 |
| Yes |
4% |
7% |
8% |
7% |
7% |
| No |
94% |
93% |
91% |
92% |
91% |
| Don’t know |
2% |
0% |
2% |
0% |
2% |
| Prefer not to say |
0% |
0% |
0% |
1% |
*% |
Source: Online survey of parents of children aged 0-15, all with domestic IID:
Wave 1: (128), 27 Aug-17 Sep 2020: Wave 2: (182), 2 Dec-18 Dec 2020: Wave 3: (193), 15 Feb-3 Mar 2021: Wave 4: (165), 26 Aug-20 Sep 2021: Wave 6: Children only in Wave 6 (305), 15 Feb-10 Mar 2022
Hospital admissions for domestic IID
Adults
Figure 17 summarises the number of adults (unweighted data) in each survey wave reporting that they were admitted to hospital due to their recent bout of illness.
Figure 17.Admitted to hospital due to recent bout of illness by adults
| Admitted to hospital due to recent bout of illness among adults (unweighted numbers are shown in this table) |
Wave 1
27 Aug-17 Sep 2020
(A) |
Wave 2
2-18 Dec
2020
(B) |
Wave 3
15 Feb-3 Mar 2021
(C) |
Wave 4
26 Aug-20 Sep 2021
(D) |
Wave 5
9 Dec 2021-5 Jan 2022
(E) |
| Adult: Base sizes (n) |
15 |
19 |
19 |
26 |
33 |
| Did not stay overnight |
4 |
4 |
4 |
14 |
7 |
| Stayed overnight |
6 |
7 |
6 |
4 |
18 |
| Seen/treated as outpatient |
3 |
7 |
8 |
7 |
7 |
| Don’t know |
2 |
0 |
1 |
0 |
1 |
| Prefer not to say |
0 |
1 |
0 |
1 |
0 |
Source: Online survey of UK adults all with domestic IID:
Wave 1: (15), 27 Aug-17 Sep 2020: Wave 2: (19), 2 Dec-18 Dec 2020: Wave 3: (19), 15 Feb-3 Mar 2021: Wave 4: (26), 26 Aug-20 Sep 2021: Wave 5: Adults only in Wave 5 (33), 9 Dec-5 Jan 2022
Children
Figure 18 summarises the number of parents of children with domestic IID (unweighted data) in each survey wave reporting that their child was admitted to hospital due to their recent bout of illness.
Figure 18.Admitted to hospital due to recent bout of illness by children
| Admitted to hospital due to recent bout of illness among children (unweighted numbers are shown in this table) |
Wave 1
27 Aug-17 Sep 2020
(A) |
Wave 2
2-18 Dec
2020
(B) |
Wave 3
15 Feb-3 Mar 2021
(C) |
Wave 4
26 Aug-20 Sep 2021
(D) |
Wave 6
15 Feb-10 Mar 2022
(E) |
| Children: Base sizes (n) |
4 |
13 |
15 |
12 |
24 |
| Did not stay overnight |
1 |
3 |
6 |
2 |
8 |
| Stayed overnight |
2 |
7 |
4 |
6 |
8 |
| Seen/treated as outpatient |
1 |
3 |
5 |
4 |
7 |
| Don’t know |
0 |
0 |
0 |
0 |
1 |
Source: Online survey of parents of children aged 0-15, all with domestic IID:
Wave 1: (4), 27 Aug-17 Sep 2020: Wave 2: (13), 2 Dec-18 Dec 2020: Wave 3: (15), 15 Feb-3 Mar 2021: Wave 4: (12), 26 Aug-20 Sep 2021: Wave 6: Children only in Wave 6 (24), 15 Feb-10 Mar 2022
Duration of inpatient admission for domestic IID
Adults
Figure 19 shows the self-reported length of hospital stay for adults with domestic IID that were treated as inpatients.
Figure 19.Duration of hospital stay due to recent bout of illness by adults
| Duration of hospital admission among adults (unweighted numbers are shown in this table) |
Wave 1
27 Aug-17 Sep 2020
(A) |
Wave 2
2-18 Dec
2020
(B) |
Wave 3
15 Feb-3 Mar 2021
(C) |
Wave 4
26 Aug-20 Sep 2021
(D) |
Wave 5
9 Dec 2021-5 Jan 2022
(E) |
| Adult: Base sizes (n) |
10 |
11 |
10 |
18 |
25 |
| Less than 24 hours |
5 |
1 |
4 |
7 |
7 |
| 1 day up to 2 days |
0 |
4 |
2 |
2 |
4 |
| 2 days up to 4 days |
3 |
3 |
3 |
3 |
9 |
| 4 days up to 7 days |
2 |
1 |
0 |
3 |
5 |
| 1 week up to 2 weeks |
0 |
1 |
1 |
2 |
0 |
| 2 weeks or longer |
0 |
1 |
0 |
1 |
0 |
Source: Online surveys of UK adults, with unweighted figures for the number admitted to hospital as inpatients, all with domestic IID
Wave 1: (10), 27 Aug-17 Sep 2020: Wave 2: (11), 2 Dec-18 Dec 2020: Wave 3: (10), 15 Feb-3 Mar 2021: Wave 4: (18), 26 Aug-20 Sep 2021: Wave 5: Adults only in Wave 5 (25), 9 Dec-5 Jan 2022
Children
Figure 20 shows the reported length of hospital stay for the children with domestic IID that were treated as inpatients.
Figure 20.Duration of hospital stay due to recent bout of illness by children
| Duration of hospital admission among children (unweighted numbers are shown in this table) |
Wave 1
27 Aug-17 Sep 2020
(A) |
Wave 2
2-18 Dec
2020
(B) |
Wave 3
15 Feb-3 Mar 2021
(C) |
Wave 4
26 Aug-20 Sep 2021
(D) |
Wave 6
15 Feb-10 Mar 2022
(E) |
| Children: Base sizes (n) |
3 |
10 |
10 |
8 |
16 |
| Less than 24 hours |
0 |
3 |
3 |
1 |
6 |
| 1 day up to 2 days |
1 |
3 |
1 |
2 |
2 |
| 2 days up to 4 days |
0 |
1 |
2 |
2 |
2 |
| 4 days up to 7 days |
2 |
0 |
4 |
2 |
4 |
| 1 week up to 2 weeks |
0 |
2 |
0 |
1 |
2 |
| 2 weeks or longer |
0 |
1 |
0 |
0 |
0 |
Source: Online surveys of parents of children aged 0-15, with unweighted figures for the number admitted to hospital as inpatients, all with domestic IID:
Wave 1: (3), 27 Aug-17 Sep 2020: Wave 2: (10), 2 Dec-18 Dec 2020: Wave 3: (10), 15 Feb-3 Mar 2021: Wave 4: (8), 26 Aug-20 Sep 2021: Wave 6: Children only in Wave 6 (16), 15 Feb-10 Mar 2022
Admissions to critical care for domestic IID
Figures 21 and 22 shows the proportion of adults and children that were admitted to Intensive Care or a High Dependency Unit because of their domestic IID symptoms.
Adults
Figure 21.Admissions to critical care due to recent bout of illness by adults
| Admissions to critical care among adults (unweighted numbers are shown in this table) |
Wave 1
27 Aug-17 Sep 2020
(A) |
Wave 2
2-18 Dec
2020
(B) |
Wave 3
15 Feb-3 Mar 2021
(C) |
Wave 4
26 Aug-20 Sep 2021
(D) |
Wave 5
9 Dec 2021-
5 Jan 2022
(E) |
| Adults: Base sizes (n) |
10 |
11 |
10 |
18 |
25 |
| Yes |
1 |
2 |
3 |
7 |
14 |
| No |
9 |
8 |
6 |
8 |
10 |
| Don’t know |
0 |
1 |
1 |
3 |
0 |
| Prefer not to say |
0 |
0 |
0 |
0 |
1 |
Source: Online surveys of UK adults with unweighted figures for the number of adults admitted to hospital, all with domestic IID:
Wave 1: (10), 27 Aug-17 Sep 2020: Wave 2: (11), 2 Dec-18 Dec 2020: Wave 3: (10), 15 Feb-3 Mar 2021: Wave 4: (18), 26 Aug-20 Sep 2021: Wave 5: Adults only in Wave 5 (25), 9 Dec-5 Jan 2022
Children
Figure 22.Admissions to critical care due to recent bout of illness by children
| Admissions to critical care among children (unweighted numbers are shown in this table) |
Wave 1
27 Aug-17 Sep 2020
(A) |
Wave 2
2-18 Dec
2020
(B) |
Wave 3
15 Feb-3 Mar 2021
(C) |
Wave 4
26 Aug-20 Sep 2021
(D) |
Wave 6
15 Feb-10 Mar 2022
(E) |
| Children: Base sizes (n) |
3 |
10 |
10 |
8 |
16 |
| Yes |
1 |
3 |
2 |
3 |
4 |
| No |
1 |
7 |
7 |
5 |
11 |
| Don’t know |
1 |
0 |
1 |
0 |
1 |
Source: Online surveys of parents of children aged 0-15, with unweighted figures for the number of children admitted to hospital, all with domestic IID:
Wave 1: (3), 27 Aug-17 Sep 2020: Wave 2: (0), 2 Dec-18 Dec 2020: Wave 3: (10), 15 Feb-3 Mar 2021: Wave 4: (8), 26 Aug-20 Sep 2021: Wave 6: Children only in Wave 6 (16), 9 Dec-5 Jan 2022
Testing and test results for domestic IID
This section summarises findings for adults and children with domestic IID that reported taking a test, including the results of the test where these were known.
Tests taken
Figures 23 and 24 shows the proportion of adults and children with domestic IID that provided stool or blood samples during their most recent bout of illness.
Adults
There were no statistically significant differences in the proportion of adults with domestic IID that provided stool or blood samples during their most recent bout of illness across the five waves.
Figure 23.Provided samples for most recent bout of illness by adults
| Provided samples (stool or blood) for most recent bout of illness among adults |
Wave 1
27 Aug-17 Sep 2020
(A) |
Wave 2
2-18 Dec
2020
(B) |
Wave 3
15 Feb-3 Mar 2021
(C) |
Wave 4
26 Aug-20 Sep 2021
(D) |
Wave 5
9 Dec 2021-
5 Jan 2022
(E) |
| Adults: Base sizes (n) |
476 |
508 |
465 |
681 |
556 |
| Yes |
7% |
10% |
9% |
7% |
9% |
| No |
91% |
89% |
87% |
91% |
89% |
| Don’t know |
1% |
1% |
3%
(BE) |
2% |
1% |
| Prefer not to say |
*% |
*% |
*% |
*% |
1%
(B) |
Source: Online surveys of UK adults, all with domestic IID:
Wave 1: (476), 27 Aug-17 Sep 2020: Wave 2: (508), 2 Dec-18 Dec 2020: Wave 3: (465), 15 Feb-3 Mar 2021: Wave 4: (681), 26 Aug-20 Sep 2021: Wave 5: Adults only in Wave 5 (556), 9 Dec-5 Jan 2022
Children
There were no statistically significant differences in the proportion of children with domestic IID that provided stool or blood samples during their most recent bout of illness across the five waves.
Figure 24.Provided samples for most recent bout of illness by children
| Provided samples (stool or blood) for most recent bout of illness among children |
Wave 1
27 Aug-17 Sep 2020
(A) |
Wave 2
2-18 Dec
2020
(B) |
Wave 3
15 Feb-3 Mar 2021
(C) |
Wave 4
26 Aug-20 Sep 2021
(D) |
Wave 6
15 Feb-10 Mar 2022
(E) |
| Children: Base sizes (n) |
128 |
182 |
193 |
165 |
305 |
| Yes |
9% |
7% |
9% |
9% |
10% |
| No |
87% |
93% |
89% |
89% |
89% |
| Don’t know |
3% |
1% |
2% |
2% |
1% |
| Prefer not to say |
1% |
0% |
0% |
1% |
0% |
Source: Online surveys of parents of children aged 0-15, all with domestic IID:
Wave 1: (128), 27 Aug-17 Sep 2020: Wave 2: (182) 2 Dec-18 Dec 2020: Wave 3: (193), 15 Feb-3 Mar 2021: Wave 4: (165), 26 Aug-20 Sep 2021: Wave 6: Children only in Wave 6 (305), 15 Feb-10 Mar 2022
Test results
Figures 25 and 26 show the self-reported test results for adults and children with domestic IID that had provided stool or blood samples during their most recent bout of illness.
Adults
The number of adults in Wave 5 (n=11) that reported they had a virus was higher compared with Wave 3 (n=2) and Wave 4 (n=3). A total of four adults in Wave 1 (4) reported that their test result showed they had a parasite, higher than in Wave 2 (0). In Wave 5, seven adults reported a parasite as the cause of their domestic IID, higher than Wave 2 (0) and Wave 3 (1). Please note that the very small sample sizes means these findings should be seen as indicative only.
Figure 25.Infection caused recent bout of illness by adults
| Type of infection that caused recent bout of illness among adults (unweighted numbers shown in the table) |
Wave 1
27 Aug-17 Sep 2020
(A) |
Wave 2
2-18 Dec
2020
(B) |
Wave 3
15 Feb-3 Mar 2021
(C) |
Wave 4
26 Aug-20 Sep 2021
(D) |
Wave 5
9 Dec 2021-5 Jan 2022
(E) |
| Adults: Base size with an infection (n) |
15 |
25 |
18 |
29 |
33 |
| Virus |
4 |
9 |
2 |
3 |
11
(CD) |
| Bacteria |
4 |
7 |
8 |
13 |
8 |
| Parasite |
4
(B) |
0 |
1 |
2 |
7
(BC) |
| Infection (not sure what kind) |
3 |
9 |
7 |
11 |
7 |
| No infection |
11
(DE) |
10 |
11
(E) |
6 |
5 |
| Still awaiting results of test |
4 |
8 |
7 |
10 |
7 |
| Don’t know |
2 |
3 |
3 |
3 |
0 |
| Prefer not to say |
1 |
0 |
0 |
0 |
0 |
Source: Online surveys of UK adults with unweighted figures for the number that provided a sample, all with domestic IID:
Wave 1: (33), 27 Aug-17 Sep 2020: Wave 2: (46), 2 Dec-18 Dec 2020: Wave 3: (39), 15 Feb-3 Mar 2021: Wave 4: (48), 26 Aug-20 Sep 2021: Wave 5: Adults only in Wave 5 (45), 9 Dec-5 Jan 2022
Children
There were no statistically significant differences between survey waves among children with domestic IID.
Figure 26.Infection caused recent bout of illness by children
| Type of infection that caused recent bout of illness among children (unweighted numbers) |
Wave 1
27 Aug-17 Sep 2020
(A) |
Wave 2
2-18 Dec
2020
(B) |
Wave 3
15 Feb-3 Mar 2021
(C) |
Wave 4
26 Aug-20 Sep 2021
(D) |
Wave 6
15 Feb-10 Mar 2022
(E) |
| Children: Base size - providing a stool/blood sample (n) |
12 |
12 |
18 |
15 |
32 |
| Virus |
2 |
1 |
4 |
3 |
6 |
| Bacteria |
1 |
3 |
6 |
5 |
11 |
| Parasite |
0 |
0 |
1 |
1 |
4 |
| Infection (not sure what kind) |
3 |
3 |
2 |
0 |
3 |
| No infection |
3 |
2 |
3 |
3 |
6 |
| Still awaiting results of test |
3 |
3 |
1 |
2 |
2 |
| Don’t know |
0 |
0 |
1 |
1 |
0 |
Source: Online surveys of parents of children aged 0-15 with unweighted figures for the number that provided a sample, all with domestic IID:
Wave 1: (12), 27 Aug-17 Sep 2020: Wave 2: (12), 2 Dec-18 Dec 2020: Wave 3: (18), 15 Feb-3 Mar 2021: Wave 4: (15), 26 Aug-20 Sep 2021: Wave 6: Children only in Wave 6 (32), 15 Feb-10 Mar 2022
Test results identifying source of infection as cause of domestic IID
Figures 27 and 28 show the self-reported sources of infection among the adults and children that reported that their test results indicated they had an infection. Please note that these are self-reported survey responses and have not been validated.
Adults
Figure 27.Source of infection that caused recent bout of illness by adults
| Self reported source of infection that caused recent bout of illness among adults (unweighted numbers) |
Wave 1
27 Aug-17 Sep 2020
(A) |
Wave 2
2-18 Dec
2020
(B) |
Wave 3
15 Feb-3 Mar 2021
(C) |
Wave 4
26 Aug-20 Sep 2021
(D) |
Wave 5
9 Dec 2021-5 Jan 2022
(E) |
| Adults: Base sizes (n) |
15 |
25 |
18 |
29 |
33 |
| Campylobacter |
1 |
3 |
1 |
3 |
2 |
| E.coli |
2 |
1 |
4 |
1 |
4 |
| Salmonella |
1 |
6 |
4 |
2 |
4 |
| Shigella |
1 |
1 |
1 |
1 |
4 |
| Cryptosporidium |
0 |
1 |
2 |
2 |
1 |
| Giardia |
1 |
1 |
1 |
0 |
2 |
| Norovirus |
1 |
0 |
2 |
5 |
4 |
| Rotavirus |
2 |
1 |
0 |
3 |
1 |
| Other |
3 |
4 |
0 |
2 |
3 |
| Don’t know |
3 |
7 |
2 |
7 |
6 |
| Prefer not to say |
0 |
0 |
1 |
3 |
2 |
Source: Online surveys of UK adults, with unweighted figures for the number with test results showing an infection, all with domestic IID:
Wave 1: (15), 27 Aug-17 Sep 2020: Wave 2: (25), 2 Dec-18 Dec 2020: Wave 3: (18), 15 Feb-3 Mar 2021: Wave 4: (29), 26 Aug-20 Sep 2021: Wave 5: Adults only in Wave 5 (33), 9 Dec-5 Jan 2022
Figure 28.Source of infection that caused recent bout of illness by children
| Self reported source of infection that caused recent bout of illness among children (unweighted numbers) |
Wave 1
27 Aug-17 Sep 2020
(A) |
Wave 2
2-18 Dec
2020
(B) |
Wave 3
15 Feb-3 Mar 2021
(C) |
Wave 4
26 Aug-20 Sep 2021
(D) |
Wave 6
15 Feb-10 Mar 2022
(E) |
| Children: Base sizes (n) |
6 |
7 |
13 |
9 |
24 |
| Campylobacter |
0 |
0 |
0 |
0 |
2 |
| E.coli |
1 |
1 |
0 |
1 |
2 |
| Salmonella |
0 |
1 |
1 |
2 |
4 |
| Shigella |
0 |
1 |
1 |
0 |
1 |
| Cryptosporidium |
0 |
1 |
0 |
0 |
1 |
| Giardia |
0 |
0 |
0 |
1 |
0 |
| Norovirus |
2 |
2 |
3 |
1 |
4 |
| Rotavirus |
1 |
0 |
1 |
0 |
1 |
| Other |
0 |
0 |
0 |
2 |
2 |
| Don’t know |
2 |
1 |
5 |
2 |
6 |
| Prefer not to say |
0 |
0 |
2 |
0 |
1 |
Source: Online surveys of parents of children aged 0-15, with unweighted figures for the number with test results showing an infection, all with domestic IID:
Wave 1: (6), 27 Aug-17 Sep 2020: Wave 2: (7), 2 Dec-18 Dec 2020: Wave 3: (13), 15 Feb-3 Mar 2021: Wave 4: (9), 26 Aug-20 Sep 2021: Wave 6: Children only in Wave 6 (24), 15 Feb-10 Mar 2022
Behaviours
This chapter summarises behavioural and contextual comparisons between adults and children with and without self-reported domestic IID. It includes self-reported behaviour across major IID risk factors such as leaving the home, use of public transport, eating outside the home, and handwashing behaviours.
These findings are included to give an indication of the overall similarities and differences between the two groups across all the survey waves. Further analysis is required to understand the relationship between these behaviours and IID symptoms.
Statistically significant differences between those with domestic IID and those without self-reported domestic IID symptoms (comparison group) have been highlighted in the tables and commented upon in the supporting text. These differences will be investigated further by the FSA, as the relationship between experiencing IID symptoms and specific behaviours captured in the survey are not necessarily causal and may be correlated. For example, some of the differences in behaviour may be linked to the different demographic profile of those who have experienced IID when compared to the population overall (via the comparison group).
Please note that statistically significant differences should be interpreted with caution where they are relatively small, particularly for behavioural comparisons that use frequency or other scale measures. The statistical tests have not been adjusted for multiple comparisons.
Differences between findings for different waves of the survey are not included because the focus of the analysis for these questions was on comparing the domestic IID sample with the comparison sample.
Activities outside the home
This section compares the proportion of adults and children with domestic IID that left the home in each survey wave to the behaviour of adults and children in the comparison group.
Leaving the house for work, education or childcare
Adults
Across all five waves the proportion of adults with domestic IID where any member of the household had left the home in the previous four weeks was significantly higher than the comparison group (W1 65% IID vs. 51% comparison, W2 73% vs. 61%, W3 61% vs. 47%, W4 72% vs. 56%, W5 78% vs.65%).
The proportion of adults with domestic IID that reported they had personally left the house in the previous four weeks was also consistently significantly higher compared with the comparison group - Wave 1 (47%, IID vs. 31% comparison), Wave 2 (53% vs. 39%), Wave 3 (37% vs. 28%), Wave 4 (51% vs. 36%), Wave 5 (61% vs. 50%).
With the exception of Wave 2, adults with domestic IID were more likely than those in the comparison group to live in a household where someone aged under 16 had left the house in the past four weeks - Wave 1 (8%, IID vs. 3% comparison), Wave 3 (9% vs. 5%), Wave 4 (15% vs. 7%), Wave 5 (23% vs. 16%).
In Wave 5 the proportion of adults with domestic IID reporting that another adult in their household had left the house in the previous four weeks was significantly higher compared with the comparison group (39%, IID vs. 32% comparison).

Figure 29.Members of the household leaving the house in the past four weeks to go to work, school, university or a childcare setting by adults
Source: Online survey of UK adults aged 16+ with domestic IID and comparison:
Wave 1: domestic IID (476), comparison (855), 27 Aug-17 Sep 2020; Wave 2: domestic IID (508), comparison (995), 2-18 Dec 2020; Wave 3: domestic IID (465), comparison (1050), 15 Feb-3 Mar 2021; Wave 4: domestic IID (681), comparison (1000), 26 Aug-20 Sep 2021; Wave 5: Adults only in Wave 5, domestic IID (556), comparison (1000), 9 Dec 2021-5 Jan 2022
Figure 29.Members of the household leaving the house in the past four weeks to go to work, school, university or a childcare setting by adults
| Members of household leaving the house in past 4 weeks |
Adults:
Base sizes (n) |
Yes, I have |
Other, under 16 left the house |
Other adult left the house |
None |
NET: Any left the house |
Wave 1
27 Aug-17 Sep 2020 Domestic IID
(A) |
476 |
47%
(B) |
8%
(B) |
31% |
35% |
65%
(B) |
Wave 1
27 Aug-17 Sep 2020 Comparison
(B) |
855 |
31% |
3% |
28% |
49%
(A) |
51% |
Wave 2
2 - 18 Dec 2020
Domestic IID
(C) |
508 |
53%
(D) |
18% |
38% |
26% |
73%
(D) |
Wave 2
2-18 Dec 2020
Comparison
(D) |
995 |
39% |
15% |
33% |
39%
(C) |
61% |
Wave 3
15 Feb-3 Mar 2021 Domestic IID
(E) |
465 |
37%
(F) |
9%
(F) |
30% |
39% |
61%
(F) |
Wave 3
15 Feb-3 Mar 2021 Comparison
(F) |
1050 |
28% |
5% |
26% |
52%
(E) |
47% |
Wave 4
26 Aug-20 Sep 2021 Domestic IID
(G) |
681 |
51%
(H) |
15%
(H) |
35% |
28% |
72%
(H) |
Wave 4
26 Aug-20 Sep 2021 Comparison
(H) |
1000 |
36% |
7% |
34% |
43%
(G) |
56% |
Wave 5
9 Dec 2021-5 Jan 2022 Domestic IID
(I) |
556 |
61%
(J) |
23%
(J) |
39%
(J) |
21% |
78%
(J) |
Wave 5
9 Dec 2021-5 Jan 2022 Comparison
(J) |
1000 |
50% |
16% |
32% |
35%
(I) |
65% |
Source: Online survey of UK adults aged 16+ with domestic IID and comparison:
Wave 1: domestic IID (476), comparison (855), 27 Aug-17 Sep 2020; Wave 2: domestic IID (508), comparison (995), 2-18 Dec 2020; Wave 3: domestic IID (465), comparison (1050), 15 Feb-3 Mar 2021; Wave 4: domestic IID (681), comparison (1000), 26 Aug-20 Sep 2021; Wave 5: Adults only in Wave 5, domestic IID (556), comparison (1000), 9 Dec 2021-5 Jan 2022
Children
In Wave 1, Wave 3 and Wave 4 the proportion of children with domestic IID that were reported as having left the house in the previous four weeks was significantly higher than the comparison group - Wave 1 (41%, IID vs. 26% comparison), Wave 3 (34% vs. 21%), Wave 4 (43% vs. 34%). Conversely, in Wave 2 children in the comparison group were more likely to have left the home than those children with domestic IID (64%, IID vs. 74% comparison).
In Wave 1 the proportion of other children from the household leaving the house was significantly higher among those with domestic IID compared with the comparison group (17%, IID vs. 9% comparison).
In Wave 6 the proportion of children in the comparison group reporting that another adult in their household had left the house in the previous four weeks was significantly higher compared with those children with domestic IID (39%, IID vs. 48% comparison).
The proportion of parents or guardians that reported that they had left the house was higher among those with domestic IID in Wave 1 (51%, IID vs. 37% comparison) and Wave 4 (57% vs. 44%) compared with the comparison group.
Overall, in Wave 1, Wave 3, Wave 4 and Wave 6 the proportion of children with domestic IID where any member of the household had left the home in the previous four weeks was significantly higher than the comparison group (W1 84% IID vs. 63% comparison, W3 78% vs. 60%, W4 84% vs. 70%, W6 91% vs. 86%).

Figure 30.Members of the household leaving the house in the past four weeks to go to work, school, university or a childcare setting or a childcare setting by children
Source: Online survey of UK parents of children aged 0-15, all with domestic IID, comparison
Wave 1: domestic IID (128), comparison (461), 27 Aug-17 Sep 2020: Wave 2: domestic IID (182), comparison (500), 2 Dec-18 Dec 2020: Wave 3: domestic IID (193), comparison (500), 15 Feb-3 Mar 2021: Wave 4: domestic IID (165), comparison (500), 26 Aug-20 Sep 2021: Wave 6: Children only on Wave 6, domestic IID (305), comparison (500), 15 Feb-10 Mar 2022
Figure 30.Members of the household leaving the house in the past four weeks to go to work, school, university or a childcare setting by children
| Members of household leaving the house in past 4 weeks |
Children:
Base sizes (n) |
Yes, child has |
Other, under 16 left the house |
Parent/ guardian left the house |
Other adult left the house |
None |
NET: Any left the house |
Wave 1
27 Aug-17 Sep 2020 Domestic IID
(A) |
128 |
41%
(B) |
17%
(B) |
51%
(B) |
40% |
15% |
84%
(B) |
Wave 1
27 Aug-17 Sep 2020 Comparison
(B) |
461 |
26% |
9% |
37% |
35% |
36%
(A) |
63% |
Wave 2
2-18 Dec 2020
Domestic IID
(C) |
182 |
64% |
32% |
51% |
42% |
7% |
89% |
Wave 2
2-18 Dec 2020 Comparison
(D) |
500 |
74%
(C) |
30% |
49% |
47% |
9% |
87% |
Wave 3
15 Feb-3 Mar 2021 Domestic IID
(E) |
193 |
34%
(F) |
6% |
41% |
33% |
22% |
78%
(F) |
Wave 3
15 Feb-3 Mar 2021 Comparison
(F) |
500 |
21% |
6% |
33% |
33% |
39%
(E) |
60% |
Wave 4
26 Aug-20 Sep 2021 Domestic IID
(G) |
165 |
43%
(H) |
15% |
57%
(H) |
33% |
12% |
84%
(H) |
Wave 4
26 Aug-20 Sep 2021 Comparison
(H) |
500 |
34% |
14% |
44% |
39% |
28%
(G) |
70% |
Wave 6
15 Feb-10 Mar 2022
Domestic IID
(I) |
305 |
65% |
27% |
55% |
39% |
7% |
91%
(J) |
Wave 6
15 Feb-10 Mar 2022
Comparison
(J) |
500 |
71% |
27% |
56% |
48%
(I) |
13%
(I) |
86% |
Source: Online survey of UK parents of children aged 0-15, all with domestic IID, comparison
Wave 1: domestic IID (128), comparison (461), 27 Aug-17 Sep 2020: Wave 2: domestic IID (182), comparison (500), 2 Dec-18 Dec 2020: Wave 3: domestic IID (193), comparison (500), 15 Feb-3 Mar 2021: Wave 4: domestic IID (165), comparison (500), 26 Aug-20 Sep 2021: Wave 6: Children only on Wave 6, domestic IID (305), comparison (500), 15 Feb-10 Mar 2022
Frequency of leaving the house and time spent outside the house
Adults
How often adults reported leaving the house was similar across those with domestic IID and the comparison group across all waves.

Figure 31.Frequency of leaving the house for any reason in the last four weeks by adults
Source: Online survey of UK adults aged 16+ with domestic IID and comparison:
Wave 1: domestic IID (476), comparison (855), 27 Aug-17 Sep 2020; Wave 2: domestic IID (508), comparison (995), 2-18 Dec 2020; Wave 3: domestic IID (465), comparison (1050), 15 Feb-3 Mar 2021; Wave 4: domestic IID (681), comparison (1000), 26 Aug-20 Sep 2021; Wave 5: Adults only in Wave 5, domestic IID (556), comparison (1000), 9 Dec 2021-5 Jan 2022
Figure 31.Frequency of leaving the house for any reason in the last four weeks by adults
| Frequency of leaving the house in past 4 weeks |
Adults:
Base sizes (n) |
I have not left the house |
Less often than once a week |
About once a week |
2 or 3 times a week |
4 or 5 times a week |
Every day or almost every day |
Don’t know |
Wave 1
27 Aug-17 Sep 2020 Domestic IID
(A) |
476 |
4% |
7% |
10% |
25% |
22%
(B) |
32% |
*% |
Wave 1
27 Aug-17 Sep 2020 Comparison
(B) |
855 |
4% |
6% |
12% |
26% |
16% |
36% |
*% |
Wave 2
2-18 Dec 2020
Domestic IID
(C) |
508 |
5% |
9% |
13% |
23% |
17% |
33% |
0% |
Wave 2
2-18 Dec 2020 Comparison
(D) |
995 |
4% |
7% |
12% |
25% |
15% |
37% |
0% |
Wave 3
15 Feb-3 Mar 2021 Domestic IID
(E) |
465 |
8% |
13% |
21% |
21% |
14% |
23% |
*% |
Wave 3
15 Feb-3 Mar 2021 Comparison
(F) |
1050 |
7% |
11% |
18% |
25% |
12% |
26% |
% |
Wave 4
26 Aug-20 Sep 2021 Domestic IID
(G) |
681 |
2% |
6% |
10% |
23% |
21% |
38% |
0% |
Wave 4
26 Aug-20 Sep 2021 Comparison
(H) |
1000 |
3% |
5% |
8% |
24% |
18% |
41% |
1% |
Wave 5
9 Dec 2021-5 Jan 2022 Domestic IID
(I) |
556 |
3% |
6% |
10%
(J) |
25% |
19% |
37% |
*% |
Wave 5
9 Dec 2021-5 Jan 2022 Comparison
(J) |
1000 |
3% |
4% |
6% |
23% |
21% |
42% |
*% |
Source: Online survey of UK adults aged 16+ with domestic IID and comparison:
Wave 1: domestic IID (476), comparison (855), 27 Aug-17 Sep 2020; Wave 2: domestic IID (508), comparison (995), 2-18 Dec 2020; Wave 3: domestic IID (465), comparison (1050), 15 Feb-3 Mar 2021; Wave 4: domestic IID (681), comparison (1000), 26 Aug-20 Sep 2021; Wave 5: Adults only in Wave 5, domestic IID (556), comparison (1000), 9 Dec 2021-5 Jan 2022
Adults with domestic IID and those in the comparison group that reported that they had left the house in the previous four weeks were asked how long they had spent outside the home.
In Wave 2 the proportion of adults with domestic IID spending 3 or more hours outside the home was significantly higher compared with the adults in the comparison group (48% vs. 36%). In other waves the length of time adults reported spending outside the house was similar across those with domestic IID and the comparison group.
Figure 32.Average length of time spent outside the home in the last four weeks by adults
| Length of time spent outside the house in past 4 weeks |
Adults:
Base sizes (n) |
Less than one hour per day |
1 hour up to 3 hours per day |
3 hours up to 5 hours per day |
5-10 hours per day |
More than 10 hours per day |
Wave 1
27 Aug-17 Sep 2020 Domestic IID
(A) |
456 |
11% |
43% |
18% |
24%
(B) |
5% |
Wave 1
27 Aug-17 Sep 2020 Comparison
(B) |
823 |
17%
(A) |
47% |
16% |
18% |
3% |
Wave 2
2-18 Dec 2020
Domestic IID
(C) |
481 |
18% |
35% |
16%
(D) |
25%
(D) |
7%
(D) |
Wave 2
2-18 Dec 2020
Comparison
(D) |
956 |
20% |
45%
(C) |
12% |
20% |
4% |
Wave 3
15 Feb-3 Mar 2021 Domestic IID
(E) |
428 |
25% |
40% |
13%
(F) |
17% |
4% |
Wave 3
15 Feb-3 Mar 2021 Comparison
(F) |
977 |
30% |
43% |
9% |
15% |
3% |
Wave 4
26 Aug-20 Sep 2021 Domestic IID
(G) |
670 |
7% |
35% |
24% |
28% |
6% |
Wave 4
26 Aug-20 Sep 2021 Comparison
(H) |
969 |
9% |
42%
(G) |
21% |
24% |
4% |
Wave 5
9 Dec 2021-5 Jan 2022 Domestic IID
(I) |
541 |
7% |
33% |
25%
(J) |
28% |
7% |
Wave 5
9 Dec 2021-5 Jan 2022 Comparison
(J) |
971 |
9% |
37% |
20% |
29% |
6% |
Source: Online survey of UK adults aged 16+ with domestic IID and comparison who have left the house in the past four weeks:
Wave 1: domestic IID (456), comparison (823), 27 Aug-17 Sep 2020; Wave 2: domestic IID (481), comparison (956), 2-18 Dec 2020; Wave 3: domestic IID (428), comparison (977), 15 Feb-3 Mar 2021; Wave 4: domestic IID (670), comparison (969), 26 Aug-20 Sep 2021; Wave 5: Adults only in Wave 5, domestic IID (541), comparison (971), 9 Dec 2021-5 Jan 2022
Children
In Wave 3, the proportion of children in the comparison group (18%) that reported leaving the house on average every day or almost every day was significantly higher compared with children with domestic IID (12%).

Figure 33.Frequency of leaving the house for any reason in the last four weeks by children
Source: Online survey of UK parents of children aged 0-15, all with domestic IID, comparison
Wave 1: domestic IID (128), comparison (461), 27 Aug-17 Sep 2020: Wave 2: domestic IID (182), comparison (500), 2 Dec-18 Dec 2020: Wave 3: domestic IID (193), comparison (500), 15 Feb-3 Mar 2021: Wave 4: domestic IID (165), comparison (500), 26 Aug-20 Sep 2021: Wave 6: Children only on Wave 6, domestic IID (305), comparison (500), 15 Feb-10 Mar 2022
Figure 33.Frequency of leaving the house for any reason in the last four weeks by children
| Frequency of leaving the house in past 4 weeks |
Children:
Base sizes (n)
% of children that had left the house |
Child has not left the house |
Less often than once a week |
About once a week |
2 or 3 times a week |
4 or 5 times a week |
Every day or almost every day |
Don’t know |
Wave 1
27 Aug-17 Sep 2020 Domestic IID
(A) |
128 |
2% |
10% |
11% |
30% |
20% |
28% |
0% |
Wave 1
27 Aug-17 Sep 2020 Comparison
(B) |
461 |
5% |
8% |
12% |
28% |
17% |
29% |
*% |
Wave 2
2-18 Dec 2020
Domestic IID
(C) |
182 |
5% |
7% |
11%
(D) |
15% |
24% |
39% |
0% |
Wave 2
2-18 Dec 2020 Comparison
(D) |
500 |
4% |
5% |
6% |
12% |
26% |
47% |
1% |
Wave 3
15 Feb-3 Mar 2021 Domestic IID
(E) |
193 |
16% |
15% |
19% |
22% |
16% |
12% |
0% |
Wave 3
15 Feb-3 Mar 2021 Comparison
(F) |
500 |
14% |
14% |
15% |
22% |
17% |
18%
(E) |
1% |
Wave 4
26 Aug-20 Sep 2021 Domestic IID
(G) |
165 |
4% |
7% |
8% |
25% |
21% |
34% |
1% |
Wave 4
26 Aug-20 Sep 2021 Comparison
(H) |
500 |
3% |
7% |
7% |
24% |
20% |
39% |
1% |
Wave 6
15 Feb-10 Mar 2022
Domestic IID
(I) |
305 |
2% |
5% |
4% |
17%
(J) |
24% |
47% |
*% |
Wave 6
15 Feb-10 Mar 2022
Comparison
(J) |
500 |
2% |
3% |
5% |
9% |
23% |
54% |
4% |
Source: Online survey of UK parents of children aged 0-15, all with domestic IID, comparison
Wave 1: domestic IID (128), comparison (461), 27 Aug-17 Sep 2020: Wave 2: domestic IID (182), comparison (500), 2 Dec-18 Dec 2020: Wave 3: domestic IID (193), comparison (500), 15 Feb-3 Mar 2021: Wave 4: domestic IID (165), comparison (500), 26 Aug-20 Sep 2021: Wave 6: Children only on Wave 6, domestic IID (305), comparison (500), 15 Feb-10 Mar 2022
In Wave 3 the proportion of children with domestic IID reported as spending 3 or more hours outside the home on average was significantly higher compared with those in the comparison group (39% IID vs. 26% comparison). The length of time that children with domestic IID reported spending outside the home was broadly similar to the comparison group in other survey waves.
Figure 34.Average length of time spent outside the home in the last four weeks by children
| Length of time spent outside the house in past 4 weeks |
Children:
Base sizes (n) |
Less than one hour per day |
1 hour up to 3 hours per day |
3 hours up to 5 hours per day |
5-10 hours per day |
More than 10 hours per day |
Wave 1
27 Aug-17 Sep 2020 Domestic IID
(A) |
125 |
7% |
36% |
32% |
20% |
2% |
Wave 1
27 Aug-17 Sep 2020 Comparison
(B) |
437 |
11% |
43% |
27% |
15% |
2% |
Wave 2
2-18 Dec 2020
Domestic IID
(C) |
174 |
8% |
20% |
24%
(D) |
47% |
1% |
Wave 2
2-18 Dec 2020
Comparison
(D) |
479 |
9% |
23% |
14% |
51% |
2% |
Wave 3
15 Feb-3 Mar 2021 Domestic IID
(E) |
164 |
22% |
39% |
21%
(F) |
17% |
1% |
Wave 3
15 Feb-3 Mar 2021 Comparison
(F) |
430 |
34%
(E) |
39% |
11% |
13% |
2% |
Wave 4
26 Aug-20 Sep 2021 Domestic IID
(G) |
158 |
7% |
29% |
36% |
26% |
1% |
Wave 4
26 Aug-20 Sep 2021 Comparison
(H) |
484 |
4% |
35% |
38% |
19% |
1% |
Wave 6
15 Feb-10 Mar 2022
Domestic IID
(I) |
297 |
3% |
21% |
30%
(J) |
42% |
3% |
Wave 6
15 Feb-10 Mar 2022
Comparison
(J) |
492 |
4% |
17% |
18% |
54%
(I) |
3% |
Source: Online survey of UK parents of children aged 0-15, all with domestic IID, comparison who have left the house in the past four weeks:
Wave 1: domestic IID (125), comparison (437), 27 Aug-17 Sep 2020: Wave 2: domestic IID (174), comparison (479), 2 Dec-18 Dec 2020: Wave 3: domestic IID (164), comparison (430), 15 Feb-3 Mar 2021: Wave 4: domestic IID (158), comparison (484), 26 Aug-20 Sep 2021: Wave 6: Children only on Wave 6, domestic IID (297), comparison (492), 15 Feb-10 Mar 2022
Use of public transport
Adults
Across all five waves, among adults that reported leaving the house, public transport use was more common for those with domestic IID. Those in the comparison group were more likely to say they had not used public transport in the previous four weeks than those with domestic IID (W1 60% IID vs. 72% comparison, W2 65% vs. 80%, W3 70% vs. 82%, W4 50 vs. 59%, W5 45% vs. 56%).

Figure 35.Use of public transport in the last four weeks by adults
Source: Online survey of UK adults aged 16+ that have left the house, with domestic IID, comparison
Wave 1: domestic IID (456), comparison (823), 27 Aug-17 Sep 2020; Wave 2: domestic IID (481), comparison (956), 2 Dec-18 Dec 2020; Wave 3: Adults with domestic IID (428), comparison (977), 15 Feb-3 Mar 2021; Wave 4: domestic IID (670), comparison (969), 26 Aug-20 Sep 2021; Wave 5: Adults only in Wave 5, domestic IID (541), comparison (971), 9 Dec 2021-5 Jan 2022
Figure 35.Use of public transport in the last four weeks by adults
| Use of public transport in past 4 weeks |
Adults:
Base sizes (n) |
Not used public transport |
Once a week
or less |
2 - 5 times
a week |
Every day /
almost every day |
Wave 1
27 Aug-17 Sep 2020 Domestic IID
(A) |
456 |
60% |
24%
(B) |
16%
(B) |
2% |
Wave 1
27 Aug-17 Sep 2020 Comparison
(B) |
823 |
72%
(A) |
18% |
10% |
1% |
Wave 2
2-18 Dec 2020
Domestic IID
(C) |
481 |
65% |
19%
(D) |
16%
(D) |
3%
(D) |
Wave 2
2-18 Dec 2020 Comparison
(D) |
956 |
80%
(C) |
13% |
7% |
1% |
Wave 3
15 Feb-3 Mar 2021 Domestic IID
(E) |
428 |
70% |
19%
(F) |
11%
(F) |
2% |
Wave 3
15 Feb-3 Mar 2021 Comparison
(F) |
977 |
82%
(E) |
11% |
6% |
1% |
Wave 4
26 Aug-20 Sep 2021 Domestic IID
(G) |
670 |
50% |
28% |
22%
(H) |
3% |
Wave 4
26 Aug-20 Sep 2021 Comparison
(H) |
969 |
59%
(G) |
27% |
14% |
2% |
Wave 5
9 Dec 2021-5 Jan 2022 Domestic IID
(I) |
541 |
45% |
30% |
25%
(J) |
4% |
Wave 5
9 Dec 2021-5 Jan 2022 Comparison
(J) |
971 |
56%
(I) |
27% |
17% |
3% |
Source: Online survey of UK adults aged 16+ with domestic IID and comparison who have left the house in the past four weeks:
Wave 1: domestic IID (456), comparison (823), 27 Aug-17 Sep 2020; Wave 2: domestic IID (481), comparison (956), 2-18 Dec 2020; Wave 3: domestic IID (428), comparison (977), 15 Feb-3 Mar 2021; Wave 4: domestic IID (670), comparison (969), 26 Aug-20 Sep 2021; Wave 5: Adults only in Wave 5, domestic IID (541), comparison (971), 9 Dec 2021-5 Jan 2022
Children
In Wave 1 to Wave 3, the proportion of children in the comparison group who had left the house in the previous four weeks but not used public transport was significantly higher compared with those children with domestic IID (W1 63% IID vs. 77% comparison, W2 73% vs. 82%, W3 68% vs. 90%).

Figure 36.Use of public transport in the last four weeks by children
Source: Online survey of parents of children aged 0-15 that have left the house, with domestic IID, comparison
Wave 1: domestic IID (125), comparison (437), 27 Aug-17 Sep 2020: Wave 2: domestic IID (174), comparison (479), 2 Dec-18 Dec 2020: Wave 3: domestic IID (164), comparison (430), 15 Feb-3 Mar 2021: Wave 4: domestic IID (158), comparison (484), 26 Aug- 20 Sep 2021: Wave 6: Children only in Wave 6, domestic IID (297), comparison (492), 15 Feb-10 Mar 2022
Figure 36.Use of public transport in the last four weeks by children
| Use of public transport in past 4 weeks |
Children:
Base sizes (n) |
Not used public transport |
Once a week or less |
2 - 5 times a week |
Every day / almost every day |
Wave 1
27 Aug-17 Sep 2020 Domestic IID
(A) |
125 |
63% |
25% |
11%
(B) |
0% |
Wave 1
27 Aug-17 Sep 2020 Comparison
(B) |
437 |
77%
(A) |
18% |
5% |
1%
(A) |
Wave 2
2-18 Dec 2020
Domestic IID
(C) |
174 |
73% |
13% |
15%
(D) |
3% |
Wave 2
2-18 Dec 2020
Comparison
(D) |
479 |
82%
(C) |
9% |
8% |
2% |
Wave 3
15 Feb-3 Mar 2021
Domestic IID
(E) |
164 |
68% |
16%
(F) |
15%
(F) |
1% |
Wave 3
15 Feb-3 Mar 2021 Comparison
(F) |
430 |
90%
(E) |
7% |
3% |
*% |
Wave 4
26 Aug-20 Sep 2021 Domestic IID
(G) |
158 |
61% |
27% |
11% |
1% |
Wave 4
26 Aug-20 Sep 2021 Comparison
(H) |
484 |
57% |
33% |
9% |
1% |
Wave 6
15 Feb-10 Mar 2022
Domestic IID
(I) |
297 |
53% |
24% |
23%
(J) |
3% |
Wave 6
15 Feb-10 Mar 2022
Comparison
(J) |
492 |
60% |
23% |
15% |
4% |
Source: Online survey of parents of children aged 0-15 that have left the house, with domestic IID, comparison
Wave 1: domestic IID (125), comparison (437), 27 Aug-17 Sep 2020: Wave 2: domestic IID (174), comparison (479), 2 Dec-18 Dec 2020: Wave 3: domestic IID (164), comparison (430), 15 Feb-3 Mar 2021: Wave 4: domestic IID (158), comparison (484), 26 Aug-20 Sep 2021: Wave 6: Children only in Wave 6, domestic IID (297), comparison (492), 15 Feb-10 Mar 2022
Keyworkers and presence of keyworkers in the household
Adults
In Wave 1, Wave 2 and Wave 4 the percentage of adults with domestic IID that reported they were a key worker was significantly higher than those in the comparison group (W1 26% IID vs. 20% comparison, W2 32% v. 26%, W4 30% vs. 22%). In Wave 2, Wave 3 and Wave 4 adults in the comparison group were more likely than adults with domestic IID to report that no one in the household was a key worker (Wave 2 53% IID vs. 60% comparison, W3 52% vs. 58%, W4 56% vs. 64%).

Figure 37.Members of the household that are keyworkers by adults
Source: Online survey of UK adults aged 16+ with domestic IID and comparison:
Wave 1: domestic IID (476), comparison (855), 27 Aug-17 Sep 2020; Wave 2: domestic IID (508), comparison (995), 2-18 Dec 2020; Wave 3: domestic IID (465), comparison (1050), 15 Feb-3 Mar 2021; Wave 4: domestic IID (681), comparison (1000), 26 Aug-20 Sep 2021; Wave 5: Adults only in Wave 5, domestic IID (556), comparison (1000), 9 Dec 2021-5 Jan 2022
Figure 37.Members of the household that are keyworkers by adults
| Keyworkers in the household |
Adults:
Base sizes (n) |
I am a key worker |
Another member of household is a key worker |
No one is a key worker |
Don’t know |
Wave 1
27 Aug-17 Sep 2020 Domestic IID
(A) |
476 |
26%
(B) |
18% |
59% |
1% |
Wave 1
27 Aug-17 Sep 2020 Comparison
(B) |
855 |
20% |
19% |
64% |
1% |
Wave 2
2-18 Dec 2020
Domestic IID
(C) |
508 |
32%
(D) |
20% |
53% |
1% |
Wave 2
2-18 Dec 2020
Comparison
(D) |
995 |
26% |
17% |
60%
(C) |
1% |
Wave 3
15 Feb-3 Mar 2021 Domestic IID
(E) |
465 |
27% |
21% |
52% |
3% |
Wave 3
15 Feb-3 Mar 2021 Comparison
(F) |
1050 |
25% |
21% |
58%
(E) |
2% |
Wave 4
26 Aug-20 Sep 2021 Domestic IID
(G) |
681 |
30%
(H) |
16% |
56% |
2% |
Wave 4
26 Aug-20 Sep 2021 Comparison
(H) |
1000 |
22% |
15% |
64%
(G) |
2% |
Wave 5
9 Dec 2021-5 Jan 2022 Domestic IID
(I) |
556 |
24% |
14% |
61% |
3%
(J) |
Wave 5
9 Dec 2021-5 Jan 2022 Comparison
(J) |
1000 |
24% |
15% |
63% |
1% |
Source: Online survey of UK adults aged 16+ with domestic IID and comparison:
Wave 1: domestic IID (476), comparison (855), 27 Aug-17 Sep 2020; Wave 2: domestic IID (508), comparison (995), 2-18 Dec 2020; Wave 3: domestic IID (465), comparison (1050), 15 Feb-3 Mar 2021; Wave 4: domestic IID (681), comparison (1000), 26 Aug-20 Sep 2021; Wave 5: Adults only in Wave 5, domestic IID (556), comparison (1000), 9 Dec 2021-5 Jan 2022
Children
Children with domestic IID were more likely than children in the comparison group to report that no one in the household was a keyworker in Wave 2 (55% IID vs. 46% comparison).

Figure 38.Members of the household that are keyworkers by children
Source: Online survey of UK parents of children aged 0-15, all with domestic IID, comparison
Wave 1: domestic IID (128), comparison (461), 27 Aug-17 Sep 2020: Wave 2: domestic IID (182), comparison (500), 2 Dec-18 Dec 2020: Wave 3: domestic IID (193), comparison (500), 15 Feb-3 Mar 2021: Wave 4: domestic IID (165), comparison (500), 26 Aug-20 Sep 2021: Wave 6: Children only on Wave 6, domestic IID (305), comparison (500), 15 Feb-10 Mar 2022
Figure 38.Members of the household that are keyworkers by children
| Keyworkers in the household |
Children: Base sizes (n) |
I (parent/guardian) am a key worker |
Another member of household is a key worker |
No one is a key worker |
Don’t know |
Wave 1
27 Aug-17 Sep 2020 Domestic IID
(A) |
128 |
34% |
22% |
51% |
1% |
Wave 1
27 Aug-17 Sep 2020 Comparison
(B) |
461 |
31% |
23% |
52% |
1% |
Wave 2
2-18 Dec 2020
Domestic IID
(C) |
182 |
28% |
22% |
55%
(D) |
2% |
Wave 2
2-18 Dec 2020
Comparison
(D) |
500 |
35% |
27% |
46% |
1% |
Wave 3
15 Feb-3 Mar 2021 Domestic IID
(E) |
193 |
37% |
22% |
46% |
1% |
Wave 3
15 Feb-3 Mar 2021 Comparison
(F) |
500 |
36% |
29% |
45% |
1% |
Wave 4
26 Aug-20 Sep 2021 Domestic IID
(G) |
165 |
38% |
22% |
49% |
0% |
Wave 4
26 Aug-20 Sep 2021 Comparison
(H) |
500 |
38% |
22% |
48% |
2%
(G) |
Wave 6
15 Feb-10 Mar 2022
Domestic IID
(I) |
305 |
34% |
20% |
51% |
1% |
Wave 6
15 Feb-10 Mar 2022
Comparison
(J) |
500 |
33% |
22% |
49% |
3%
(I) |
Source: Online survey of UK parents of children aged 0-15, all with domestic IID, comparison
Wave 1: domestic IID (128), comparison (461), 27 Aug-17 Sep 2020: Wave 2: domestic IID (182), comparison (500), 2 Dec-18 Dec 2020: Wave 3: domestic IID (193), comparison (500), 15 Feb-3 Mar 2021: Wave 4: domestic IID (165), comparison (500), 26 Aug-20 Sep 2021: Wave 6: Children only on Wave 6, domestic IID (305), comparison (500), 15 Feb-10 Mar 2022
Eating outside the home
Findings for eating outside the home for children and adults with domestic IID symptoms and the relevant comparison groups are summarised here. It is worth noting that different COVID-19 restrictions were also in place at different times during the research. The relationship between experiencing IID symptoms and specific behaviours such as consuming food outside the home are not necessarily causal and require further investigation. Any differences may be linked to other behaviours, for example leaving the home.
Adults
In all five survey waves, the proportion of adults with domestic IID that had eaten food provided in a workplace or education setting was significantly higher compared with adults that had no IID symptoms (W1 23% IID vs. 15% comparison, W2 29% vs. 18%, W3 31% vs. 15%, W4 37% vs. 24%, W5 30% vs. 23%). This was also the case for adults that had bought and consumed ‘ready to eat’ food (W1 49% IID vs. 31% comparison, W2 42% vs. 31%, W3 51% vs. 23%, W4 50% vs. 36%, W5 53% vs. 35%).

Figure 39.Food consumed at work, school, university or childcare setting by adults
Source: Online survey of UK adults aged 16+ that have been in these settings with domestic IID, comparison
Wave 1: domestic IID (217), comparison (261), 27 Aug-17 Sep 2020: Wave 2: domestic IID (268), comparison (387), 2 Dec-18 Dec 2020: Wave 3: domestic IID (170), comparison (292), 15 Feb-3 Mar 202: Wave 4: domestic IID (336), comparison (351), 26 Aug-20 Sep 2021: Wave 5: Adults only in Wave 5, domestic IID (332), comparison (488), 9 Dec 2021-5 Jan 2022
Figure 39.Food consumed at work, school, university or childcare setting by adults
| Food consumed at work, school, university in the last four weeks |
Adults: Base sizes (n) |
Packed lunches from home |
Food provided in the setting |
Bought ‘ready to eat’ food |
Not eaten meals in this setting |
Don’t know |
Wave 1
27 Aug-17 Sep 2020 Domestic IID
(A) |
217 |
65% |
23%
(B) |
49%
(B) |
8% |
1% |
Wave 1
27 Aug-17 Sep 2020 Comparison
(B) |
261 |
69% |
15% |
31% |
12% |
1% |
Wave 2
2-18 Dec 2020
Domestic IID
(C) |
268 |
65% |
29%
(D) |
42%
(D) |
9% |
1% |
Wave 2
2-18 Dec 2020
Comparison
(D) |
387 |
65% |
18% |
31% |
15%
(C) |
1% |
Wave 3
15 Feb-3 Mar 2021 Domestic IID
(E) |
170 |
61% |
31%
(F) |
51%
(F) |
9% |
1% |
Wave 3
15 Feb-3 Mar 2021 Comparison
(F) |
292 |
59% |
15% |
23% |
19%
(E) |
2% |
Wave 4
26 Aug-20 Sep 2021 Domestic IID
(G) |
336 |
62% |
37%
(H) |
50%
(H) |
6% |
1% |
Wave 4
26 Aug-20 Sep 2021 Comparison
(H) |
351 |
63% |
24% |
36% |
12%
(G) |
1% |
Wave 5
9 Dec 2021-5 Jan 2022 Domestic IID
(I) |
332 |
57% |
30%
(J) |
53%
(J) |
9% |
0% |
Wave 5
9 Dec 2021-5 Jan 2022 Comparison
(J) |
488 |
60% |
23% |
35% |
16%
(I) |
1%
(I) |
Source: Online survey of UK adults aged 16+ with domestic IID and comparison that have been in these settings with domestic IID, comparison:
Wave 1: domestic IID (217), comparison (261), 27 Aug-17 Sep 2020; Wave 2: domestic IID (268), comparison (387), 2-18 Dec 2020; Wave 3: domestic IID (170), comparison (292), 15 Feb-3 Mar 2021; Wave 4: domestic IID (336), comparison (351), 26 Aug-20 Sep 2021; Wave 5: Adults only in Wave 5, domestic IID (332), comparison (488), 9 Dec 2021-5 Jan 2022
Children
In Wave 2, Wave 3 and Wave 6, a quarter (25%) of children with domestic IID consumed and bought ‘ready to eat’ food when in work, education or a childcare setting, significantly higher than those children in the comparison group (W2 9% comparison, W3 8%, W6 13%). In Wave 4, children with domestic IID were more likely than those in the comparison group to eat food provided in a school, university or childcare setting (63% IID vs. 46% comparison).

Figure 40.Food consumed at work, school, university or childcare setting by children
Source: Online survey of parents of children aged 0-15 that have been in these settings with domestic IID, comparison
Wave 1: domestic IID (52), comparison (116), 27 Aug-Sep 2020: Wave 2: domestic IID (117), comparison (370), 2 Dec-18 Dec 2020: Wave 3: domestic IID (66), comparison (104), 15 Feb-3 Mar 2021: Wave 4: domestic IID (72), comparison (171), 26 Aug-20 Sep 2021:
Wave 6: Children only in Wave 6, domestic IID (198), comparison (363), 15 Feb-10 Mar 2022
Figure 40.Food consumed at work, school, university or childcare setting by children
| Food consumed at work, school, university in the last four weeks |
Children: Base sizes (n) |
Packed lunches from home |
Food provided in the setting |
Bought ‘ready to eat’ food |
Not eaten meals in this setting |
Don’t know |
Wave 1
27 Aug-17 Sep 2020 Domestic IID
(A) |
52 |
58% |
45% |
21% |
6% |
0% |
Wave 1
27 Aug-17 Sep 2020 Comparison
(B) |
116 |
51% |
48% |
13% |
5% |
1% |
Wave 2
2-18 Dec 2020
Domestic IID
(C) |
117 |
59% |
51% |
25%
(D) |
2% |
0% |
Wave 2
2-18 Dec 2020
Comparison
(D) |
370 |
61% |
47% |
9% |
3% |
*% |
Wave 3
15 Feb-3 Mar 2021 Domestic IID
(E) |
66 |
47% |
56% |
25%
(F) |
10% |
0% |
Wave 3
15 Feb-3 Mar 2021 Comparison
(F) |
104 |
51% |
50% |
8% |
6% |
1% |
Wave 4
26 Aug-20 Sep 2021 Domestic IID
(G) |
72 |
39% |
63%
(H) |
17% |
5% |
0% |
Wave 4
26 Aug-20 Sep 2021 Comparison
(H) |
171 |
56%
(G) |
46% |
17% |
7% |
2% |
Wave 6
15 Feb-10 Mar 2022
Domestic IID
(I) |
198 |
48% |
60% |
25%
(J) |
4% |
*% |
Wave 6
15 Feb-10 Mar 2022
Comparison
(J) |
363 |
54% |
59% |
13% |
3% |
*% |
Source: Online survey of parents of children aged 0-15 that have been in these settings with domestic IID, comparison
Wave 1: domestic IID (52), comparison (116), 27 Aug-Sep 2020: Wave 2: domestic IID (117), comparison (370), 2 Dec-18 Dec 2020: Wave 3: domestic IID (66), comparison (104), 15 Feb-3 Mar 2021: Wave 4: domestic IID (72), comparison (171), 26 Aug-20 Sep 2021:
Wave 6: Children only in Wave 6, domestic IID (198), comparison (363), 15 Feb-10 Mar 2022
Adults
In each survey wave, the proportion of adults with domestic IID that reported consuming food prepared outside the home across a range of settings in the previous four weeks, was higher than among those in the comparison group. Specifically: takeaways/street food vendors; restaurants (eating in (this excludes Wave 3 when consumers were not permitted to eat in)); work/university/school canteen; food prepared in someone else’s home and organised meal delivery services (see Figure 41).

Figure 41.Consuming food prepared outside the home by adults
Wave 3: Restaurants (eating in) option not included in the survey
Source: Online survey of UK adults aged 16+ with domestic IID, comparison:
Wave 1: domestic IID (476), comparison (855), 27 Aug-17 Sep 2020: Wave 2: domestic IID (508), comparison (995), 2 Dec-18 Dec 2020: Wave 3: domestic IID (465), comparison (1,050), 15 Feb-3 Mar 2021: Wave 4: domestic IID (681), comparison (1,000), 26 Aug-20 Sep 2021: Wave 5: Adults only in Wave 5, domestic IID (556), comparison (1,000), 9 Dec 2021-5 Jan 2022
Figure 41.Consuming food prepared outside the home by adults
| Consuming food prepared outside the home in the past 4 weeks |
Adults:
Base sizes (n)
% eating food from each outlet or setting |
Takeaways/ street food vendors |
Restaurants (eating in) |
Work/school/ university canteen |
Food prepared in someone else’s house |
Organised meal delivery services |
Wave 1
27 Aug-17 Sep 2020 Domestic IID
(A) |
476 |
75%
(B) |
62%
(B) |
27%
(B) |
42%
(B) |
15%
(B) |
Wave 1
27 Aug-17 Sep 2020 Comparison
(B) |
855 |
53% |
52% |
11% |
29% |
6% |
Wave 2
2-18 Dec 2020
Domestic IID
(C) |
508 |
73%
(D) |
27%
(D) |
32%
(D) |
32%
(D) |
21%
(D) |
Wave 2
2-18 Dec 2020 Comparison
(D) |
995 |
52% |
12% |
14% |
14% |
6% |
Wave 3
15 Feb-3 Mar 2021 Domestic IID
(E) |
465 |
71%
(F) |
Not asked |
29%
(F) |
26%
(F) |
22%
(F) |
Wave 3
15 Feb-3 Mar 2021 Comparison
(F) |
1050 |
54% |
Not asked |
14% |
15% |
10% |
Wave 4
26 Aug-20 Sep 2021 Domestic IID
(G) |
681 |
77%
(H) |
65%
(H) |
35%
(H) |
48%
(H) |
22%
(H) |
Wave 4
26 Aug-20 Sep 2021 Comparison
(H) |
1000 |
63% |
54% |
20% |
38% |
13% |
Wave 5
9 Dec 2021-5 Jan 2022 Domestic IID
(I) |
556 |
77%
(J) |
64%
(J) |
38%
(J) |
46%
(J) |
22%
(J) |
Wave 5
9 Dec 2021-5 Jan 2022 Comparison
(J) |
1000 |
59% |
54% |
21% |
31% |
8% |
Wave 3: Restaurants (eating in) option not included in the survey
Source: Online survey of UK adults aged 16+ with domestic IID, comparison:
Wave 1: domestic IID (476), comparison (855), 27 Aug-17 Sep 2020: Wave 2: domestic IID (508), comparison (995), 2 Dec-18 Dec 2020: Wave 3: domestic IID (465), comparison (1,050), 15 Feb-3 Mar 2021: Wave 4: domestic IID (681), comparison (1,000), 26 Aug-20 Sep 2021: Wave 5: Adults only in Wave 5, domestic IID (556), comparison (1,000), 9 Dec 2021-5 Jan 2022
Children
The proportion of children with domestic IID that consumed food prepared outside the home in the previous four weeks was higher in some waves and in specific settings compared with children with no IID symptoms.
Overall, in Wave 1, Wave 3 and Wave 6 children with domestic IID were more likely than those in the comparison group to be consuming food prepared outside the home – such as; takeaways/street food vendors; restaurants (eating in (this excludes Wave 3 when consumers were not permitted to eat in)); work/university/school canteen; food prepared in someone else’s home and organised meal delivery services (see Figure 42).

Figure 42.Consuming food prepared outside the home by children
* Wave 3: Restaurants (eating in) option not included in the survey
Source: Online survey of UK parents of children aged 0-15, all with domestic IID, comparison
Wave 1: domestic IID (128), comparison (461), 27 Aug-17 Sep 2020: Wave 2: domestic IID (182), comparison (500), 2 Dec-18 Dec 2020: Wave 3: domestic IID (193), comparison (500), 15 Feb-3 Mar 2021: Wave 4: domestic IID (165), comparison (500), 26 Aug-20 Sep 2021: Wave 6: Children only on Wave 6, domestic IID (305), comparison (500), 15 Feb-10 Mar 2022
Figure 42.Consuming food prepared outside the home by children
| Consuming food prepared outside the home in the past 4 weeks |
Children:
Base sizes (n)
% eating food from each outlet or setting |
Takeaways/ street food vendors |
Restaurants (eating in) |
Work/school/ university canteen |
Food prepared in someone else’s house |
Organised meal delivery services |
Wave 1
27 Aug-17 Sep 2020 Domestic IID
(A) |
128 |
72% |
57% |
46%
(B) |
59%
(B) |
21%
(B) |
Wave 1
27 Aug-17 Sep 2020 Comparison
(B) |
461 |
67% |
53% |
24% |
46% |
8% |
Wave 2
2-18 Dec 2020
Domestic IID
(C) |
182 |
64% |
25%
(D) |
61% |
39%
(D) |
17%
(D) |
Wave 2
2-18 Dec 2020
Comparison
(D) |
500 |
58% |
13% |
54% |
23% |
8% |
Wave 3
15 Feb-3 Mar 2021 Domestic IID
(E) |
193 |
70%
(F) |
Not asked |
39%
(F) |
34%
(F) |
24%
(F) |
Wave 3
15 Feb-3 Mar 2021 Comparison
(F) |
500 |
60% |
Not asked |
23% |
21% |
8% |
Wave 4
26 Aug-20 Sep 2021 Domestic IID
(G) |
165 |
71% |
59% |
50%
(H) |
61% |
18% |
Wave 4
26 Aug-20 Sep 2021 Comparison
(H) |
500 |
72% |
58% |
32% |
59% |
12% |
Wave 6
15 Feb-10 Mar 2022
Domestic IID
(I) |
305 |
79%
(J) |
63%
(J) |
71% |
64%
(J) |
24%
(J) |
Wave 6
15 Feb-10 Mar 2022
Comparison
(J) |
500 |
70% |
54% |
70% |
54% |
18% |
*Wave 3: Restaurants (eating in) option not included in the survey
Source: Online survey of UK parents of children aged 0-15, all with domestic IID, comparison
Wave 1: domestic IID (128), comparison (461), 27 Aug-17 Sep 2020: Wave 2: domestic IID (182), comparison (500), 2 Dec-18 Dec 2020: Wave 3: domestic IID (193), comparison (500), 15 Feb-3 Mar 2021: Wave 4: domestic IID (165), comparison (500), 26 Aug-20 Sep 2021: Wave 6: Children only on Wave 6, domestic IID (305), comparison (500), 15 Feb-10 Mar 2022
Handwashing
Findings for handwashing behaviour for children and adults with domestic IID symptoms and the relevant comparison groups for all survey waves are included in Figures 43 to 52. Any statistically significant differences between these two groups that reported either ‘never’ or ‘always’ washing their hands in specific situations have been highlighted.
As set out previously, questions relating to handwashing behaviours will be subject to a degree of self-reporting and recall bias. In particular, parents may not be able to accurately report on their child’s handwashing behaviours. Additionally, handwashing behaviours are also subject to social desirability bias. It is possible that participants will over-report socially desirable handwashing behaviours and under-report socially undesirable behaviours. These limitations should be considered when interpreting the data.
Adults
In Wave 4, three in five (61%) adults in the comparison group reported that they always washed their hands after a trip outside the home, significantly higher than those with IID symptoms (56%).
In Wave 5, 5% of the comparison group reported that they never wash their hands after a trip outside the home, significantly higher than adults with domestic IID (2%).

Figure 43.Frequency of handwashing after a trip out of the house by adults
Source: Online survey of UK adults aged 16+ with domestic IID, comparison:
Wave 1: domestic IID (476), comparison (855), 27 Aug-17 Sep 2020: Wave 2: domestic IID (508), comparison (995), 2 Dec-18 Dec 2020: Wave 3: domestic IID (465), comparison (1,050), 15 Feb-3 Mar 2021: Wave 4: domestic IID (681), comparison (1,000), 26 Aug-20 Sep 2021: Wave 5: Adults only in Wave 5, domestic IID (556), comparison (1,000), 9 Dec 2021-5 Jan 2022
Figure 43.Frequency of handwashing after a trip out of the house by adults
| Frequency of handwashing after a trip out of the house |
Adults:
Base sizes (n) |
Always |
Most of the time |
Sometimes |
Never |
Prefer not to say |
Wave 1
27 Aug-17 Sep 2020 Domestic IID
(A) |
476 |
65% |
23% |
12%
(B) |
1% |
1% |
Wave 1
27 Aug-17 Sep 2020 Comparison
(B) |
855 |
68% |
23% |
8% |
1% |
*% |
Wave 2
2-18 Dec 2020
Domestic IID
(C) |
508 |
64% |
23% |
11% |
2% |
1% |
Wave 2
2-18 Dec 2020
Comparison
(D) |
995 |
69% |
20% |
10% |
1% |
*% |
Wave 3
15 Feb-3 Mar 2021
Domestic IID
(E) |
465 |
66% |
20% |
11% |
2% |
*% |
Wave 3
15 Feb-3 Mar 2021 Comparison
(F) |
1050 |
69% |
19% |
9% |
2% |
1% |
Wave 4
26 Aug-20 Sep 2021 Domestic IID
(G) |
681 |
56% |
28%
(H) |
14% |
2% |
1% |
Wave 4
26 Aug-20 Sep 2021 Comparison
(H) |
1000 |
61%
(G) |
23% |
14% |
2% |
1% |
Wave 5
9 Dec 2021-5 Jan 2022 Domestic IID
(I) |
556 |
50% |
30% |
17% |
2% |
1% |
Wave 5
9 Dec 2021-5 Jan 2022 Comparison
(J) |
1000 |
52% |
26% |
17% |
5%
(I) |
*% |
Source: Online survey of UK adults aged 16+ with domestic IID, comparison:
Wave 1: domestic IID (476), comparison (855), 27 Aug-17 Sep 2020: Wave 2: domestic IID (508), comparison (995), 2 Dec-18 Dec 2020: Wave 3: domestic IID (465), comparison (1,050), 15 Feb-3 Mar 2021: Wave 4: domestic IID (681), comparison (1,000), 26 Aug-20 Sep 2021: Wave 5: Adults only in Wave 5, domestic IID (556), comparison (1,000), 9 Dec 2021-5 Jan 2022

Figure 44.Frequency of handwashing after blowing nose, sneezing, coughing into hands by adults
Source: Online survey of UK adults aged 16+ with domestic IID, comparison:
Wave 1: domestic IID (476), comparison (855), 27 Aug-17 Sep 2020: Wave 2: domestic IID (508), comparison (995), 2 Dec-18 Dec 2020: Wave 3: domestic IID (465), comparison (1,050), 15 Feb-3 Mar 2021: Wave 4: domestic IID (681), comparison (1,000), 26 Aug-20 Sep 2021: Wave 5: Adults only in Wave 5, domestic IID (556), comparison (1,000), 9 Dec 2021-5 Jan 2022
Figure 44.Frequency of handwashing after blowing nose, sneezing, coughing into hands by adults
| Frequency of handwashing after blowing nose, sneezing, coughing into hands |
Adults:
Base sizes (n) |
Always |
Most of the time |
Sometimes |
Never |
Prefer not to say |
Wave 1
27 Aug-17 Sep 2020 Domestic IID
(A) |
476 |
46% |
30% |
17% |
6% |
1% |
Wave 1
27 Aug-17 Sep 2020 Comparison
(B) |
855 |
43% |
30% |
22%
(A) |
5% |
*% |
Wave 2
2-18 Dec 2020
Domestic IID
(C) |
508 |
44% |
31% |
21% |
5% |
*% |
Wave 2
2-18 Dec 2020
Comparison
(D) |
995 |
40% |
30% |
24% |
5% |
*% |
Wave 3
15 Feb-3 Mar 2021 Domestic IID
(E) |
465 |
45% |
30% |
20% |
4% |
1% |
Wave 3
15 Feb-3 Mar 2021 Comparison
(F) |
1050 |
45% |
28% |
22% |
5% |
*% |
Wave 4
26 Aug-20 Sep 2021 Domestic IID
(G) |
681 |
41% |
29% |
23% |
7% |
1% |
Wave 4
26 Aug-20 Sep 2021 Comparison
(H) |
1000 |
38% |
30% |
27% |
5% |
*% |
Wave 5
9 Dec 2021-5 Jan 2022 Domestic IID
(I) |
556 |
38% |
31%
(J) |
25% |
6% |
*% |
Wave 5
9 Dec 2021-5 Jan 2022 Comparison
(J) |
1000 |
34% |
26% |
32%
(I) |
8% |
*% |
Source: Online survey of UK adults aged 16+ with domestic IID, comparison:
Wave 1: domestic IID (476), comparison (855), 27 Aug-17 Sep 2020: Wave 2: domestic IID (508), comparison (995), 2 Dec-18 Dec 2020: Wave 3: domestic IID (465), comparison (1,050), 15 Feb-3 Mar 2021: Wave 4: domestic IID (681), comparison (1,000), 26 Aug-20 Sep 2021: Wave 5: Adults only in Wave 5, domestic IID (556), comparison (1,000), 9 Dec 2021-5 Jan 2022
Across all survey waves, the proportion of adults in the comparison group that reported always washing their hands after going to the toilet was significantly higher than those with domestic IID (W1 83% IID vs. 90% comparison, W2 83% vs. 89%, W3 78% vs. 86%, W4 78% vs. 83%, W5 78% vs. 84%).

Figure 45.Frequency of handwashing after going to the toilet by adults
Source: Online survey of UK adults aged 16+ with domestic IID, comparison:
Wave 1: domestic IID (476), comparison (855), 27 Aug-17 Sep 2020: Wave 2: domestic IID (508), comparison (995), 2 Dec-18 Dec 2020: Wave 3: domestic IID (465), comparison (1,050), 15 Feb-3 Mar 2021: Wave 4: domestic IID (681), comparison (1,000), 26 Aug-20 Sep 2021: Wave 5: Adults only in Wave 5, domestic IID (556), comparison (1,000), 9 Dec 2021-5 Jan 2022
Figure 45.Frequency of handwashing after going to the toilet by adults
| Frequency of handwashing after going to the toilet |
Adults: Base sizes (n) |
Always |
Most of the time |
Sometimes |
Never |
Prefer not to say |
Wave 1
27 Aug-17 Sep 2020 Domestic IID
(A) |
476 |
83% |
10% |
5% |
1% |
1% |
Wave 1
27 Aug-17 Sep 2020 Comparison
(B) |
855 |
90%
(A) |
7% |
3% |
*% |
*% |
Wave 2
2-18 Dec 2020
Domestic IID
(C) |
508 |
83% |
11%
(D) |
5% |
1% |
1% |
Wave 2
2-18 Dec 2020
Comparison
(D) |
995 |
89%
(C) |
7% |
3% |
1% |
*% |
Wave 3
15 Feb-3 Mar 2021 Domestic IID
(E) |
465 |
78% |
12% |
7%
(F) |
2% |
1% |
Wave 3
15 Feb-3 Mar 2021 Comparison
(F) |
1050 |
86%
(E) |
9% |
4% |
1% |
1% |
Wave 4
26 Aug-20 Sep 2021 Domestic IID
(G) |
681 |
78% |
11% |
9%
(H) |
1% |
1% |
Wave 4
26 Aug-20 Sep 2021 Comparison
(H) |
1000 |
83%
(G) |
10% |
6% |
1% |
*% |
Wave 5
9 Dec 2021-5 Jan 2022 Domestic IID
(I) |
556 |
78% |
13% |
6% |
1% |
2% |
Wave 5
9 Dec 2021-5 Jan 2022 Comparison
(J) |
1000 |
84%
(I) |
11% |
4% |
1% |
1% |
Source: Online survey of UK adults aged 16+ with domestic IID, comparison:
Wave 1: domestic IID (476), comparison (855), 27 Aug-17 Sep 2020: Wave 2: domestic IID (508), comparison (995), 2 Dec-18 Dec 2020: Wave 3: domestic IID (465), comparison (1,050), 15 Feb-3 Mar 2021: Wave 4: domestic IID (681), comparison (1,000), 26 Aug-20 Sep 2021: Wave 5: Adults only in Wave 5, domestic IID (556), comparison (1,000), 9 Dec 2021-5 Jan 2022
Self-reported handwashing behaviours before cooking a meal or preparing food highlighted significant differences between those adults with domestic IID and the comparison group. In Wave 4, 74% of adults in the comparison group report they always wash their hands before cooking, significantly higher than adults with domestic IID (67%).

Figure 46.Frequency of handwashing before cooking a meal/preparing food by adults
Source: Online survey of UK adults aged 16+ with domestic IID, comparison:
Wave 1: domestic IID (476), comparison (855), 27 Aug-17 Sep 2020: Wave 2: domestic IID (508), comparison (995), 2 Dec-18 Dec 2020: Wave 3: domestic IID (465), comparison (1,050), 15 Feb-3 Mar 2021: Wave 4: domestic IID (681), comparison (1,000), 26 Aug-20 Sep 2021: Wave 5: Adults only in Wave 5, domestic IID (556), comparison (1,000), 9 Dec 2021-5 Jan 2022
Figure 46.Frequency of handwashing before cooking a meal/preparing food by adults
| Frequency of handwashing before cooking a meal/preparing food |
Adults: Base sizes (n) |
Always |
Most of the time |
Sometimes |
Never |
Prefer not to say |
Wave 1
27 Aug-17 Sep 2020 Domestic IID
(A) |
476 |
72% |
20% |
6% |
2% |
1% |
Wave 1
27 Aug-17 Sep 2020 Comparison
(B) |
855 |
75% |
17% |
6% |
2% |
*% |
Wave 2
2-18 Dec 2020
Domestic IID
(C) |
508 |
74% |
18% |
7% |
1% |
0% |
Wave 2
2-18 Dec 2020
Comparison
(D) |
995 |
76% |
17% |
5% |
1% |
*% |
Wave 3
15 Feb-3 Mar 2021 Domestic IID
(E) |
465 |
73% |
16% |
8% |
2% |
*% |
Wave 3
15 Feb-3 Mar 2021 Comparison
(F) |
1050 |
75% |
15% |
7% |
2% |
1% |
Wave 4
26 Aug-20 Sep 2021 Domestic IID
(G) |
681 |
67% |
22%
(H) |
9% |
2% |
0% |
Wave 4
26 Aug-20 Sep 2021 Comparison
(H) |
1000 |
74%
(G) |
17% |
8% |
1% |
*% |
Wave 5
9 Dec 2021-5 Jan 2022 Domestic IID
(I) |
556 |
68% |
23% |
7% |
2% |
*% |
Wave 5
9 Dec 2021-5 Jan 2022 Comparison
(J) |
1000 |
68% |
21% |
9% |
2% |
*% |
Source: Online survey of UK adults aged 16+ with domestic IID, comparison:
Wave 1: domestic IID (476), comparison (855), 27 Aug-17 Sep 2020: Wave 2: domestic IID (508), comparison (995), 2 Dec-18 Dec 2020: Wave 3: domestic IID (465), comparison (1,050), 15 Feb-3 Mar 2021: Wave 4: domestic IID (681), comparison (1,000), 26 Aug-20 Sep 2021: Wave 5: Adults only in Wave 5, domestic IID (556), comparison (1,000), 9 Dec 2021-5 Jan 2022
In Wave 5, almost half (46%) of adults with domestic IID reported always washing their hands before eating, significantly higher than those in the comparison group (39%).

Figure 47.Frequency of handwashing before eating by adults
Source: Online survey of UK adults aged 16+ with domestic IID, comparison:
Wave 1: domestic IID (476), comparison (855), 27 Aug-17 Sep 2020: Wave 2: domestic IID (508), comparison (995), 2 Dec-18 Dec 2020: Wave 3: domestic IID (465), comparison (1,050), 15 Feb-3 Mar 2021: Wave 4: domestic IID (681), comparison (1,000), 26 Aug-20 Sep 2021: Wave 5: Adults only in Wave 5, domestic IID (556), comparison (1,000), 9 Dec 2021-5 Jan 2022
Figure 47.Frequency of handwashing before eating by adults
| Frequency of handwashing before eating |
Adults:
Base sizes (n) |
Always |
Most of the time |
Sometimes |
Never |
Prefer not to say |
Wave 1
27 Aug-17 Sep 2020 Domestic IID
(A) |
476 |
52% |
27% |
16% |
4% |
1% |
Wave 1
27 Aug-17 Sep 2020 Comparison
(B) |
855 |
49% |
27% |
20% |
4% |
*% |
Wave 2
2-18 Dec 2020
Domestic IID
(C) |
508 |
46% |
33% |
18% |
3% |
*% |
Wave 2
2-18 Dec 2020
Comparison
(D) |
995 |
47% |
29% |
19% |
4% |
*% |
Wave 3
15 Feb-3 Mar 2021 Domestic IID
(E) |
465 |
48% |
30%
(F) |
16% |
6% |
1% |
Wave 3
15 Feb-3 Mar 2021 Comparison
(F) |
1050 |
51% |
25% |
20% |
5% |
*% |
Wave 4
26 Aug-20 Sep 2021 Domestic IID
(G) |
681 |
44% |
27% |
22% |
6% |
1% |
Wave 4
26 Aug-20 Sep 2021 Comparison
(H) |
1000 |
48% |
28% |
20% |
4% |
*% |
Wave 5
9 Dec 2021-5 Jan 2022 Domestic IID
(I) |
556 |
46%
(J) |
26% |
21% |
6% |
1% |
Wave 5
9 Dec 2021-5 Jan 2022 Comparison
(J) |
1000 |
39% |
28% |
26%
(I) |
7% |
*% |
Source: Online survey of UK adults aged 16+ with domestic IID, comparison:
Wave 1: domestic IID (476), comparison (855), 27 Aug-17 Sep 2020: Wave 2: domestic IID (508), comparison (995), 2 Dec-18 Dec 2020: Wave 3: domestic IID (465), comparison (1,050), 15 Feb-3 Mar 2021: Wave 4: domestic IID (681), comparison (1,000), 26 Aug-20 Sep 2021: Wave 5: Adults only in Wave 5, domestic IID (556), comparison (1,000), 9 Dec 2021-5 Jan 2022
Children
As with all the findings attributed to children, these are based on the responses of parents answering on their behalf. However, with handwashing it is possible that there are more likely to be differences between what the parent reports and what happens in practice.
In Wave 1 and Wave 4, the proportion of parents of children with no IID symptoms reported that their child always washing their hands after a trip outside the home was significantly higher than those with domestic IID (W1 41% IID vs. 56% comparison, W4 31% vs. 41%).

Figure 48.Frequency of handwashing after a trip out of the house by children
Source: Online survey of UK parents of children aged 0-15, all with domestic IID, comparison
Wave 1: domestic IID (128), comparison (461), 27 Aug-17 Sep 2020: Wave 2: domestic IID (182), comparison (500), 2 Dec-18 Dec 2020: Wave 3: domestic IID (193), comparison (500), 15 Feb-3 Mar 2021: Wave 4: domestic IID (165), comparison (500), 26 Aug-20 Sep 2021: Wave 6: Children only on Wave 6, domestic IID (305), comparison (500), 15 Feb-10 Mar 2022
Figure 48.Frequency of handwashing after a trip out of the house by children
| Frequency of handwashing after a trip out of the house |
Children: Base sizes (n) |
Always |
Most of the time |
Sometimes |
Never |
Prefer not to say |
Don’t know |
Not applicable |
Wave 1
27 Aug-17 Sep 2020
Domestic IID
(A) |
128 |
41% |
39%
(B) |
14% |
2% |
0% |
1% |
4% |
Wave 1
27 Aug-17 Sep 2020
Comparison
(B) |
461 |
56%
(A) |
25% |
14% |
1% |
*% |
1% |
2% |
Wave 2
2-18 Dec 2020
Domestic IID
(C) |
182 |
43% |
31% |
15% |
5% |
0% |
1% |
4% |
Wave 2
2-18 Dec 2020
Comparison
(D) |
500 |
46% |
29% |
15% |
3% |
1% |
2% |
3% |
Wave 3
15 Feb-3 Mar 2021
Domestic IID
(E) |
193 |
48% |
28% |
15% |
5% |
0% |
1% |
3% |
Wave 3
15 Feb-3 Mar 2021
Comparison
(F) |
500 |
53% |
25% |
14% |
3% |
1% |
2% |
3% |
Wave 4
26 Aug-20 Sep 2021
Domestic IID
(G) |
165 |
31% |
34% |
22% |
9% |
1% |
*% |
3% |
Wave 4
26 Aug-20 Sep 2021
Comparison
(H) |
500 |
41%
(G) |
29% |
21% |
6% |
1% |
2% |
1% |
Wave 6
15 Feb-10 Mar 2022
Domestic IID
(I) |
305 |
36% |
31% |
26% |
5% |
1% |
1% |
1% |
Wave 6
15 Feb-10 Mar 2022
Comparison
(J) |
500 |
38% |
26% |
23% |
4% |
1% |
3%
(I) |
4%
(I) |
Source: Online survey of UK parents of children aged 0-15, all with domestic IID, comparison
Wave 1: domestic IID (128), comparison (461), 27 Aug-17 Sep 2020: Wave 2: domestic IID (182), comparison (500), 2 Dec-18 Dec 2020: Wave 3: domestic IID (193), comparison (500), 15 Feb-3 Mar 2021: Wave 4: domestic IID (165), comparison (500), 26 Aug-20 Sep 2021: Wave 6: Children only on Wave 6, domestic IID (305), comparison (500), 15 Feb-10 Mar 2022
In Wave 4, 28% of children in the comparison group were reported as always washing their hands after blowing their nose, sneezing or coughing into their hands, and this was significantly higher than those with domestic IID (18%). In Wave 2 and Wave 6, children with domestic IID were significantly more likely than those in the comparison group to be reported as never washing their hands after blowing their nose, sneezing or coughing into their hands (W2 11% IID vs. 6% comparison, W6 10% vs. 6%).

Figure 49.Frequency of handwashing after blowing nose, sneezing, coughing into hands by children
Source: Online survey of UK parents of children aged 0-15, all with domestic IID, comparison
Wave 1: domestic IID (128), comparison (461), 27 Aug-17 Sep 2020: Wave 2: domestic IID (182), comparison (500), 2 Dec-18 Dec 2020: Wave 3: domestic IID (193), comparison (500), 15 Feb-3 Mar 2021: Wave 4: domestic IID (165), comparison (500), 26 Aug-20 Sep 2021: Wave 6: Children only on Wave 6, domestic IID (305), comparison (500), 15 Feb-10 Mar 2022
Figure 49.Frequency of handwashing after blowing nose, sneezing, coughing into hands by children
| Frequency of handwashing after blowing nose, sneezing, coughing into hands |
Children: Base sizes (n) |
Always |
Most of the time |
Sometimes |
Never |
Prefer not to say |
Don’t know |
Not applicable |
Wave 1
27 Aug-17 Sep 2020 Domestic IID
(A) |
128 |
33% |
24% |
26% |
10% |
1% |
2% |
5% |
Wave 1
27 Aug-17 Sep 2020 Comparison
(B) |
461 |
38% |
27% |
23% |
6% |
*% |
2% |
4% |
Wave 2
2-18 Dec 2020
Domestic IID
(C) |
182 |
27% |
29% |
27% |
11%
(D) |
0% |
1% |
5% |
Wave 2
2-18 Dec 2020 Comparison
(D) |
500 |
29% |
30% |
25% |
6% |
1% |
6%
(C) |
4% |
Wave 3
15 Feb-3 Mar 2021 Domestic IID
(E) |
193 |
31% |
27% |
28% |
7% |
2% |
2% |
3% |
Wave 3
15 Feb-3 Mar 2021 Comparison
(F) |
500 |
31% |
26% |
28% |
7% |
*% |
4% |
3% |
Wave 4
26 Aug-20 Sep 2021 Domestic IID
(G) |
165 |
18% |
32% |
32% |
12% |
1% |
2% |
3% |
Wave 4
26 Aug-20 Sep 2021 Comparison
(H) |
500 |
28%
(G) |
24% |
35% |
9% |
1% |
3% |
1% |
Wave 6
15 Feb-10 Mar 2022
Domestic IID
(I) |
305 |
27% |
23% |
34% |
10%
(J) |
1% |
2% |
2% |
Wave 6
15 Feb-10 Mar 2022
Comparison
(J) |
500 |
25% |
26% |
34% |
6% |
*% |
4% |
5%
(I) |
Source: Online survey of UK parents of children aged 0-15, all with domestic IID, comparison
Wave 1: domestic IID (128), comparison (461), 27 Aug-17 Sep 2020: Wave 2: domestic IID (182), comparison (500), 2 Dec-18 Dec 2020: Wave 3: domestic IID (193), comparison (500), 15 Feb-3 Mar 2021: Wave 4: domestic IID (165), comparison (500), 26 Aug-20 Sep 2021: Wave 6: Children only on Wave 6, domestic IID (305), comparison (500), 15 Feb-10 Mar 2022
In Wave 1, Wave 2 and Wave 4 the proportion of children in the comparison group that were reported as always washing their hands after going to the toilet was significantly higher than those with domestic IID (W1 56% IID vs. 69% comparison, W2 58% vs. 68%, W4 43% vs. 67%).
In Wave 2 and Wave 6, the proportion of children with domestic IID that were reported as never washing their hands after going to the toilet were significantly higher than for the comparison group (W2 5% IID vs. 1% comparison, W6 5% vs. 2%).

Figure 50.Frequency of handwashing after going to the toilet by children
Source: Online survey of UK parents of children aged 0-15, all with domestic IID, comparison
Wave 1: domestic IID (128), comparison (461), 27 Aug-17 Sep 2020: Wave 2: domestic IID (182), comparison (500), 2 Dec-18 Dec 2020: Wave 3: domestic IID (193), comparison (500), 15 Feb-3 Mar 2021: Wave 4: domestic IID (165), comparison (500), 26 Aug-20 Sep 2021: Wave 6: Children only on Wave 6, domestic IID (305), comparison (500), 15 Feb-10 Mar 2022
Figure 50.Frequency of handwashing after going to the toilet by children
| Frequency of handwashing after going to the toilet |
Children: Base sizes (n) |
Always |
Most of the time |
Sometimes |
Never |
Prefer not to say |
Don’t know |
Not applicable |
Wave 1
27 Aug-17 Sep 2020 Domestic IID
(A) |
128 |
56% |
22% |
9% |
4% |
1% |
2% |
7% |
Wave 1
27 Aug-17 Sep 2020 Comparison
(B) |
461 |
69%
(A) |
16% |
6% |
1% |
1% |
1% |
6% |
Wave 2
2-18 Dec 2020 Domestic IID
(C |
182 |
58% |
14% |
14%
(D) |
5%
(D) |
0% |
1% |
8% |
Wave 2
2-18 Dec 2020 Comparison
(D) |
500 |
68%
(C) |
14% |
7% |
1% |
1%
(C) |
2% |
8% |
Wave 3
15 Feb-3 Mar 2021 Domestic IID
(E) |
193 |
61% |
19% |
7% |
4% |
1% |
0% |
8% |
Wave 3
15 Feb-3 Mar 2021 Comparison
(F) |
500 |
64% |
17% |
7% |
3% |
*% |
2%
(E) |
7% |
Wave 4
26 Aug-20 Sep 2021 Domestic IID
(G) |
165 |
43% |
24% |
10% |
6% |
3% |
0% |
14%
(H) |
Wave 4
26 Aug-20 Sep 2021 Comparison
(H) |
500 |
67%
(G) |
17% |
8% |
3% |
*% |
1%
(G) |
4% |
Wave 6
15 Feb-10 Mar 2022
Domestic IID
(I) |
305 |
56% |
17% |
12% |
5%
(J) |
2% |
2% |
5% |
Wave 6
15 Feb-10 Mar 2022
Comparison
(J) |
500 |
61% |
17% |
9% |
2% |
1% |
1% |
7% |
Source: Online survey of UK parents of children aged 0-15, all with domestic IID, comparison
Wave 1: domestic IID (128), comparison (461), 27 Aug-17 Sep 2020: Wave 2: domestic IID (182), comparison (500), 2 Dec-18 Dec 2020: Wave 3: domestic IID (193), comparison (500), 15 Feb-3 Mar 2021: Wave 4: domestic IID (165), comparison (500), 26 Aug-20 Sep 2021: Wave 6: Children only on Wave 6, domestic IID (305), comparison (500), 15 Feb-10 Mar 2022
In Wave 3 and Wave 4, the proportion of children in the comparison group that reported always washing their hands before cooking or preparing a meal was significantly higher than for those with domestic IID (W3 41% IID vs. 50% comparison, W4 32% vs. 46%).
In Wave 2, Wave 4 and Wave 6, a significantly higher proportion of children with domestic IID reported never washing their hands before preparing food, compared with those children with no IID symptoms (W2 6% IID vs. 2% comparison, W4 and W6 8% vs. 3%).

Figure 51.Frequency of handwashing before cooking a meal/preparing food by children
Source: Online survey of UK parents of children aged 0-15, all with domestic IID, comparison
Wave 1: domestic IID (128), comparison (461), 27 Aug-17 Sep 2020: Wave 2: domestic IID (182), comparison (500), 2 Dec-18 Dec 2020: Wave 3: domestic IID (193), comparison (500), 15 Feb-3 Mar 2021: Wave 4: domestic IID (165), comparison (500), 26 Aug-20 Sep 2021: Wave 6: Children only on Wave 6, domestic IID (305), comparison (500), 15 Feb-10 Mar 2022
Figure 51.Frequency of handwashing before cooking a meal/preparing food by children
| Frequency of handwashing before cooking a meal/preparing food |
Children: Base sizes (n) |
Always |
Most of the time |
Sometimes |
Never |
Prefer not to say |
Don’t know |
Not applicable |
Wave 1
27 Aug-17 Sep 2020 Domestic IID
(A) |
128 |
45% |
19% |
9% |
5% |
1% |
3% |
19% |
Wave 1
27 Aug-17 Sep 2020 Comparison
(B) |
461 |
47% |
15% |
7% |
2% |
1% |
1% |
27%
(A) |
Wave 2
2-18 Dec 2020 Domestic IID
(C) |
182 |
44% |
13% |
15%
(D) |
6%
(D) |
1% |
2% |
20% |
Wave 2
2-18 Dec 2020 Comparison
(D) |
500 |
49% |
16% |
7% |
2% |
*% |
2% |
24% |
Wave 3
15 Feb-3 Mar 2021 Domestic IID
(E) |
193 |
41% |
22%
(F) |
12% |
5% |
0% |
0% |
21% |
Wave 3
15 Feb-3 Mar 2021 Comparison
(F) |
500 |
50%
(E) |
13% |
10% |
4% |
0% |
2%
(E) |
22% |
Wave 4
26 Aug-20 Sep 2021 Domestic IID
(G) |
165 |
32% |
20% |
8% |
8%
(H) |
1% |
3% |
29% |
Wave 4
26 Aug-20 Sep 2021 Comparison
(H) |
500 |
46%
(G) |
17% |
8% |
3% |
1% |
1% |
24% |
Wave 6
15 Feb-10 Mar 2022
Domestic IID
(I) |
305 |
43% |
18% |
10% |
8%
(J) |
*% |
1% |
20% |
Wave 6
15 Feb-10 Mar 2022
Comparison
(J) |
500 |
40% |
21% |
11% |
3% |
1% |
2% |
23% |
Source: Online survey of UK parents of children aged 0-15, all with domestic IID, comparison
Wave 1: domestic IID (128), comparison (461), 27 Aug-17 Sep 2020: Wave 2: domestic IID (182), comparison (500), 2 Dec-18 Dec 2020: Wave 3: domestic IID (193), comparison (500), 15 Feb-3 Mar 2021: Wave 4: domestic IID (165), comparison (500), 26 Aug-20 Sep 2021: Wave 6: Children only on Wave 6, domestic IID (305), comparison (500), 15 Feb-10 Mar 2022
Among children with domestic IID and those in the comparison group there were no statistically significant differences between handwashing behaviours before eating.

Figure 52.Frequency of handwashing before eating by children
Source: Online survey of UK parents of children aged 0-15, all with domestic IID, comparison
Wave 1: domestic IID (128), comparison (461), 27 Aug-17 Sep 2020: Wave 2: domestic IID (182), comparison (500), 2 Dec-18 Dec 2020: Wave 3: domestic IID (193), comparison (500), 15 Feb-3 Mar 2021: Wave 4: domestic IID (165), comparison (500), 26 Aug-20 Sep 2021: Wave 6: Children only on Wave 6, domestic IID (305), comparison (500), 15 Feb-10 Mar 2022
Figure 52.Frequency of handwashing before eating by children
| Frequency of handwashing before eating |
Children: Base sizes (n) |
Always |
Most of the time |
Sometimes |
Never |
Prefer not to say |
Don’t know |
Not applicable |
Wave 1
27 Aug-17 Sep 2020 Domestic IID
(A) |
128 |
44% |
27% |
18% |
6% |
0% |
1% |
5% |
Wave 1
27 Aug-17 Sep 2020 Comparison
(B) |
461 |
44% |
29% |
20% |
4% |
*% |
1% |
2% |
Wave 2
2-18 Dec 2020 Domestic IID
(C) |
182 |
35% |
23% |
27% |
7% |
1% |
1% |
6% |
Wave 2
2-18 Dec 2020 Comparison
(D) |
500 |
41% |
29% |
20% |
4% |
*% |
2% |
3% |
Wave 3
15 Feb-3 Mar 2021 Domestic IID
(E) |
193 |
43% |
23% |
22% |
7% |
1% |
1% |
4% |
Wave 3
15 Feb-3 Mar 2021 Comparison
(F) |
500 |
40% |
29% |
22% |
5% |
*% |
2% |
2% |
Wave 4
26 Aug-20 Sep 2021 Domestic IID
(G) |
165 |
32% |
28% |
27% |
8% |
2% |
0% |
2% |
Wave 4
26 Aug-20 Sep 2021 Comparison
(H) |
500 |
39% |
26% |
26% |
5% |
*% |
1%
(G) |
2% |
Wave 6
15 Feb-10 Mar 2022
Domestic IID
(I) |
305 |
36% |
28% |
27% |
7% |
1% |
1% |
1% |
Wave 6
15 Feb-10 Mar 2022
Comparison
(J) |
500 |
34% |
28% |
26% |
5% |
1% |
2% |
4% |
Source: Online survey of UK parents of children aged 0-15, all with domestic IID, comparison
Wave 1: domestic IID (128), comparison (461), 27 Aug-17 Sep 2020: Wave 2: domestic IID (182), comparison (500), 2 Dec-18 Dec 2020: Wave 3: domestic IID (193), comparison (500), 15 Feb-3 Mar 2021: Wave 4: domestic IID (165), comparison (500), 26 Aug-20 Sep 2021: Wave 6: Children only on Wave 6, domestic IID (305), comparison (500), 15 Feb-10 Mar 2022
Conclusions
This study was designed to answer four research questions:
- What is the self-reported level of IID in the community during the COVID-19 pandemic, and how does it compare across survey periods with varying degrees of COVID-19 restrictions?
Self-reported levels of domestic IID among UK adults increased significantly in Wave 4 (7.8%) and Wave 5 (6.5%), when restrictions put in place to manage COVID-19 infections were eased nationally (compared to W1 5.6%, W2 5.7%, W3 5.2%). Estimates of domestic IID among UK children was also higher in Wave 6 (12.7%) with fieldwork taking place during term time and when most COVID-19 restrictions had been lifted (W1 6.4%, W2 8.1%, W3 7.8%, W4 7.2%). There is likely to be some seasonality in IID so differences in waves conducted at similar times of year are particularly noteworthy (i.e. for adults Waves 1 and 4 and Waves 2 and 5 and Waves 3 and 6 for children).
- What proportion of people reporting IID symptoms had COVID-19 as the causal illness?
The proportion of adults in the UK that reported testing positive for COVID-19 at the same time as experiencing IID symptoms increased steadily, (W1 1%, W2 2%, W3 4%, W4 5% and W5, 6%) and was significantly higher in Wave 5 compared with Waves 1 to 3. Among children, the proportion that tested positive for COVID-19 was lowest in Wave 2 (2%) compared with other waves (W1 5%, W3 5%, W4 7% and W6 8%) and significantly lower compared with Wave 4 and Wave 6.
- How many people reporting IID consulted a doctor and/or medical practitioner, and if so, were lab tests taken to look for the causative agent of the IID?
The proportion of adults with domestic IID seeking any medical help for their illness increased significantly between Wave 1 (22%) and Wave 5 (34%), when most COVID-19 restrictions had eased.
Overall, the number of adult visits to A&E linked to domestic IID were small and broadly consistent (W1 3%, W2 2%, W3 3%, W4 1%, W5 3%) although Waves 1, 3 and 5 were significantly higher than the figure reported in Wave 4 (1%). There were no statistically significant differences across survey waves between the proportion that attended hospital during their illness (W1 to W3 all 4%, W4 5%, W5 6%).
As most restrictions lifted in Wave 6, significantly more parents of children with domestic IID reported seeking medical help for their child (54%), compared with earlier waves (W1 41%, and W2 44%).
There were no significant differences between survey waves in the proportion of children that visited A&E (W1 and W2 both 3%, W3 6%, W4 5% and W6 3%) or that attended hospital (W1 4%, W2 7%, W3 8%, W4 and W6 both 7%). Note that the sample sizes for children visiting A&E and attending hospital were small.
Overall, similar proportions of those with domestic IID provided a stool or blood sample across all waves, both among adults (W1 7%, W2 10%, W3 9%, W4 7%, and W5 9%) and among children (W1 9%, W2 7%, W3 and W4 both 9%, W6 10%).
- What are the self-reported differences in major IID risk factors (such as eating, lifestyle and travel) between 1) those who get ill and those who don’t and 2) between survey waves?
Behavioural and contextual comparisons between adults and children with and without self-reported domestic IID have been made in this study. Specifically, comparing behaviours identified as major IID risk factors - leaving the home, use of public transport, eating outside the home and handwashing. Any differences require further investigation, as the relationship between experiencing IID symptoms and specific behaviours are not necessarily causal, and specific behaviours will also be correlated.
Across all five waves the proportion of adults with domestic IID that had left the house, and those that had used public transport in the previous four weeks, were both significantly higher than the comparison group. Among parents of children with domestic IID surveyed in Wave 2 the proportion leaving the house was lower compared with those in the comparison group. Conversely, in Wave 1, Wave 3 and Wave 4 the proportion of children with domestic IID that were reported as having left the house in the previous four weeks was significantly higher than the comparison group - Wave 1 (41%, IID vs. 26% comparison), Wave 3 (34% vs. 21%), Wave 4 (43% vs. 34%). In Waves 1 to 3 children with domestic IID were more likely to have used public transport than the comparison group.
Broadly, adults with domestic IID were often more likely than those in the comparison group to report consuming food prepared outside the home across a range of settings, as well as buying and consuming ‘ready to eat’ food.
Across all survey waves, the proportion of adults with domestic IID that reported always washing their hands after going to the toilet was significantly lower compared with those in the comparison group. However, self-reported handwashing behaviour among adults was similar in other situations (after a trip outside the home, after blowing their nose or coughing, before cooking/preparing food or eating). Handwashing behaviours reported by parents for children with domestic IID and those in the comparison group were broadly similar.