


1. Lay Summary
Honey is a valuable and nutritious food product, and its popularity is increasing globally driven by consumers demand for a healthier and more sustainable diet. However, honey is at risk of fraudulent practices such as the addition of exogenous sugars in the form of cheaper plant-based syrups including corn, rice, and sugar beet syrup. Honey authentication is of the utmost importance, but existing methods are not sufficient to detect all types of sugar syrups used for adulteration and at present there is no single method for honey authenticity testing.
The aim of this project was to investigate a) the suitability of Spatially offset Raman Spectroscopy (SORS), a non-invasive technique used to acquire measurements through packaging, for detecting the type and percentage of exogenous sugar adulteration in honey and b) to develop DNA markers (DNA barcoding) to identify the presence of DNA from plant sources such as rice and sugar beet which are used for making sugar syrups used for honey adulteration.
For the purposes of this study, we collected 17 different types of pure honey from the UK and different levels of adulteration were simulated with a range of different plant syrups.
For the DNA barcoding method, we designed specific DNA markers for detecting the presence of sugar syrups. The results showed that adulterated honey was clearly separated from natural honey, even at 1% adulteration level. Moreover, the test was successful for multiple syrup types and was effective on honeys of different compositions.
For the SORS method, we collected spectra from the pure and adulterated honey samples (using rice and sugar beet syrup) and constructed predictive models using different machine learning algorithms (a form of artificial Intelligence), to identify adulterated samples and predict the level and type of adulteration.
The results of this study demonstrate the potential of SORS and DNA barcoding methods to be applied for the authentication of UK honey samples and adulteration detection. The combination of the above techniques could result in a highly accurate and fast method for honey quality control deployable in field. This will support the local beekeeping sector and provide importers and policymakers with an important tool for tackling fraud in the honey industry. Furthermore, it could alleviate consumer concerns around the purity and authenticity of honey products on the market.
2. Executive Summary
Honey is a valuable and nutritious food product, and its popularity is increasing globally driven by consumers demand for a healthier and more sustainable diet. The global honey market is currently worth over USD 8.45 billion which puts honey at risk of fraudulent practices such as the addition of exogenous sugars in the form of cheaper plant-based syrups including rice and sugar beet syrup. Honey authentication is of the utmost importance, but current methods are faced with challenges due to the large variation in natural honey composition, or the incapability to detect certain types of plant syrups to confirm the adulterant used. Molecular methods such as DNA barcoding have shown great promise in identifying plant DNA sources in honey and could be applied to detect plant-based sugars used as adulterants. Furthermore, spectroscopic techniques such as Raman Spectroscopy coupled with machine learning algorithms have shown potential for characterising the metabolic fingerprint of honey and identifying adulteration. Among them Spatially offset Raman Spectroscopy (SORS) is a truly non-invasive technique employable in field and through container.
The aim of this project was to investigate a) the suitability of SORS and machine learning methods to develop a fast, accurate, and cost-effective method for detecting the type and percentage of exogenous sugar adulteration in honey and b) to develop a new DNA barcoding method for honey adulteration detection using qPCR with the aim to discover specific DNA markers for common adulterants such as rice and sugar beet syrup.
For the purposes of this study, we collected 17 different types of pure honey from the UK and different levels of adulteration were simulated (1-30% for the qPCR method and 10-50% for the SORS method) with a range of different plant syrups.
For the qPCR method we designed a series of specific DNA markers for detecting the presence of sugar syrups. The results showed that adulterated honey was clearly separated from natural honey, even at 1% adulteration level. Moreover, the test was successful for multiple syrup types and was effective on honeys of different compositions.
For the SORS method, we collected spectra from the pure and adulterated honey samples (using rice and sugar beet syrup) and constructed classification and regression models with different machine learning algorithms, to identify adulterated samples and predict the level of adulteration as well as the type of adulterant sugar syrup. Random Forest (RF) was consistently the best performing algorithm for both tasks. The RF classification model clearly identified the type of adulterant used and also successfully distinguished between pure and adulterated honey with only 1.1% of the pure honey samples misclassified as adulterated and 3.64% of adulterated samples misclassified as pure honey. Furthermore, RF regression models were also highly efficient at correctly predicting the percentage of adulteration with rice and sugar beet syrup.
The results of this study demonstrate the potential of SORS and DNA barcoding methods to be applied for the authentication of UK honey samples and adulteration detection. The two methods could be used complementary with SORS applied as a rapid non-invasive screening method throughout the honey supply chain, while DNA barcoding could be used as a sensitive and robust method to confirm syrup species origin.
The results of these projects have been published open access and can be accessed as follows:
Shehata, M., Dodd, S., Mosca, S., Matousek, P., Parmar, B., Kevei, Z., & Anastasiadi, M. (2024). Application of Spatial Offset Raman Spectroscopy (SORS) and Machine Learning for Sugar Syrup Adulteration Detection in UK Honey. Foods, 13(15), Article 15. https://doi.org/10.3390/foods13152425 [Under a Creative Commons license]
Dodd, S., Kevei, Z., Karimi, Z., Parmar, B., Franklin, D., Koidis, A., & Anastasiadi, M. (2025). Detection of sugar syrup adulteration in UK honey using DNA barcoding. Food Control, 167, 110772. https://doi.org/10.1016/j.foodcont.2024.110772 [Under a Creative Commons license]
These published research articles encompass a wider scope, so some sections of the publications have been omitted in this report as follows:
-
Methodology, results and discussion relating to DNA markers for corn and corn syrup.
-
Methodology, results and discussion relating to cane syrup adulteration in heather honey.
Keywords: honey, authentication, syrup, adulteration, DNA marker, qPCR, SORS, random forest
3. Introduction
Honey is a sweet substance produced naturally by honeybees and is a popular food product consumed globally for its taste, nutritional value and perceived health benefits (Soares, Pinto, et al., 2017). UK domestic production is far from self-sufficient, and recently the UK was listed as one of the top four countries worldwide importing honey (García, 2018), and the second-largest importer in Europe with 51,912 tonnes of honey imported in 2022 valued at €122 million (CBI, 2024). However, total honey imports in Europe are expected to show little growth or even a negative trend in the coming years mainly because of consumer concerns around the purity and authenticity of honey from various cheap suppliers (CBI, 2024). These concerns were further exacerbated by the recent European Commission’s Joint Research Centre (JRC) report published in 2023 which identified that 46% of the 147 samples tested were suspicious to be adulterated (Ždiniaková et al., 2023). However, the current analytical methods are not yet developed enough to provide definitive answers to the question of adulteration, therefore follow-up investigations of suspicious samples are essential, including collection of traceability information.
Recently, a review was commissioned by the UK government where the need for research into new standard analytical tests for honey authentication was highlighted, partly due to the high-level interpretation needed in existing approaches (Walker et al., 2022a, 2022b). The same report identified some of the possible malpractices associated with honey including direct adulteration with sugar syrups and mislabelling of origin.
Honey is mainly composed of sugars (mostly fructose, glucose, maltose and sucrose, amongst others) and water. Sugar adulteration of honey involves diluting pure honey with cheaper sugar syrups, which not only results in inferior taste but the nutritional properties and chemical composition is also altered (Geana & Ciucure, 2020). Traditional methodology for sugar adulteration detection in honey relies on assessing the sugar composition using methods such as high-performance liquid chromatography (HPLC). The honey legislation for England (Honey (England) Regulations, 2015) and the Codex Standard 12–1981 for honey (Codex Alimentarius, 2022) legislate the minimum quantity of fructose and glucose (no less than 60 g/100g) and maximum levels of sucrose (no more than 5 g/100g) in honey, with deviations allowed for certain honey types such as honeydew, lavender, borage and Citrus spp. amongst others due to the natural differences in sugar composition in these nectar sources. However, as some sugar syrups contain a similar sugar composition to the nectar that bees forage on, more advanced techniques are needed to detect sugar adulteration in honey.
Most of the modern present methodology for exogenous sugar detection in honey are based on stable carbon isotope ratio analysis (SCIRA), which relies on identifying the presence of adulterant C4 plants by assessing the 13C/12C ratio (White, 1992). This is based on the information that honey should be almost entirely derived from plants which use the C3 (Calvin cycle) photosynthetic pathway, whereas plants like corn and sugar cane possess the C4 (Hatch-Slack) pathway (Tosun, 2013). C4 plants have a higher 13C value which becomes apparent if honeys are adulterated with an abundance of corn or cane syrup (Tosun, 2013). However, for syrups derived from C3 plants such as rice and sugar beet, SCIRA is not suitable, so alternative methods are required. Additionally, the 2023 EU JRC technical report indicated that SCIRA methods (AOAC method 991.41) were not effective in detecting honeys suspicious of non-compliance, suggesting that sugar syrups from corn or sugar cane are no longer being used to adulterate honey for the European consumption (Ždiniaková et al., 2023). An additional issue with this method is the presence of false positives and differences between testing labs reported by beekeepers (Kilpinen & Vejsnæs, 2021), which ultimately means samples require additional and more costly analysis to prove authenticity, hence it is evident that more robust and repeatable standard tests are needed.
Recently spectroscopic methods including infrared (IR), Raman, fluorescence spectroscopy and nuclear magnetic resonance (NMR) spectroscopy have been proposed as alternative methods for rapid determination of sugar adulteration of honey. These methods rely on mapping the spectral fingerprint of pure and adulterated honeys and apply multivariate data analysis techniques to build predictive classification and regression models able to identify adulterated samples. Notably 1H-NMR was one of the methods employed during honey testing in the recent 2023 EU JRC technical report. Raman spectroscopy has also been used as a rapid, non-destructive method to detect sugar adulterants in honey, such as fructose, glucose, malt must, etc (Oroian et al., 2018). Furthermore, Spatially Offset Raman Spectroscopy (SORS) is a truly non-invasive technique which has already shown promising results for honey authentication in our previous STFC Food Network+ scoping project [2019]. The technique has previously been applied for the detection of counterfeit alcohol (Ellis et al., 2017) and butter adulteration (Lohumi et al., 2018) through packaging and has been commercialised and deployed in over 75 airports worldwide to detect liquid explosives in unopened bottles.
Despite their potential spectroscopic methods are likely to be affected by the large variation in the characteristics of natural honey, causing unreliable or misinterpreted results (Soares, Amaral, et al., 2017). Therefore, their success relies greatly on the existence of extensive and representative databases and employing robust data analysis techniques to build predictive models able to incorporate the natural variability in honey.
Another emerging technique for honey authenticity is DNA based methods which have been widely used in food authentication, to identify the presence of plant species in various food products or raw ingredients (Madesis et al., 2014). Honey contains multiple sources of nucleic acids including plant DNA from floral forage, microbial DNA, and animal DNA derived from the honeybees (Wirta et al., 2021). Although DNA based methodology has predominantly focused on the botanical authentication of honey (Laube et al., 2010; Lopes et al., 2023; McDonald et al., 2018; Soares et al., 2018; Wu et al., 2017), it has also been shown that residual plant DNA from sugar syrup addition can be successfully identified in certain honey samples mixed with rice and corn molasses (Sobrino-Gregorio et al., 2019; Truong et al., 2022). Nevertheless, this technique has not yet been tested on a wider range of syrups and honey types or developed for other common sugar syrup adulterants. This is the vital next step to assess the reliability of the method in potential real-life situations, where different syrups could be used on any type of honey.
This project aimed to provide a robust methodology for plant-based syrup adulteration detection in honey through a combination of two orthogonal methods; a) SORS coupled with machine learning as a rapid non-invasive screening technique and b) the application of DNA barcoding to build a robust method for sugar adulteration detection in honey, focusing on rice and sugar beet syrup detection.
4. Material and methods
4.1. Sample collection and preparation
4.1.1. Figures, charts and graphs
A total of 17 honey samples were collected from bee farmers around the UK, representative of different seasons and floral sources. Additionally, 4 honey samples of UK origin were purchased commercially (CH1 – CH4) from supermarkets and online retailers. Table 1 includes the types of honey, and the type of flora predominantly available to bees in the area surrounding the apiaries. When a single flora type has been named for a type of honey, this is not necessary an indication the honey is monofloral and it is information obtained from the beekeepers. Samples were stored at room temperature and away from light.
4.1.2. Syrup samples
Sugar syrups derived from rice or sugar beet were purchased from online retailers or grocery stores, two of the syrups (S1, S2) did not state the plant origin so were treated as unknown samples (Table 2). Control samples were included consisting of rice syrup (R5) prepared in house as described in section 5.1.3, granulated sugar (B3), and syrup prepared from B3 with water (50/50 w/v) (B4). These samples were also stored at room temperature and away from light.
A subsample of each of the 17 honey samples was spiked with sugar syrup at 1%, 5%, 10% and 30% (w/w) prior to DNA extraction.
4.1.3. Rice syrup preparation
To prepare sample R5, 450g of long grain brown rice (Sainsbury’s, UK) was washed and steamed in a rice cooker (Breville ITP181 1.8L, UK). 1L of water was added with 150g of barley malt powder (Wang Korea, South Korea), mixed and left to ferment for 6 hours at 60°C. The mixture was strained using a muslin cloth and the liquid collected was boiled for 30 minutes to produce the syrup.
4.1.4. Plant material
Rice grains (Oryza sativa X265), sugar beet seeds (Beta vulgaris var. Altissima) and corn kernels (Zea mays NK Falkone) were sterilised in 5% sodium hypochlorite: water (v/v) (Merck, Germany) and washed with ddH2O before leaving to germinate. Fresh leaf material was then taken from young plantlets for DNA extraction.
4.1.5. Chemicals
Methanol (LC-MS grade) and acetonitrile ( ≥ 99.9%) were obtained from Fisher Scientific, UK. D-(-)-Fructose (> 99%), D-(+)-Glucose (> 99.5%), Sucrose (≥ 99.5%) and Maltose (> 95%) from sourced from Sigma Aldrich, UK.
4.2. DNA extraction
4.2.1. DNA extraction from plant material
Plant material was snap-frozen in liquid nitrogen and ground with a 3 mm tungsten carbide (TC, Qiagen, Germany) bead using the Star-Beater (VWR, UK) at 30 mHz for 2 minutes. The E.Z.N.A Plant DNA kit (Omega Bio-Tek, USA) was then used for the extraction following the manufacturer’s protocol. The eluted samples were stored at -20 °C, and diluted 10X in ultrapure water before testing.
4.2.2. DNA extraction from honey/syrup
10 g pure honey, syrup, or spiked honey was diluted to 50 mL ultrapure water and incubated at 65 °C for 30 minutes until completely dissolved. After centrifugation at 4500 x g for 15 minutes the pellet was processed with two different extraction kit methods.
For the Nucleospin Food kit (Macherery-Nagal, Germany), the pellet was suspended in 200 µL ultrapure water, and ground with a 3 mm TC bead in the Star-Beater (VWR, UK) at 25 mHz for 2 minutes. After the addition of 400 µL of CF lysis buffer and 10 µL of proteinase K (20 mg/mL, QIAGEN, Germany) the samples were incubated for 30 minutes at 65 °C, before adding 10µL of RNase A (10 mg/mL, ThermoFisher Scientific, UK). After this the manufacturer’s protocol was followed for the DNA extraction.
For the DNeasy Plant Pro kit (QIAGEN, Germany), the pellet was suspended in 500 µL CD1 buffer and ground with a 3 mm TC bead in the Star-Beater (VWR, UK) at 25 mHz for 2 minutes. The samples were incubated at 65 °C for 30 minutes after the addition of 10 µL proteinase K (20 mg/mL, QIAGEN, Germany). After this the manufacturer’s protocol was followed.
The DNA was eluted in 50 µL elution buffer with both methods, passed twice through the respective kit column and stored at -20 °C.
4.3. DNA markers
Investigated DNA sequences were obtained from the GenBank database (Benson et al., 2005), and candidate gene regions were identified for rice (Oryza sativa) and sugar beet (Beta vulgaris subsp. vulgaris). Primers were designed to be species specific and tested firstly in silico by using Primer-BLAST (Ye et al., 2012), and then by using PCR (Section 5.4.1) to check for amplification or cross amplification in the rice, corn and sugar beet plant extracts. All primer sequences were developed during this study except where the reference is provided (Table 3). The conserved plant marker targeting the trnL P6 loop was used as a general positive control (Taberlet et al., 2007).
4.4. PCR and qPCR
4.4.1. PCR protocol
The PCR was performed in a 10 µL reaction using 10X DreamTaq Buffer (ThermoFisher Scientific, UK), consisting of 0.2 mM dNTPs, 2 mM MgCl2, 1.25 U Dream Taq DNA polymerase, 0.5 µM of forward and reverse primer (Life Technologies Ltd, UK) and 1 uL DNA extract or water for negative control. The thermocycler (PTC-200, BioRad) conditions are shown in Table 4.
The products were run on a 2 % agarose gel at 100 V for 45 minutes and stained with SafeView dye (NBS Biologicals Ltd., UK) with the GeneRuler DNA ladder (ThermoFisher Scientific, UK) for size comparison.
4.4.2. qPCR protocol
For qPCR a 10 µL final reaction volume was generated using SsoAdvanced Universal SYBR Green Supermix (BioRad, UK) containing antibody-mediated hot-start Sso7d fusion polymerase, dNTPs, MgCl2 and SYBR Green I dye, with 0.5 µM forward and reverse primers and 1 µL DNA extract or water. The reaction was run on the CFX96 Touch Real-Time PCR Detection System (Bio-Rad, UK) using the conditions in Table 5.
The results were assessed either by using the raw Cq value calculated by CFX (CFX Maestro Version 2.3) applying a single threshold with baseline subtracted curve fit, or by scaling the data to set the amplification for the marker of interest at 100 % for the target plant. This was done by the following calculation:
Scaled Amplification (%)=(No. cycles−Cq(sample))×(100(No. cycles−Cq(control)))
Where:
No. cycles is the number of cycles the qPCR ran for.
Cq(sample) is the Cq value obtained for the sample for the marker of interest.
Cq(control) is the Cq value obtained for the target plant control for the marker of interest.
For all results the average Cq and standard deviation (SD) was calculated from three replicate qPCR reactions. PCR negative controls were included in all tests, for the trnL_P6 amplification was sometimes seen above 35 cycles due to the high sensitivity of the marker to all plant DNA, this is respectively shown in the results tables.
4.5. SORS measurements and Multivariate Analysis
4.5.1. Sample Preparation and Spectra Acquisition
The samples selected for SORS consisted of the same pure honeys as Table 1, and selected sugar syrups from Table 2 including R1-4, R6-8, B1 and B5-7. The excluded samples included the control samples (homemade rice syrup R5, granulated sugar B3, homemade syrup prepared from B3) and the bee feed syrup B2, as it was assumed that these would not represent syrups which could be used to adulterate honey. The pure honey samples were liquified at 45 °C for 60 minutes and stirred until homogenous. A subsample of each honey sample was spiked with rice syrup 1 and beet syrup 5 at 10%, 20%, 30% and 50% adulteration level to a total mass of 10 g (w/w). These syrups were selected based on colour and consistency similarity with the majority of the pure honeys. All the samples were further incubated at 45 °C for 60 min in a water bath, with constant agitation to obtain a homogenous mixture. All samples were taken out of the water bath and left to reach room temperature before being transferred to 7 mL Pico Glass vials (Perker Elmin, Buckinghamshire) for SORS measurements. Apart from the honey and syrup samples, a set of individual sugar standards were prepared consisting of 50 % aqueous solutions (w/v) of fructose, glucose, sucrose and maltose. Two HPLC water samples were also used as “blanks”. The SORS measurements took place at The Central Laser Facility (CLF, Rutherford Appleton Laboratory, UK) using a custom-made set up optimised to performed Raman measurement in a conventional point-like spatial offset Raman spectroscopy (SORS) described in detail (Mosca et al., 2019, 2021). Briefly, the excitation source consisted of an 830 nm wavelength with maximum power of 400 mW output power focused on ∼0.5 mm diameter size spot on the sample surface. The Raman signal was collected from a spot with an∼1.5 mm diameter at different spatial displacement (i.e. ‘so’) from the excitation location (so=0 mm; so=4 mm). For each sample, three different locations were measured as shown in Figure A 3 (Appendices). Each SORS spectra were acquired using 35 mW laser power, an acquisition time of 1 s and 10 accumulations (i.e., total time 100 s) for both zero and 4 mm spatial offset.
4.5.2. Data Pretreatment
All data analysis was conducted using the R environment (R version 4.3.2). The raw dataset consisted of a 2-dimentional numerical matrix with the rows corresponding to the samples and the columns corresponding to the Raman shift (cm-1) between 111.92 and 1965.3 cm-1. The dataset consisted of 179 samples (pure honeys = 17, spiked honeys = 136, rice syrups = 7, sugar beet syrups = 4, individual sugar solutions = 4 at 3 different concentrations (50, 25, 12.5%), blank (water) = 2, with all measurements taken in triplicate plus 3 samples repeated at different timepoints).
The raw data were subjected to quality control and pretreatment before proceeding with the construction of predictive models using machine learning algorithms. To begin with, the wavelengths at the peripheries were cut so that the spectral range was restricted from 585 cm-1 to 1550 cm-1 as this contained the structural information-rich areas of the spectra.
Baseline correction was subsequently performed using a modified polynomial fitting method from the R package baseline (version 1.3-4) (Chaouachi et al., 2013). This method subtracts the fluorescence signal from the fluorophores within the honey or syrup matrix which suppresses the Raman signal.
The matrix of the baseline-corrected spectra was smoothed using the Savitzky Golay method for smoothing (differentiation order = 0, polynomial order = 7, and window size = 31) and differentiation included in the R library prospectr (version 0.2.6). This method reduces a signal high-frequency noise by smoothing and reduces the low-frequency signal using differentiation (Gallagher, n.d.).
Following baseline correction, the spectra were normalised using the standard normal variate (SNV) method from the “prospectr” package. This method normalises each row of the smoothed matrix (corresponding to a single SORS measurement) by subtracting each row by its mean and dividing it by its standard deviation. It effectively eliminates the constant offset and multiplicative differences between spectra.
Finally, the mean of the three technical replicates was taken for each sample was then calculated. Figure 1 shows the average SORS spectra for the 17 pure honeys before and after preprocessing.
_and_after_.svg)
4.5.3. Exploratory Data Analysis (EDA) using Principal Component Analysis (PCA)
PCA is an unsupervised multivariate analysis which performs data reduction and denoising and can be used to visualise the natural clustering of the samples for exploratory data analysis purposes and quality control. Based on the PCA results, a total of 14 honey types which showed similar spectral fingerprint were selected for developing machine learning classification and regression models.
4.5.4. Predictive Modelling using Machine Learning
A range of different classification and regression models was constructed based on the SORS spectra with the aim of selecting the best performing algorithm and assessing the potential of detecting the type and level of adulteration in UK honeys. The process followed was divided in the three stages described below and also displayed in Figure 2:

a) The first stage focused on creating separate models for rice and sugar beet adulteration detection. The process for selecting the test set is displayed in Figure 3. The dataset for developing the rice syrup adulteration model consisted of the SORS spectra for the 14 pure honey and the respective rice-spiked honeys at 10%, 20%, 30%, 50% adulteration level (70 samples in total). Similarly, the dataset for sugar beet adulteration model consisted of the SORS spectra for the 14 pure honeys and the respective sugar beet-spiked honeys (70 samples in total). Next, each dataset was separated into training and test set for the purpose of developing a classification model and testing its performance with an independent test set. For each syrup group the training set was formed of 12 randomly selected pure honeys and their corresponding spiked samples (with rice or sugar beet syrup), while the test set consisted of the remaining two pure honeys and their corresponding spiked samples. A total of 91 possible combinations for separating the data into training and test set were tried and 91 models were subsequently built -per algorithm and adulteration type- in order to assess how small changes in the training and test data affect model performance.

The ML algorithms selected for performing classification for rice and sugar beet syrup adulteration were the following: Partial Least Squares-Discriminant Analysis (PLS-DA), Random Forest (RF), Ordinal RF, and eXtreme Gradient Boosting (XGBoost). The resulting models for rice syrup adulteration assigned unknown samples to one of the following 5 classes: honey, 10% rice-spiked, 20% rice-spiked, 30% rice spiked, 50% rice-spiked. Similarly, the sugar-beet syrup adulteration models, assigned samples to 5 classes consisted of pure honey and sugar beet syrup adulterated honeys.
The selection of algorithms was based on their strong track record for high prediction accuracy and suitability for high dimensional datasets.
PLS-DA is a popular algorithm widely used for classification tasks, particularly in complex datasets with high dimensionality and multicollinearity, such as spectroscopic data. It combines partial least squares regression with discriminant analysis, seeking to maximize the separation between classes while reducing the number of variables used for prediction (Gromski et al., 2015). In this study, PLS-DA was performed using the mixOmics library (version 6.24.0).
The RF algorithm is a robust ensemble learning method that operates by constructing multiple decision trees during training and outputs a pattern of classes (classification) or an average prediction of the individual trees (regression). In addition, the ordinal forest (OF) method allows ordinal regression for ordinal target values (categorical variables which can be ordered). Since the percentage of adulteration can be considered an ordinal value ordinal RF was also tested in this project. By aggregating predictions from different trees, the RF algorithm minimises the risk of overfitting and improves prediction accuracy and generalisation to unseen data. Furthermore, by considering random subsets of features for each tree, it promotes diversity among individual trees, contributing to its efficiency in handling high-dimensional data and reducing variance (Breiman, 2001). All RF models were trained and optimised using the caret library in R (version 6.0-94). Prior to training the RF models a feature extraction pre-treatment step was also considered using RF to select the most important features, however, the performance results were considerably worse compared to the models built on the whole feature space and therefore this step was abandoned.
XGBoost is another ensemble technique based on decision trees which has gained popularity due to its effectiveness and efficiency. The algorithm works by iteratively building an ensemble of weak prediction models, typically decision trees, and adding them to the ensemble in a sequential manner. XGBoost utilizes gradient descent optimization techniques for model training and incorporates regularisation techniques such as shrinkage and pruning to prevent overfitting and improve generalisation performance (Chen & Guestrin, 2016). The XGBoost models were trained using the xgboost library (version 1.7.7.1). An added benefit of using XGBoost was that the output for each prediction, consists of the respective probabilities of the sample belonging to each of the possible classes included in the model.
An additional advantage of all three selected algorithms is their ability to identify relevant features or predictors contributing to the classification or regression outcomes enhancing the interpretability of the prediction models. This can be done by studying the variable importance graphs for each model.
b) The second stage consisted of building a combined classification model for identifying both the type of adulterant (rice or sugar beet syrup) and the level of adulteration. The dataset for developing the combined adulteration model consisted of the SORS spectra for the 14 pure honey and the respective rice and sugar beet spiked honeys at 10, 20, 30 50% adulteration level (126 samples in total). Then the dataset was separated into training and test set (91 combinations) following the same approach described at stage 1, except this time each test set included two pure honeys and the respective spiked honeys with both rice and sugar beet syrup. The algorithm employed for developing this model was RF.
c) The final stage consisted of building regression models for rice syrup and sugar beet syrup adulteration with the aim to predict the percentage of adulteration as a continuous numerical value rather than a categorical value. The algorithm employed for regression purposes was RF.
4.5.5. Performance Metrics
For each of the classification models, the confusion matrix for each of the 91 data combinations was used to extract the model accuracy, i.e. the ratio of correct predictions over the total number of predictions and the total error = 1-accuracy. However, to gain more information on the ability of each model to differentiate between pure and adulterated honey we introduced two more metrics, the “hard” and “soft” misclassifications. Among the “hard” misclassifications were the ratio of pure honey misclassified as adulterated and the ratio of adulterated honeys misclassified as pure. These are considered as the most serious types of misclassifications; thus they were captured separately. In contrast “soft” misclassifications were considered less serious errors and represented the cases where an adulterated sample was classified as adulterated but under the wrong adulteration level. The soft misclassification ratio was also captured during this study.
The metric used for the regression models was the root mean square error (RMSE) as shown in Equation (1).
RMSE=√∑ni=1(ˆy−y)2n
where n = the number of samples in the test set
= the predicted value
= the actual value
4.6. Sugar composition analysis
4.6.1. HPLC-ELSD analysis
Sugar analysis was also undertaken during the project to identify and quantify the amount of individual sugars present in the honey samples (Table 1), sugar syrup samples (Table 2) and honey spiked with 10% rice syrup (R1). All samples were prepared and analysed according to the Harmonised Methods of International Honey Commission (Bogdanov, 2009) with some modifications. Chromatographic analysis was performed using a mobile phase comprised of acetonitrile: water: (80:20, v/v) with a flow rate of 0.8 mL/min and a sample injection volume of 10 μL. The column and detector temperature were held at 35 °C during the whole run. Detection was performed using evaporative light scattering detector (ELSD) connected to an Agilent 1200 infinity HPLC (Agilent Technologies, UK) fitted with a prevail carbohydrate ES 5mm size of 250 nm x 4.6 mm diameter and a guard column of the same type. Fructose, glucose, sucrose and maltose were quantified using external calibration curves of commercial standards.
4.6.2. Statistical analysis
The Welch Two Sample t-test was applied on the individual sugar content to compare pure vs rice syrup adulterated honey. The analysis was performed in R v4.4.0.
5. Results
5.1. DNA marker amplification and specificity
PCR reactions were performed for all 10 primer pairs, amplifying specific regions of nuclear (nDNA), mitochondrial (mtDNA) or chloroplast (cpDNA) DNA of the rice, corn and sugar beet DNA extracts. Corn was included in these tests to ensure there was no cross amplification in non-specific species (Table 6).
The plant positive control marker (trnL_P6) was amplified in all three of the plant extracts. Of the rice markers the PLD_1 was amplified in both rice and corn, but the Zmet3, cp and rrn26 were specific to the rice extract. For sugar beet the ant marker was not successfully amplified, while 01, 02, matK and orf409 were only amplified in the sugar beet extract.
The amplification success of the markers was then compared using qPCR, where a lower Cq value indicated a higher amount of target was present in the sample (Table 7). These results confirmed that the rice_PLD1 was amplified in both rice and corn, with sugar beet also amplifying rice_PLD1 after 35 cycles, explaining why it wasn’t detected in the conventional PCR. Similarly, rice_cp showed late amplification in both corn and sugar beet extracts (Cq 38.42 and 38.59). All other markers were only amplified in the species of interest, apart from the beet_ant marker which failed to amplify. In general, the specific markers targeting nDNA produced results with higher Cq values for the target species (Cq 22.30-23.04), the mtDNA markers produced Cq values of 18.46-18.88 whilst the cpDNA markers produced the lowest Cq values between 15.45-16.48 for the target species. However, the chloroplast markers for rice showed a lower specificity, suggesting that the mitochondrial markers might be a better choice for species specificity.
5.2. DNA extraction from sugar syrups
5.2.1. Amplification of general plant marker
The two DNA kits QIAGEN DNeasy Plant Pro and Macherery-Nagel Nucleospin Food Kit were used to extract plant DNA from the sugar syrups, and extraction efficiency was evaluated by assessing the amplification of the chloroplast trnL P6 loop with qPCR, to evaluate the yield of plant DNA (Figure 4, Table 8).
_of_the_trnl_p6_marker_with_sugar_syrup_dna_extr.svg)
For both kits the DNA extraction was successful, with the trnL_P6 marker displaying amplification above 32 cycles in all samples, which is notable given the difficult sample matrix. For all samples the Cq value was lower for the Nucleospin Food kit, indicating a higher plant DNA yield with this kit. Samples B4-7 were not extracted using the Plant Pro kit therefore not included in this analysis. The Nucleospin Food kit was subsequently used for further extractions in this study.
5.2.2. Amplification of plant specific markers
Based on the specific marker amplification results, one marker was selected for each species: rice_rrn26 for rice, and beet_matK for sugar beet. All syrup DNA extracts were evaluated for marker amplification by qPCR. The results, shown in Figure 5, are scaled where the amplification of the target plant was set at 100% after applying a single threshold with baseline subtraction to the data. The standardised Cq and SD values are shown in Table 9, including the trnL_P6 plant marker results for comparison.
All rice syrups showed amplification for the rice_rrn26 marker, ranging from Cq 19.73 (R5) to Cq 37.32 (R7). Late amplification for rice_rrn26 was seen in the sugar syrups of unknown origin (S1 and S2), but with high Cq values ranging from 35.33-37.59. The beet_matK marker did not show strong amplification in any sample other than the sugar beet plant extract. The sugar beet syrup extracts showed Cq values between 33.44-35.68 for beet_matK, with no amplification in B4, B5 and B7. Similar amplification values were seen for beet_matK across the other sugar syrups (Cq 33.48-36.69), leading to the conclusion that this is unlikely to be linked to the presence of sugar beet DNA in the samples. Therefore, no further work was carried out with the beet_matK marker. All three of the other successful beet markers (beet01, beet02 and beet_orf409) were also tried with the sugar beet syrup extracts, with no amplification success (results not shown).
_rice_rrn26_and_(b)_beet_matk_with_plant_and_sugar_syrup_e.svg)
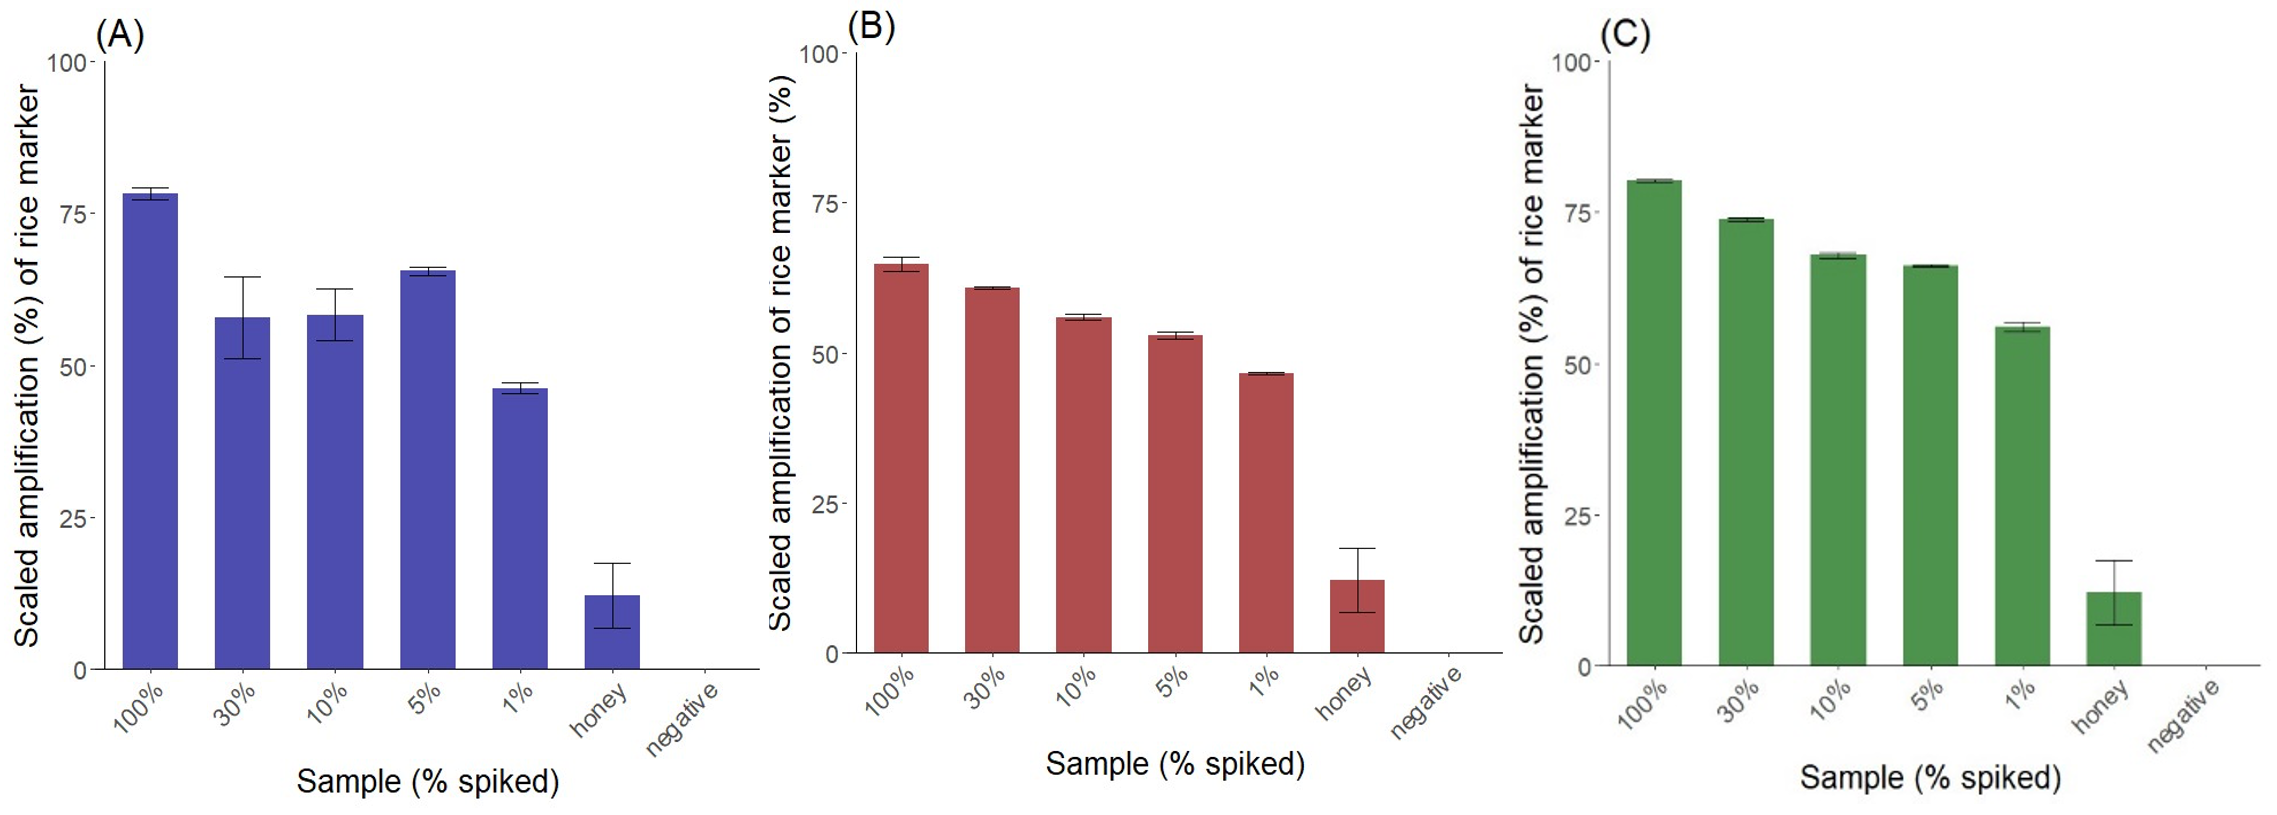
5.3. Detection of rice marker in adulterated honey samples
To reproduce adulterated honey rice syrups R1, R2 and R4, were selected to spike natural honey H17 and the results are shown in Figure 6. The rice marker was detected in 1% spiked honey, with Cq values proportionate to the percentage spike, except in the case of R1 where the 5% spiked sample had a lower value (Cq 25.09) than the 30% (Cq 26.84) and 10% (Cq 26.73) spike (Table 10).
_r1__(b)_r2_an.png)
For the rice marker there was a very low amplification in the pure honey sample (0% spike) however this had a considerably higher Cq value than the 1% spiked sample, with a difference of between ~8-10 cycles for the rice marker, permitting the clear separation of pure honey from the lowest 1% spike.
5.4. Rice marker amplification in different honey types
5.4.1. Rice marker background amplification
To account for the background amplification of the rice marker detected in natural honey, the rice_rrn26 marker was tested for amplification in 16 different honey types, in order to determine a threshold value for the method. Honey H15 was excluded from the results as there was no amplification with the trnL_P6 marker used as a control for the plant DNA (values shown in Table 11). The rice marker was amplified in 8 out of 16 honey samples, with the buckwheat honey (H8) showing the strongest amplification with a Cq value of 35.89. To ensure the test would not flag natural honey as adulterated honey, a threshold was set by taking the sample with the lowest Cq and adding a 95% confidence interval. This was done using the data which had been standardised by applying a single threshold with baseline subtraction, to account for differences in instrument response. For rice the threshold was 34.27 cycles, which is shown on Figure 7 as the dashed line.

5.4.2. Rice marker amplification in 5% spiked honeys
Each honey type was spiked with 5% rice syrup R1 and tested for the rice_rrn26 marker amplification to determine the suitability of the test for different honeys. Extracts which did not show amplification for the plant trnL_P6 loop were excluded from the analysis (H04, H10 and H15), as shown in Table 12. All spiked honey samples showed amplification for the rice_rrn26 marker above the threshold of 34.27 cycles (equalling 25.03% when scaled) (Figure 8).

5.4.3. Application to commercial honeys
Commercial samples marketed as UK origin honeys were purchased from the UK market and extracted with the described protocol. The honey extracts were tested for amplification of the trnL_P6 and rice_rrn26 markers (Table 13). Three of the commercial honey extracts (CH2 - CH4) showed good amplification of plant DNA based on the trnL P6 marker (Cq 19.16 to 23.97), but one commercial honey extract (CH1) showed no amplification for the plant DNA marker. Of the three honeys which amplified the control plant marker there was no amplification of the rice_rrn26 marker.
5.5. Sugar composition of pure, spiked and commercial honey samples
Each sugar syrup, honey type, honey type spiked at 10% with R1 and commercial honey was subjected to HPLC-ELSD analysis to quantify the amount of fructose, glucose, sucrose and maltose in the sample (Table 14). Based on the obtained results and considering a 95% confidence interval, the 17 pure honey samples and 4 commercial honey samples were all below the 5 g/100g limit for sucrose. Even H07 and CH4, the borage honeys, which have an increased limit of 15 g/100g according to legislation (Codex Alimentarius, 2022; Honey (England) Regulations, 2015). However, when assessing the sum of fructose and glucose, one honey sample (H11) was under the 60 g/100g limit with a value of 56.79 g/100g, meaning it would not comply with the honey regulations. All commercial honey samples were within regulation for sugar composition. Compositional analysis of the rice syrup used for spiking (R1) showed that it was composed of 1.49 g/100g fructose, 22.49 g/100g glucose, 0.22 g/100g sucrose and 31.90 g/100g of maltose, with a fructose-glucose sum of 23.99 g/100g. Therefore, it is not surprising that the sucrose level of the honeys spiked with R1 did not increase over the legislated 5 g/100g or 15 g/100g threshold. In all 17 of the honey types spiked with rice syrup, the total of fructose and glucose fell below the 60 g/100g legislation, with a mean concentration of 67.27 g/100g before spiking, and 50.57 g/100g after spiking. Consequently, these pseudo-adulterated samples would have been flagged as non-compliant of the honey standard regulations. Moreover, the maltose concentration of R1-spiked samples was significantly elevated compared to the pure honeys with mean concentrations of 1.43 g/100g and 3.47 g/100g respectively (p < 0.01).
5.6. SORS Results
The following sections describe the results acquired using SORS coupled with multivariate analysis and machine learning for prediction purposes.
5.6.1. PCA
PCA plot was employed to visualise the clustering of the samples as part of the exploratory data analysis. Figure 9 shows a PCA plot containing the 17 pure honey samples, the sugar beet and rice syrups, the individual sugar standards (50, 25, and 12.5% w/v) and the water samples (blanks).

By observing the sample clustering, it becomes obvious that the majority of the pure honeys formed a tight cluster on the bottom right side of the PCA score plot, indicating similar biochemical profiles. The 14 honeys that clustered close together were woodland, sycamore, phacelia, Himalayan balsam, spring set, borage, meadowfoam, sea lavender, echium, field and forest, hedgerow, English blossom, apple blossom, and wildflower. buckwheat (H8) and ivy honey (H4) were positioned away from the main cluster towards the upper middle area of the PCA plot, while heather honey (H11) was positioned in between. Figure A 1 (Appendices) shows the colour differences among the different types of honey, with the ivy (H4) and buckwheat (H8) having distinctly dark amber colours.
Most rice syrups formed a cluster at the right middle side of the PCA plot with the exception of R3 and R4, which were the darkest rice syrups as shown in Figure A 2 (Appendices). Interestingly, maltose and glucose also clustered closely to the rice syrups which indicated that they were the dominant sugars in rice syrups. On the contrary, two of the sugar beet syrups (B5 and B6) were positioned relatively close to the 14 pure honeys, together with the 50% sucrose aqueous solution, while the other two sugar beet syrups were spread towards the top middle of the PCA plot. Sugar beet syrups 5 and 6 were marketed as high fructose “golden syrups” which might explain their proximity to the 14 honeys. On the other hand, sugar beet syrups B1 was marketed as molasses and B7 was a blend of a sugar beet and sugar cane syrup. Both of these syrups had a distinct dark brown colour and produced a high intensity SORS signal and strong fluorescence interference similar to the signal from ivy and buckwheat honeys which were also dark honeys.
The sugar composition of the sugar syrups and pure honeys was further confirmed by HPLC-ELSD, and the results are displayed in Table 14. The sugar composition results show that the dominant sugars in all rice syrups were maltose and glucose, with concentrations ranging from 28.57 to 42.59 g/100 g−1 for maltose and from 9.54 to 28.11 g/100 g−1 for glucose. Rice syrup R1, which was used for spiking the honey samples, contained 31.90 g/100 g−1 maltose and 22.49 g/100 g−1 glucose. Rice syrups R3 and R4 exhibited the lowest glucose concentrations among the rice syrups, at 17.34 and 9.54 g/100 g−1, respectively, while R4 also had the highest maltose concentration, indicating a lower degree of maltose conversion to glucose in this syrup. Figure A 4A (Appendices), depicting the processed Raman spectra for all the rice syrups along with maltose and glucose solutions (50% w/v), also shows significant variations in the Raman profiles of R3 and R4. However, by looking at the biplot in Figure A 4B (Appendices), showing the 150 most important variables for the PCA in Figure 9, it becomes apparent that the clustering of maltose; glucose; and rice syrups R1, R2, and R6–R8 are primarily driven by the Raman shifts around 1380–1390 cm−1, while the Raman shifts around 1400 cm−1 were responsible for the separation of R3 and R4. Therefore, despite the apparent differences between rice syrup spectra, the most important features contributing to their separation on the PCA plot concentrate between 1380 and 1400 cm−1. For sugar beet syrups, the dominant sugar was sucrose, at concentrations between 27.33 and 34.63 g/100 g−1, followed by fructose and glucose at roughly equal concentrations. For B5, which was used for spiking the honey samples, the concentrations of sucrose, fructose, and glucose were 31.52, 24.74, and 24.37 g/100 g−1, respectively. Based on the clustering patterns observed in Figure 9, the group of 14 closely clustered pure honeys were selected for further developing prediction models for honey adulteration detection. Figure 10A shows the PCA plot of the 14 pure honeys with their corresponding rice-spiked samples. The sample distribution in the PCA plot shows a very clear linear separation according to the levels of adulteration, with the 20-50% adulterated samples being completely separated from the pure honey samples.

A similar pattern was observed for the pure honeys and sugar beet-spiked samples, although there was more overlap between samples belonging to different adulteration level groups (Figure 10B). The samples belonging to the 20–50% adulteration level were also clearly separated from the pure honeys, indicating a limit of detection around 10% for both types of sugar syrups. In addition, Figure A 5 (Appendices) shows the clustering of pure and adulterated samples for both rice and sugar beet-spiked samples, which reveals that different levels of the rice-spiked samples are separated over a longer distance along the PC1 axis while sugar beet-spiked samples are much closer together, forming overlapping clusters.
5.5.2. Classification Models Results
The performance metrics obtained for each of the algorithms employed for rice and sugar beet syrup adulteration detection are summarised in Tables 15 - 17. The first two columns show the hard misclassifications, i.e. the percentage of pure honeys misclassified as adulterated and vice versa for all the 91 different combinations. The third column summarises the percentage of soft misclassifications, i.e. adulterated samples assigned to the wrong adulteration level. The last column shows the total error rate, i.e. the percentage of misclassified samples out of all the samples tested (n = 910).
For the rice syrup classification models the RF classification algorithm had the best performance overall compared to the other algorithms tested. In particular, only 1.10% of pure honeys were misclassified as adulterated, which corresponds to 2 instances out of the total 182 (91 combinations of 2 pure honeys derived out of 14 pure honeys). In contrast XGBoost had the highest percentage of pure honeys misclassified as adulterated at 7.69%, while for PLSA-DA and RF-ordinal it was 2.20% and 4.40% respectively.
When considering the hard misclassification rates for the adulterated samples, XGBoost was marginally better at 1.79% followed by the RF classification algorithm at 2.61%. It is also notable that for all algorithms considered the only adulterated samples misclassified as pure honey belonged to the 10% adulteration level, indicating that the level of detection (LOD) is around 10% for all methods.
Regarding the soft misclassifications, both RF algorithms performed best (14.15% and 14.97% respectively) compared to the other algorithms, exhibiting higher ability to differentiate between adulteration levels. The PLSDA had similar performance at 16.07% soft misclassifications while the XGBoost algorithm had the highest misclassification rate at 26.10%. As expected, all samples belonging to the 50% adulteration level were correctly classified by all algorithms.
The total error rate confirmed that the RF classification algorithm performed best with a total of 13.63% total error rate, while XGBoost exhibited the highest error rate at 23.85%.
Table 16 displays the results for the sugar beet classification models, where again, the RF classification model had the best results with 15.71% total misclassifications and XGBoost also had the lowest accuracy out of all with almost 31% misclassifications. The hard misclassifications for RF classification model were almost 1% of the pure honey misclassified as adulterated, and almost 2% of the adulterated samples were misclassified as pure.
The XGBboost results for each sample consisted of the predicted probabilities for each class of adulteration level, Table A 1 shows an example of the XGBoost results. The highest probability was chosen as the predicted class of the sample.
Since RF consistently outperformed the other algorithms, it was selected as the algorithm of choice for building a model based on the combined dataset for rice and sugar beet spiked samples. As seen in Table 17, only 1.10% of the pure samples were misclassified as adulterated and 3.64% of the adulterated samples were misclassified as pure. The total misclassifications were 19.23%. In addition, 2.20% of the rice-adulterated samples were misclassified as sugar beet adulterated and 4.90% of the sugar beet adulterated were misclassified as rice-adulterated.
The spread of total classification accuracy results for the 91 iterations per algorithm and syrup type was further visualised in box plots, as shown in Figure A 6 (Appendices). The box plots further demonstrate the superior performance of the RF algorithm, with all the models built with RF (classification and ordinal) having a median accuracy of around 90% and exhibiting left skewness (median > mean), meaning the majority of values were “large”, with a few values towards the low end of the accuracy spectrum. The only exception was the RF classification models for rice syrup adulteration, which had a median around 80% and exhibited right skewness.
5.5.3. Regression Models Results
Table 18 shows the mean, max, and min RMSE values acquired for the rice and sugar beet regression models after validating with the test set. RMSE is one of the most widely used measures for the performance of a regression model and the lower the RMSE, the closer the predicted value is to the ground truth. This was also demonstrated by calculating the RMSE values which were similar for both rice and sugar beet, with a mean value of around RMSE = 3.7.
Figure 11 shows a scatterplot of predicted vs. actual values for 1 of the 91 models for rice syrup adulteration (Figure 11A) and 1 of the sugar beet adulteration models (Figure 11B). A line, x = y, representing perfect agreement between the predictions and the ground truth, has been fitted in each plot, surrounded by y = x ± 3 lines, which represent a 6% mismatch boundary between the predicted values and ground truth, which contained the majority of the predictions for both types of syrups. These plots could also provide a useful indication of bias or large variance indicative of undertraining or overtraining of the models. The absence of these trends from our results provides further proof of the optimised model training process. The spread of the RMSE for the 91 iterations for the rice and sugar beet regression models is displayed through box plots (Figure A 7 (Appendices)). The plot shows that both have very similar means, with the rice models’ RMSEs having more variation than the sugar beet models.

5.5.4. Variable Importance
The variable importance for each RF model was also calculated to determine the Raman shifts responsible for the predictive power of the classification and regression models. The results showed general agreement between the Raman bands identified as the most important for the prediction and the areas in the SORS spectra with visible differences between the pure and adulterated honeys. These wavenumbers also correspond to the characteristic peaks identified in the individual sugar spectra, i.e., maltose, glucose, and sucrose, which are the dominant sugars in the sugar syrups. Figure 12 shows an example of the variable importance for one of the rice and sugar beet models developed alongside their corresponding SORS spectra. For rice adulteration, the Raman bands mainly responsible for the predictive power of the classification RF models ranged from 860 cm−1 to 890 cm−1 and 920 cm−1 to 950 cm−1, with the peaks at 933–937 cm−1 having the highest contribution. For the sugar beet models, the highest peaks were in the range from 700 cm−1 to 850 cm−1 with the wavenumbers at 808, 711, 839, 718, and 715 cm−1 showing the highest contribution in order of importance. Figure A 8 (Appendices) shows that the most important variables for the combined model were located between 700 cm−1 and 950 cm−1, with the highest peak at ~935 cm−1, which corresponds to a combination of the important variables for the individual models.
_shows_the_var.svg)
The variables identified as most important for the RF regression models were also similar to the classification models (Figure A 9 (Appendices)). The most important variables for the rice adulteration model were the Raman shifts at 873, 870, and 939 cm−1, in order of importance, while for the sugar beet adulteration models, the most important variables in order of importance were the Raman shifts at 781, 775, 708, 808, and 839 cm−1.
6. Discussion
6.1. DNA markers and their specificity
In this study a DNA barcoding approach to authenticate honey was evaluated using novel endogenous markers developed for rice and sugar beet syrup detection. Typically, endogenous reference genes are required to be species-specific, having a stable low copy number with limited intra-species variability (Chaouachi et al., 2013). They are generally used to determine genetically modified organisms (GMOs) occurrence in ingredients, as the presence of the modified gene is compared to that of the reference gene (Xiujie et al., 2019). However, in the case of highly processed food products, such as sugar syrups, low copy number genes are less likely to be detected due to the low amount of highly degraded DNA present in the sample (Caldwell, 2017). Hence, it makes more sense to target genome regions with high copy number, such as chloroplast or mitochondrial genes, to increase the chance of detection. Although this eliminates the possibility of accurate fraud quantification, in the case of honey authentication this is not a necessity, as simple identification of adulterant material provides substantial evidence for misconduct (Nehal et al., 2021). In our study, appropriate DNA markers were identified from literature, or designed in house, targeting nuclear, chloroplast and mitochondrial gene regions in rice or sugar beet.
Most of the markers tested showed flaws, such as no amplification or cross amplification with other species. The beet_ant marker was developed by Chaouachi et al. (2013) as a reference marker specific to sugar beet (Beta vulgaris L). They found the marker amplified in all 39 of the Beta vulgaris L varieties tested, with no amplification in closely related species. However, in our study the beet_ant marker failed to amplify, despite similar PCR conditions (60°C annealing temperature) being used. This could be due to a different variety of sugar beet being used, as the “Altissima” variety used here was not included in their study, but these results unfortunately rendered the beet_ant primer unsuitable as an endogenous sugar beet marker. The rice_PLD1 marker was used by Sobrino-Gregorio et al. (2019) to detect honey adulteration with rice molasses, they determined that it was the most effective primer pair used in their study providing quantification at 2-5% when using a standard curve of rice genomic DNA (Sobrino-Gregorio et al., 2019). However, we showed that the rice_PLD1 marker was also amplified in the corn and sugar beet extracts. Moreover these results were confirmed by Xiujie et al. (2019), who found that the rice_PLD1 displayed non-specific binding in both maize and potato, further proving evidence that it is not a highly specific marker for rice (Xiujie et al., 2019).
Of the remaining successful DNA markers, the primers targeting regions of nDNA produced results with higher Cq values than those targeting cpDNA or mtDNA. Although nuclear markers have been used with success in other studies, there are clear advantages to using higher copy number targets. For instance, although Truong et al. (2022) were successfully using the nuclear corn_PERK2 marker to detect Korean honey adulterated with corn syrup, they were only able to reach a detection limit of ≥10%, where here a LoD of 1% was achieved with plastid markers – although a different syrup type was used (Truong et al., 2022). Indeed, mitochondrial DNA is widely used in DNA analysis of food products, as it is believed that the plastid structure further reduces the DNA degradation (Sajali et al., 2018). Although the chloroplast markers used in this study produced lower Cq values (higher detection) than the mitochondrial markers, they had a lower specificity to the target plant, as the rice cpDNA markers showed cross amplification in the other non-target plant DNA extracts. Most likely this is due to the fact that chloroplast genomes are more conserved than the mitochondria genomes, possessing a slower rate of evolution and sequence variability (F. Li et al., 2022). This can explain why the beet_matK chloroplast marker showed low amplification levels in many of the sugar syrup extracts, despite appearing species specific when tested on the rice and corn plant extracts.
6.2. DNA extraction from sugar syrups
One of the challenges of DNA based food authentication tests is the DNA extraction, as food products contain a complex matrix of ingredients which may have been altered by different types of processing. Honey itself can be a difficult matrix to extract DNA from due to the presence of various PCR inhibitors such as organic acids, polyphenols, pigments, enzymes and wax particles. However, numerous studies have shown success with commercial kits aimed for DNA isolation from plants or food products (Chiara et al., 2021; Hawkins et al., 2015; Khansaritoreh et al., 2020). DNA extraction from sugar syrups have the further issue of being highly processed causing high DNA fragmentation and potentially reducing the quantity of target DNA in the sample. Furthermore, they may be added to honey samples in only small amounts, decreasing even more the residual syrup DNA content in the sample. One further challenge is how to assess the quality and quantity of DNA extracted from the sample, as there can be multiple types of DNA (plant, animal, microbial) present in one sample. This means that typical spectrophotometer measurements (such as nanodrop) of the DNA will represent the total DNA of all types, as opposed to just the DNA type of interest, hence this can be an inaccurate way of assessing the success of the expected plant DNA extraction from a food product In this study, a conserved plant marker was used as a means of evaluating the DNA extractions in terms of plant DNA yield. The primer targeting the trnL P6 loop was shown to perform excellently on highly degraded DNA, due to its short amplification product (10-143bp), and had displayed 100% amplification success in a food dataset including rice, corn and beet, making it a highly appropriate marker for this study (Taberlet et al., 2007). Moreover, the trnL P6 marker has already been used in studies exploring the diversity of plants in honey samples with metabarcoding of the region, but has yet to be applied to sugar syrup adulteration detection (Chiara et al., 2021; Valentini et al., 2010).
This study found that the Nucleospin Food kit produced syrup extracts with a higher yield of plant DNA compared to the DNeasy Plant Pro kit. Similarly, Sobrino-Gregorio et al. (2019) found that the NucleoSpin Food kit provided high quality DNA extractions from rice molasses. Although the DNA extraction method proved to be successful for all the sugar syrup samples, in case of a pure honey sample (H15),three of the 5% rice syrup spiked honey samples (H04, H10 and H15) and one commercial honey (CH1) there was no amplification with the trnL_P6, suggesting that no plant DNA was present in the sample or the extraction itself was not suitable for these samples (extraction repeated three times with no success). For this reason, these samples were excluded from the analysis, as a more optimised DNA extraction may be required to remove PCR inhibitors or increase the DNA yield in these samples.
6.3. DNA marker amplification in sugar syrups
The amplification of the specific DNA markers varied greatly amongst the different types of rice syrups, with some samples amplifying the target marker weakly (R7). For syrups R1, R2, R4, and R5 the amplification of the trnL_P6 plant marker and the target rice marker had similar Cq values, amplifying within 3 cycles of each other, suggesting that rice was the main component of the syrup. But there were some samples with discrepancies between the amplification of the plant marker and the species-specific marker, for example in R3 the trnL_P6 amplified with a Cq of 26.42, but the rice_rrn26 marker amplified later with a Cq of 34.02. Similar patterns were seen with R6 (Cq 27.81 and 33.8) and R7 (Cq 26.78 and 37.32), suggesting that the amount of rice target in the sample was much less than the amount of total plant DNA. Although this could be due to the rice_rrn26 primer target sequence becoming degraded in the sample, it could indicate that the syrups themselves are not authentic. However, it could also be that different rice varieties were used to prepare the syrup, possessing sequence differences at the target site, as the specificity test was only performed with one rice line. This inconsistent pattern was also seen with the beet syrup extracts which didn’t amplify the target marker, while there was undoubtedly plant DNA in the sample due to the positive trnL_P6 amplification, nonetheless this could not be attributed to sugar beet DNA using the qPCR test.
We were unable to achieve sufficient amplification of the sugar beet markers in the sugar beet syrup extracts, even though the markers had shown significant amplification in the sugar beet plant control. Similar results have been obtained for sugar products derived from sugar beet, where Oguchi et al. (2009) suggested that sugar beet DNA had degraded during the early stage of sugar processing as specific markers beet01 and beet02 (included in this study) were amplified in sugar beet juice, but not in subsequent sugar products (Oguchi et al., 2009). However, limited success was seen with sugar cane products in a study by Wang et al. (2020), who found that DNA was present in low amounts in extracts prepared from sugar cane molasses, refined syrup and crystalised sugar samples with the PCR product amplified in all but one of the sugar extracts (Wang et al., 2020). Thus, the positive amplification obtained for the trnL_P6 for all the sugar beet syrups tested in this study should be further investigated to confirm the success of the extraction protocol, which could be done by performing amplicon sequencing of this marker. This method could also be used to identify the plant origin of the unknown syrup samples (S1 and S2), as neither the rice nor sugar beet marker were strongly amplified in these samples.
6.4. Amplification of rice marker in natural and adulterated honey
The rice_rrn26 marker was tested for amplification in syrup spiked honey and was positively amplified at all concentrations tested including the 1% spike. The sensitivity of this test is higher than other studies obtained with similar methods: 2-5% and ≥10% for rice and corn respectively Truong et al., 2022), which is likely due to the specific plastid markers used in our work. Low marker amplification was seen in the pure honey, but it is reasonable to expect that some rice DNA could be present in small amounts in natural honey due to bee foraging or leftover winter bee feed making its way into the honey. However, the observed background amplification in natural honey samples could also be due to non-specific binding of the marker, which could be reduced by exploring a TaqMan probe-based approach to amplification to increase marker specificity, if appropriate.
For this reason, we tested 17 different UK honey types to assess what background amplification of the rice_rrn26 marker could be expected in natural honey. These results were used to create a threshold where the sample is identified as adulterated or natural. This threshold was developed using the standardised Cq values obtained from applying a single threshold with baseline subtraction, to account for differences in instrument response between runs and allowing some comparability between the results. When the threshold was applied to the same honey types spiked with 5% rice syrup (R1), 100% of samples were classified correctly as adulterated, proving the success of the method for this type of rice syrup. However, this has not yet been tried with other types of rice syrup, as if the syrup itself displayed a low amplification of target DNA it may not pass the threshold, as it was the case of R7 where even the pure syrup would not be flagged as an adulterant based on the amplification of the rice_rrn26 marker. Additionally, the thresholds developed for this study were calculated using a small sample set of 17 honeys. So, further work may be needed to build up a database of reference honeys to generate a greater understanding of the expected background amplification. Therefore, the right threshold with appropriate control amplifications is vital to prevent natural honey being wrongly classified as adulterated. Additionally, the honey types tested in this study were premium honeys obtained from UK beekeepers, therefore not an accurate representation of the UK honey market – which consists mostly of imported honey blends. However, the honeys used in this study were an appropriate representation of the many different floral sources present in the UK over multiple seasons, therefore a good interpretation of potential non-specific amplification of the markers was permitted with the natural plant sources in UK honey. The described method would require further development, optimisation and validation to reach a standard which could be transferrable as a harmonised protocol. In addition, the method should next be tested on honeys from different countries, and honeys which are more representative of the UK honey market. Furthermore, samples should be taken from countries where rice has a major part in the agricultural system, to determine if the threshold developed in this study is suitable for non-UK honeys.
6.5. Commercial samples
The proposed qPCR method was tested on commercial samples of UK origin purchased from the UK market, the samples were marketed as English (CH1, CH4) or Scottish (CH2, CH3) and therefore were suitable for the test as developed for UK origin honeys. The DNA extraction method was suitable for 3 out of 4 of the selected commercial honey samples, with the three successful samples showing good amplification of the plant DNA marker. For one sample (CH1) there was no amplification of the plant marker used as a positive control, suggesting that the extraction protocol was not suitable for this honey. This sample was therefore not analysed for amplification of the rice marker. The rice marker was not amplified in any of the commercial honey samples, suggesting that no rice DNA was present in these honeys. Applying the method to commercial honey samples highlighted the importance of including the trnL P6 plant control marker to check the presence of plant DNA in the extract, to verify whether the negative amplification of the adulterant marker was truly negative or just due to an insufficient DNA extraction.
6.6. Combination with traditional methods
Typically, for honey authentication, a weight of evidence or evaluative reporting approach should be taken, given the known complexities of honey analysis (Walker et al., 2022b). This implies that a single atypical result should trigger further investigations, with multiple different analyses being used to add to the elements of evidence before a final decision about product non-compliance is made. For this reason, we used traditional sugar composition analysis (HPLC) alongside the DNA results. Of the pure honeys, only one sample (H11, heather honey) was flagged as non-compliant by HPLC for having a sugar (fructose + glucose) content of lower than 60 g/100g, which would trigger further analyses. However, this failure was marginal at only 0.36 g/100g under the limit when taking the CI into account. The DNA results for the rice marker in this sample was negative, providing contrasting evidence that the sample was not adulterated with rice syrup. In this case, the sample could be subjected to further tests to confirm the purity of the honey sample, as the dual analyses were not in agreement. The HPLC results for the commercial honey samples were compliant with legislation, which was in line with the DNA analysis suggesting that the samples were not suspicious of adulteration with rice syrup. The rice syrup spiked honey samples were all flagged as noncompliant for total fructose and glucose content using HPLC. This was further confirmed by the DNA results, showing amplification of the rice marker over the natural threshold in UK honey (Figure 8, Table 12). In addition, the maltose concentrations for the 10% spiked honey samples were elevated compared to the pure honeys, which could also be taken into account despite no official limits currently existing for maltose in honey. Hence, for the adulterated samples there would be a growing weight of evidence suggesting non-compliance by the outcomes from these two analyses. Furthermore, the DNA results could be used to determine the type of syrup added, which could assist in deciding which further tests to carry out, e.g. for presence of the AFGP rice marker. The proposed DNA method has great potential to be used alongside traditional honey analysis, modern analytical methodologies, and rapid spectroscopic screening tests as a highly sensitive method to identify the species origin of certain plant-based syrups and help confirm fraudulent practices.
6.7. Predictive Modelling for Honey Adulteration using SORS
In this proof-of-concept study we successfully employed through-container SORS measurements coupled with machine learning predictive modelling to achieve non-invasive detection of exogenous sugar adulteration in UK honeys. Different levels of adulteration, between 10- 50%, were employed to train various machine learning algorithms, including PLSDA, RF and XGBoost. The syrups used for adulteration were rice and sugar beet as thesesyrups are derived from C3 plants, which are not easily detected with existing methods. Thus, it is important to develop methods targeting these sources of exogenous sugars
The results revealed that SORS successfully differentiated honeys from plant-based syrups according to their spectral fingerprint. Moreover, the majority of honey samples had a similar biochemical profile, mainly characterised by the presence of fructose and glucose, with the exception of three honey types (heather, ivy, and buckwheat), which were positioned away from the main cluster of pure honeys in the PCA plot (Figure 9) This difference could be attributed to biochemical differences, as indicated by their colour differences and characteristic SORS signals. Indeed, the 14 honeys in the main cluster were all white—light—amber-coloured honeys, while the other 3 honeys (heather, ivy, and buckwheat) ranged between amber and a dark amber colour, resulting in higher intensity SORS signals as well as strong fluorescence interference (Figure A 1 (Appendices)).
Classification models built with the RF algorithm consistently outperformed alternative algorithms, exhibiting misclassification rates of 1.10% for pure honey misclassified as adulterated and 2.0% to 2.6% for adulterated honey misclassified as pure (hard misclassifications). The total misclassification rates ranged from 13.6% to 15.9%. Conversely, XGBoost displayed higher misclassification rates, ranging from 7.7% to 9.9% for pure honey and an overall misclassification rate of approximately 23.9% to 31%. The utilization of XGBoost was motivated by its ability to provide probability-based results for each adulteration class (refer to example in Table A2). However, its performance was less than that of RF despite both being decision tree-based ensemble algorithms. A defining difference was the fact that XGBoost employs regularisation to avoid weight overinflation to reduce the risk of overfitting. Indeed, the final XGBoost models following the training and optimisation process only contained 79 features out of the 670 original features. RF in contrast builds hundreds of trees using different combinations of training samples and features for each of the trees, therefore minimising the risk of overfitting without eliminating features. In fact, our efforts to reduce the feature space prior to performing RF model training were less successful compared to employing the whole feature space as described in Section 5.5.4, possibly indicating the presence of complex interactions between features in the SORS spectra. Other studies on honey authenticity have compared the performance of several machine learning algorithms, with both RF and XGBoost reaching similar performances. XGBoost exhibited 90% accuracy in discriminating between monofloral Spanish honeys of different botanical origins based on honey physicochemical parameters as compared to 83% accuracy for RF (Mateo et al., 2021). In another study employing hyperspectral imaging to study adulteration detection in Pakistani honeys, RF had superior performance in identifying both the botanical origin and adulteration level, reaching a maximum prediction accuracy of 99.69%, while XGBoost attained similar levels of performance (Shafiee et al., 2016).
In addition to its increased performance, another advantage of using RF was that it provides a variable importance matrix ranking the features in order of their impact in the model’s prediction accuracy. The wavelengths of highest importance for the different rice syrup models ranged between 860 to 890 cm-1 and 920 to 950 cm-1. These wavelengths correspond to two peaks characteristic of maltose which were also present in rice-syrup showing that the algorithm correctly identified maltose as the sugar responsible for differentiating between natural honey and honey adulterated with rice syrup. Hu et al. (2022) have also identified two Raman peaks at 865 and 915 cm-1 among the most important features for identification of maltose syrup adulteration of native Suichang Chinese honey which indicate the presence of C-H and C-H and C-OH bond bending vibrations. The regression models for rice syrup adulteration also showed that the wavenumbers around 865 cm−1 contributed more than 50% to the prediction of adulteration level (Figure A 9 (Appendices))
The bands responsible for the prediction accuracy of the RF sugar beet models, ranged between 700 to 850 cm-1. The band around 706 cm-1 has been previously associated with C-O stretching and C-C-C-O and O-C-O bending vibrations of glucose (Aykas et al., 2020). The area around 830 cm-1 also coincided with a dominant peak in the sucrose SORS spectrum and is in agreement with previous observations by Mosca et al. (2023). The SORS results were further validated by HPLC analysis which revealed distinctive sugar profiles for rice and sugar beet syrups, with the rice syrup predominantly consisting of glucose and maltose, while the sugar beet syrup predominantly contained sucrose, glucose and fructose.
RF was further used to develop a classification model with the aim of discerning the type of sugar syrup used for adulteration, as well as predicting the level of adulteration. This model also exhibited high success rate with only 1.10% of pure samples misclassified as adulterated and 3.64% of adulterated samples misclassified as pure. In addition, it had only 2.2% to 4.9% misclassification in the type of syrup. The fact that this model was able to also identify the type of adulteration successfully was of high importance, as it showcases that SORS accurately captures differences in chemical composition between different syrup types and honeys. Figure A 9 (Appendices) shows the most important variables enabling the predictive models to detect the type and percentage of adulteration. The bands with the highest importance range between 700 and 950 cm-1, which encompasses the important variables previously identified for the individual rice and sugar beet classification models. In addition, a band around 1127 cm−1 has previously been suggested to be arising from a combination of stretching vibration of C-O bond (major) and vibration of C-N bond of protein and amino acids (minor), while the band around 1264 cm−1 has been associated with the vibration of C(6)-OH and C(1)-OH bonds (S. Li et al., 2012).
While previous studies have shown promising results of employing Raman spectroscopy to identify honey adulteration with sugar syrups, they are not able to specify the type of sugar syrup used for adulteration (Mosca et al., 2023) and in some cases they show poor performance compared to individual models (S. Li et al., 2012). In contrast, the SORS methodology exhibited high discriminatory capacity with potential applications in testing unknown honey samples in non-controlled commercial setting where the type of adulterant would be unknown.
Similar to the results observed for classification purposes, the regression models employing RF regression methods demonstrated very low RMSE values, around 3.7, for both rice and sugar beet syrups, with SDs of 1.67 and 1.09, respectively. These results demonstrate the efficacy of these models in predicting adulteration levels and adding a valuable quantitative dimension to the study.
Finally, as shown in the present study the majority of pure honey types in the UK had a similar metabolic fingerprint which allowed us to group them together in a single model. Additionally, individual models could be constructed in the future to characterise more diverse types of honey with unique fingerprints, such as heather, ivy and buckwheat.
This study emphasises the potential of SORS and machine learning as a cost-effective and rapid method for honey authentication. Deployment of SORS in the field and through-container analysis offers practical applications for adulteration detection and quality monitoring in the honey supply chain. Future research is recommended to refine models, reduce misclassifications, and broaden the study to encompass a diverse range of commercial honey types.
Furthermore, the two orthogonal methodologies proposed in the study can be used in conjunction in the future, with SORS employed as rapid screening method at various stages in the supply chain and suspicious samples can be further tested with the PCR-based DNA barcoding method described earlier. In addition, SORS exhibited quantitative potential showing that the proposed new methodology could be used both for qualitative analysis to detect the presence/absence of adulterant but also to quantify the percentage of adulteration. This approach could be further extended to imported honeys, which constitute the majority of honey available in the UK market (García, 2018), by constructing databases with commercially relevant samples.
In conclusion, the results of this study demonstrate the potential of SORS and DNA barcoding methods to be applied for the authentication of UK honey samples and adulteration detection. The combination of the above techniques could result in a highly accurate and fast method for honey quality control deployable in field. This will support the local beekeeping sector and provide importers and policymakers with an important tool for tackling fraud in the honey industry. Furthermore, it could alleviate consumer concerns around the purity and authenticity of honey products on the market and provide assurance of honey quality and purity.
7. Acknowledgements
We wish to express our thanks to the STFC Food Network+ and the FSA for funding this work and their continuous support throughout the project. Our special thanks go to Bhavna Parmar and David Franklin from the FSA for their guidance and invaluable contribution to this work. Finally, we would like to extend our gratitude to the Bee Farmers Association (BFA) for their cooperation and help with the sample collection.
This report has been produced by Cranfield University under a contract placed by the Food Standards Agency (the Agency). The views expressed herein are not necessarily those of the Agency. Cranfield University warrants that all reasonable skill and care has been used in preparing this report. Notwithstanding this warranty, Cranfield University shall not be under any liability for loss of profit, business, revenues or any special indirect or consequential damage of any nature whatsoever or loss of anticipated saving or for any increased costs sustained by the client or his or her servants or agents arising in any way whether directly or indirectly as a result of reliance on this report or of any error or defect in this report.
FS900185