


1. Executive summary
Key findings at a glance
- A total of 611 interviews were completed between 16th September and 23rd November 2024 using Computer Assisted Personal Interviewing (CAPI). Quotas were set on gender, age, socio-economic group and region.
- Women (26%) have greater knowledge of their recommended daily calorie intake than men (13%), however, general awareness remains low among all consumers. The primary source of nutritional information for consumers is nutritional claims on the back of packaging (35%), however, 33% still disregard this information while shopping.
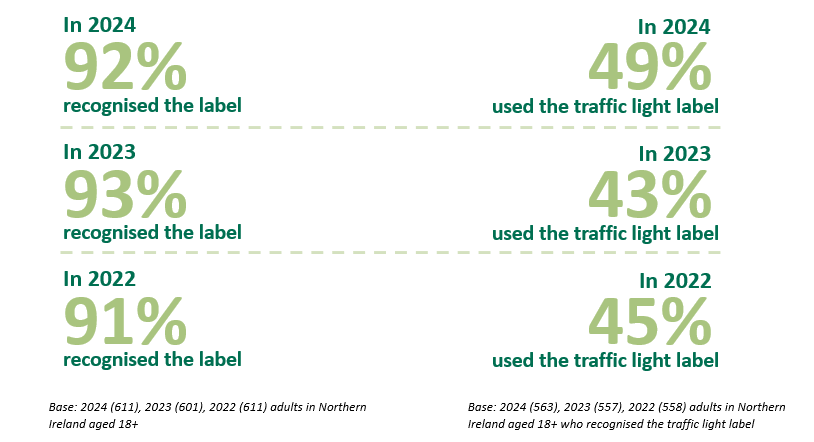
- Traffic light labelling is recognised by the majority of consumers (92%), but approximately half (49%) actively use the system when shopping for food. The main use of traffic light labelling includes assessing sugar, salt, and fat content in products, which is closely followed by checking calories and saturated fat content in products.
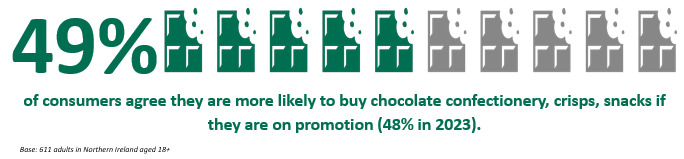
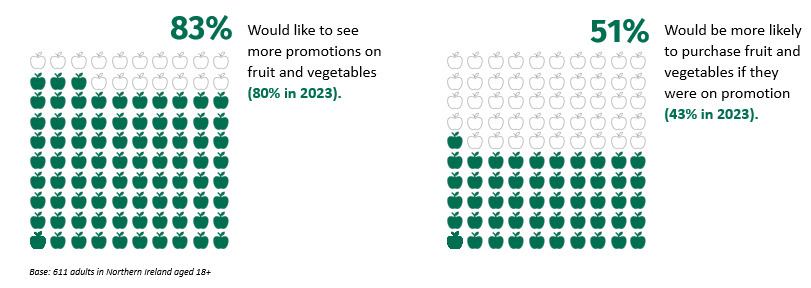
- Promotions continue to influence consumer purchasing behaviours, with around half (49%) more likely to buy chocolate confectionery, crisps and snacks if they are on promotion. The majority of consumers (83%) would like to see more promotions on fruit and vegetables, but only half (51%) say they would purchase them if they were on promotion.
- Consumers report difficulty choosing healthier food when eating out in locations such as takeaways (76%), fast-food restaurants (69%) and places of leisure such as cinemas (63%). More consumers (40%) report difficultly choosing healthier options in vending machines than last year (29%).
Key trends
- Although supermarkets continue to be the dominant location where consumers buy their food, independent stores and greengrocers continue to rise in popularity as an option for food shopping.
- In line with previous years, consumers find it more difficult to purchase healthier foods when eating out than when shopping in supermarkets.
- Use of the traffic light labelling system remains high for consumers, however the frequency of consumers using the system has steadily decreased since 2022.
- Similarly, there has been a decrease in consumers using this label when food shopping for their children compared to previous years.
- Consumers are more likely to purchase items that have reduced sugar, salt and fat than a reduction in portion size.
- Consumers have become less likely to say that they would like to see healthier options in various food settings compared to previous years.
- There has been a consistent decrease across recent years in the likelihood of consumers purchasing reformulated food alternatives with lower sugar, salt and fat.
Key demographic findings
Gender
- Women were more likely to recognise traffic light labels on foods compared to men (95% vs 89%) and were more likely to use them while shopping for food (53% vs 44%).
- Men were more likely to claim they did not want to see healthier products in food locations (37%), such as takeaways, restaurants etc, compared to women (28%).
Socio-economic background
- Lower socio-economic groups are more likely to agree that promotions on fruit and vegetables would motivate them to purchase these products (54%) compared to those from higher socio-economic groups (46%). However, higher socio-economic groups are more likely to report they would like to see more promotions on these products than those in a lower socio-economic group (87% vs 80%).
Age
- Consumers aged between 35-54 are more likely to do their food shopping at supermarkets (93% including online deliveries) compared to consumers aged 18-34 and 55+ (78% each).
- Consumers aged 18-34 (62%) and 35-54 (58%) are more likely to report they would not try to choose a healthier option when eating out compared to adults aged 55+ (43%).
2. Background
This report presents the findings from the Food Standards Agency’s (FSA) 2024 Making Food Better (MFB) consumer tracker survey in Northern Ireland (NI). The FSA rebranded its Eating Well Choosing Better (EWCB) programme to MFB in 2023, however, the MFB consumer tracker is regarded as a continuation of the EWCB survey.
The survey collects and monitors robust data over time to support the delivery of the FSA’s Making Food Better Programme in NI.
3. Methodology
- All surveys were completed using Computer Assisted Personal Interviewing (CAPI) with adults in NI.
- A total of 611 interviews were completed between 16th September and 23rd November 2024.
- To ensure representation of the NI population, quota sampling was adopted. Quotas on gender, age, socio-economic group and region were derived from the latest Census 2021 population statistics (Census Office for Northern Ireland, 2021). In 2022, quotas were derived from the 2011 Census statistics.
- Corrective weighting was applied to the 2022, 2023 and 2024 data to adjust for imbalances in the sample demographic characteristic.
4. Results
Women have greater knowledge of their recommended daily calorie intake than men, whose awareness has fallen over time
26% of women correctly identified the recommended daily calorie intake for their gender. 25% of women answered this same question correctly in 2023 and 28% answered it correctly in 2022.
13% of men correctly identified the recommended daily calorie intake for their gender. 15% of men answered this same question correctly in 2023 and 18% answered it correctly in 2022.
The majority of consumers choose healthier foods while shopping, however, more than half do not make healthier choices when eating out
When shopping for food, 67% of consumers agreed they try to choose healthier versions of products. However, 16% disagreed.
When eating out, 25% of consumers agreed they try to choose a healthier option from the menu. However, 53% disagreed.
When eating out, 36% of consumers agreed they would like to see more healthier options on the menu. However, 24% disagreed.
Most consumers shop for food in store at a supermarket – but independent stores are growing in popularity
Most consumers in NI continue to favour supermarkets as their primary food shopping source (79%), which remains at a similar level to 2023 (80%).
Whilst local / corner shops, newsagents, garage forecourt remain in second place (58%), there is a clear positive trend for usage of independent greengrocers, butchers, bakers or fishmongers (44%) in the past three years.
Online supermarket usage increased from 12% in 2023 to 14% in 2024 and usage of market/farmer’s market/farm shops remained at a similar level in 2024 (8%) compared to 2023 (7%). Usage of home delivery, not from a supermarket, remained the same level at 2% between 2023 and 2024.
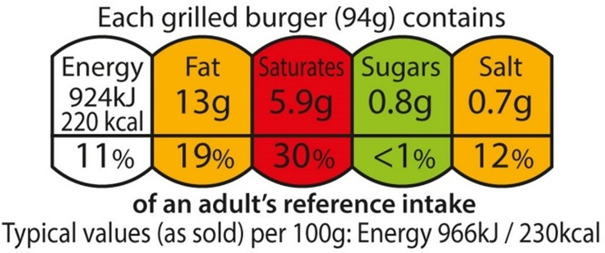
When shopping in store, consumers use a variety of information on packaging to find out the nutritional content of food
In 2023, nutritional claims on packets were the leading source of nutritional information of products cited by nearly a third (32%) of consumers, however in 2024 nutritional labelling on the back-of-pack became the primary source (35%), which is a ten-percentage point rise from its 2023 level (25%).
Consumers often check food labels for information on calories and nutrients content such as fat and sugar, typically presented in a table format.
Meanwhile, a third (33%) claim they do not look at this information on products when shopping in store, representing a decrease from the 41% reported in 2023.
Although nine in ten consumers recognise the traffic light label, only around half use it when food shopping

Consumers are most likely to use the traffic light label to understand the sugar content of products – though they are less likely to do this than in last year. In 2024:
- 56% of consumers used the traffic light label to understand the amount of sugar in products. This decreased from 65% in 2023.
- 51% of consumers used the traffic light label to understand the amount of salt in products. This remained the same as 2023.
- 49% of consumers used the traffic light label to understand the amount of fat in products. This increased from 47% in 2023.
- 46% of consumers used the traffic light label to understand the amount of calories in products. This increased from 43% in 2023.
- 46% of consumers used the traffic light label to understand the amount of saturated fat in products. This increased from 39% in 2023.
Consumer purchasing of chocolate confectionery, crisps and snacks is still influenced by promotions
Over eight in ten consumers want to see promotions on fruit and vegetables, but only half would be more likely to actually purchase these foods if they were on promotion
Consumers still find it more challenging to choose healthier food when eating out compared to shopping in supermarkets
In line with previous findings, choosing to eat healthier meals when eating out is a challenge for consumers. In 2024, consumers find it most difficult to make healthy choices when eating at:
- Takeaways (76%);
- Fast-food restaurants (69%); and,
- Places of leisure e.g. cinemas (63%).
Compared to previous findings, there has been an increase in the number of consumers who report finding it difficult to choose healthier food in vending machines (40% in 2024 vs 29% in 2023).
Awareness of calories on menus has increased over time
Between 2023 and 2024, consumer awareness of calorie information on menus has generally increased across various settings. 61% are aware overall in 2024 versus 50% in 2023.
Fast food restaurants and traditional restaurants/pubs consistently show the highest levels of consumer awareness regarding calories on menus. The most significant rise in awareness is for cafes and sandwich shops, with a quarter (25%) in 2024 stating they have noticed calories on menus.
Around half of consumers in 2023 did not notice calorie information on menus in any food settings. This has decreased to 39% in 2024, an 11-percentage point drop compared to 2023.
Consumers have become less likely to say they wish to see healthier products in various settings. In 2024:
-
26% of consumers would like to see healthier products in fast food restaurants (31% in 2023).
-
24% of consumers would like to see healthier products in takeaways (33% in 2023).
-
18% of consumers would like to see healthier products in restaurants and/or pubs (20% in 2023).
-
15% of consumers would like to see healthier products in cafes/sandwich shops (19% in 2023).
-
14% of consumers would like to see healthier products in food outlets in leisure facilities (24% in 2023).
-
14% of consumers would like to see healthier products in local/corner shop, newsagents or garage forecourts (18% in 2023).
-
14% of consumers would like to see healthier products in supermarkets (16% in 2023).
-
11% of consumers would like to see healthier products in vending machines (13% in 2023).
-
7% of consumers would like to see healthier products at staff restaurants at work (9% in 2023).
-
33% of consumers reported they would not like to see healthier products in any of the above locations (31% in 2023).
Takeaways, fast food restaurants and food outlets in leisure facilities saw the most significant drops, whereas supermarkets remained relatively stable. In 2024, around a quarter of consumers would like to see healthier products in takeaways (24%) and fast-food restaurants (26%).
As consumers often choose traditional, less healthy options at takeaways because they accept these foods as indulgent or convenient, presence of healthier alternatives may not change behaviour. This highlights a consumer segment where preferences are shaped more by context than health.
Consumers are more likely to purchase products with reduced sugar, salt and/or saturated fat than products with smaller portion sizes
Likelihood of purchasing reformulated products or smaller portion sizes:
-
Reduced sugar products - 54% are more likely to purchase and 10% are less likely to purchase.
-
Reduced salt products – 48% are more likely to purchase and 9% are less likely to purchase.
-
Reduced saturated fat products - 44% are more likely to purchase and 8% are less likely to purchase.
-
Smaller portion sizes of sugary snacks/ meals - 36% are more likely to purchase and 16% are less likely to purchase.
-
Smaller portion sizes of snacks/ meals high in salt - 34% are more likely to purchase and 17% are less likely to purchase.
-
Smaller portion sizes of snacks/ meals high in saturated fat - 33% are more likely to purchase and 18% are less likely to purchase.
-
Products with a maximum limit on calories - 20% are more likely to purchase and 14% are less likely to purchase.
4.1. Sub-group analysis
Gender
- More women (76%) than men (58%) claimed to choose healthier food options while food shopping.
- Although women and men claimed to pay attention to the healthier options on the menu equally (26% and 24%, respectively), women (41%) were more likely than men (31%) to say they would like to see healthier options on menus.
- Women were more likely to check nutritional claims (30%) and check the nutritional information on the back of packaging (40%) than men (23% and 31% respectively). More men (40%) also claimed they do not use packaging to seek out nutritional information for food they purchase, compared to women (27%).
- Women (95%) were more likely than men (89%) to recognise the traffic light label on food products. They were also more likely to use the label when shopping for food (53% for women vs 44% for men). Women were more likely than men to purchase reformulated versions of products with reduced sugar (61% vs 46%), reduced saturated fats (51% vs 38%), and reduced salt (52% vs 44%).
- Men (43%) were more likely to report not wanting to see reformulated food options or smaller portion sizes compared to women (29%).
Age
- More consumers aged 35-54 (93%) reported shopping for food in a supermarket (including online) compared to consumers aged 18-34 and 55+(both 78%). Consumers aged 55 and over (53%) were more likely to shop in independent greengrocers and butchers than younger consumers (35% of those aged 18-34, and 42% of those aged 35-54).
- Those aged between 18-34 (96%) and 35-54 (97%) were more likely to recognise the traffic light label compared to those aged 55 and over (85%). However, adults aged 35-54 appeared to show a better understanding of the traffic light label (92%) compared to younger adults under 35 (84%) and older adults 55 and over (83%). Adults aged 35-54 (90%) and those 55 and over (89%) found it easier to make healthy food choices when preparing meals at home compared to younger consumers aged 18-34 (77%).
- Consumers aged 18-34 (85%) and 35-54 (83%) found it more difficult to choose healthier options from takeaways compared to older consumers aged 55 and over (64%). This was also true when choosing in fast food restaurants (82%, 79% vs. 51%) and food outlets in leisure facilities (74%, 72% vs. 47%). However, more adults aged 18-34 (62%) and 35-54 (58%) reported they would not try and choose a healthier option when eating out compared to adults aged 55+ (43%).
Socio-economic group
- Those from higher socio-economic groups (74%) were more likely to agree their eating habits were healthy compared to those from lower socio-economic groups (56%). More consumers from lower socio-economic groups (40%) claimed they do not use nutritional information on packaging to seek out nutritional information for food they purchase, compared to those from higher socio-economic groups (25%).
- Consumers from lower socioeconomic groups (41%) were less likely to use traffic light labels while food shopping than those from higher socioeconomic groups (58%). Consumers from higher socioeconomic groups also reported better understanding of these labels compared to those from lower socio-economic groups (93% vs. 81%). Those from higher socio-economic groups were more likely to check calories (53% vs. 38%), fats (55% vs. 42%), and saturated fats (52% vs. 39%) when shopping for themselves compared to consumers from lower socio-economic groups.
- Those from higher socio-economic groups (87%) were more likely to express interest in seeing more promotions on fruits and vegetables compared to those from lower socio-economic groups (80%). However, the lower socio-economic group (54%) would be more likely to purchase these products on promotion than the higher socio-economic group (46%).
5. Conclusions
- Knowledge around daily calorie requirements is low across consumers, particularly men. Additional consumer education and awareness campaigns may be useful to increase this knowledge, particularly in settings where the majority of consumers do their shopping, such as in-store at supermarkets. Other locations which showed an increase in shopping activity, such as local/corner shops, could also be examined.
- While general awareness of the traffic light labelling system is high, only half of consumers report using it when making food purchases. Men from lower socio-economic groups are least likely to use this system and are also more likely to disregard nutritional information on product packaging. Efforts could be made to educate consumers on how to use traffic light labels to identify and select healthier options, particularly to those consumers who are least likely to use and understand the traffic light labelling system.
- Consumers across different socio-economic groups show interest in fruit and vegetable promotions, however their behaviours appear to differ. While a larger proportion of the higher socioeconomic group express interest in seeing more promotions, the lower socioeconomic group are more likely to purchase these products if promotions are offered. This difference suggests price sensitivity is a stronger motivator for those from lower socio-economic groups. Therefore, effective promotional strategies could consider these distinct motivations and barriers faced by different groups of consumers.
- Despite a growing consumer interest in healthier eating, accessing more nutritious options when eating out remains a challenge. Restaurants and other settings could prioritise healthier options and communicate effectively these offerings. This could be achieved by offering more nutritious options on menus and clearly labelling menus with nutritional information.
Appendices
Appendix 1 – Survey questionnaire
In the last 12 months, who is typically responsible for the food shopping for your household? (Please include both online and in store food shopping)
- I am responsible for all or most of the food shopping
- I share the responsibility with someone else
- Someone else in my household
- Someone else outside of my household e.g. a relative or carer
- Each person is responsible for their own food shopping
- Don’t know
Which of the following best describes your gender?
- Man
- Woman
- Non-binary
- My gender is not listed
- Refused/Prefer not to say
What is your age?
Can you confirm your postcode?
Which of these regions best describes where you live?
- Belfast city
- Greater Belfast
- Co. Down
- Co. Armagh
- Co. Tyrone / Co. Fermanagh
- Co. Derry
- Co. Antrim
- None of these
Which of these best describes the area you live in?
- A village
- A small town in the countryside
- A medium town
- A large town
- Inner city
- Outer city (Suburban)
Please indicate to which occupational group the Chief Income Earner in your household belongs, or which group fits best.
The Chief Income Earner is the person in your household with the largest income, including you. If the Chief Income Earner is retired but still has the largest income via an occupational pension, please answer for their most recent occupation. If the Chief Income Earner is not in paid employment but has been out of work for less than 6 months, please answer for their most recent occupation.
- Self Employed / Business Owner
- Skilled manual worker (e.g. Skilled Bricklayer, Carpenter, Plumber, Painter, Bus/ Ambulance Driver, HGV driver, AA patrolman, pub/bar worker, etc.)
- Semi or unskilled manual work (e.g. Manual workers, all apprentices to be skilled trades, Caretaker, Park keeper, non-HGV driver, shop assistant)
- Supervisory or clerical/junior managerial/professional/ administrative (e.g. Office worker, Student Doctor, Police Constable, Firefighter, Foreman with 25+ employees, salesperson, etc.)
- Intermediate managerial/professional/administrative (e.g. Newly qualified (under 3 years) doctor, Solicitor, Board director small organisation, middle manager in large organisation, teacher, principal officer in civil service / local government, military lieutenant)
- Higher managerial/professional/administrative (e.g. Established doctor, Solicitor, Architect, Board Director in a large organisation (200+ employees), head teacher, police/fire chief, top level civil servant / public service employee, high ranking military officer)
- Casual worker – not in permanent employment
- Student
- Housewife / Homemaker
- Retired and living on state pension
- Unemployed or not working due to long-term sickness
- Full-time carer of other household member
Do you have any children aged under 16 living at home currently?
- Yes
- No
How old are your children?
- 0-3
- 4-6
- 7-10
- 1-13
- 14-16
We would like you to take a moment to think about healthy eating.
What does healthy eating mean to you?
Here is a picture of the Eatwell Guide which shows how much of what we eat overall should come from each food group to achieve a healthy, balanced diet.
On a scale of 1-5 where 1 is strongly disagree and 5 is strongly agree…
Based on the image of the Eatwell Guide, which represents a healthy, balanced diet, to what extent would you agree or disagree that your personal eating habits are healthy?
- Strongly disagree
- Tend to disagree
- Neither agree nor disagree
- Tend to agree
- Strongly agree
- Don’t know
Based on the image of the Eatwell Guide, which represents a healthy, balanced diet, to what extent would you agree or disagree that your child/children’s eating habits are healthy?
- Strongly disagree
- Tend to disagree
- Neither agree nor disagree
- Tend to agree
- Strongly agree
- Don’t know
To what extent do you agree or disagree with the following statements?
When shopping for food, I try to choose healthier versions of products e.g. low in fat, high in fibre.
When eating out, I try to choose a healthier option from the menu e.g. lower calorie option, dish with a higher vegetable content etc.
When eating out, I would like to see more healthier options on the menu e.g. lower calorie options, dishes with a higher vegetable content etc.
- Strongly disagree
- Tend to disagree
- Neither agree nor disagree
- Tend to agree
- Strongly agree
- Don’t know
What do you think the Government recommended daily calorie intake is for men? If you think you know but aren’t sure, please let us know what you think it is.
What do you think the Government recommended daily calorie intake is for women? If you think you know but aren’t sure, please let us know what you think it is.
In a typical month, where do you shop for food?
- Supermarket in-store (including mini supermarkets e.g. Metro/local)
- Online delivery from a supermarket (including home delivery and click and collect
- Home delivery not from a supermarket (e.g. vegetable boxes, Deliveroo, Hello Fresh)
- Local/corner shop, newsagents or garage forecourt
- Independent greengrocer, butcher, baker or fishmonger
- Market/farmers’ market/farm shop
- Other (please specify)
- None of these
How, if at all, do you tend to find out how much calories, saturated fat, sugar or salt are in a product when food shopping in store?
- Look at nutrition claims e.g. low fat, low sugar, high fibre
- Look at the nutritional labelling on the front of the packet e.g. traffic light labelling
- Use the nutritional labelling on the back of the packet
- Other (please specify)
- I don’t try to find this out
How, if at all, do you tend to find out how much calories, saturated fat, sugar or salt are in a product when food shopping online?
- Look at nutrition claims e.g. low fat, low sugar, high fibre
- Look at the nutritional labelling on the front of the packet e.g. traffic light labelling
- Use the nutritional labelling on the back of the packet
- Other (please specify)
- I don’t try to find this out
Thinking about when you are choosing food whilst shopping, some foods show traffic light labels on the front of packets/packaging
Here is an example image of the traffic light label.
Do you recognise this traffic light image?
- Yes
- No
Do you use it when shopping for food?
- Yes
- No
On a scale of 1-5 where 1 is strongly disagree and 5 is strongly agree… To what extent would you agree or disagree with the following statement:
I understand what traffic light labels on the front of food packaging are for.
- Strongly disagree
- Tend to disagree
- Neither agree nor disagree
- Tend to agree
- Strongly agree
- Don’t know
What do you think these traffic light labels are for?
How often, if at all, do you choose ….?
- Foods with ‘healthier’ traffic light colours (green/amber)
- Foods with a lower percentage of my recommended daily calorie intake
- Never
- Rarely
- Every now and then
- Most times
- Always
- Don’t know
Which, if any, of these do you do when buying food for yourself?
Which, if any, of these do you do when buying food for your child/children?
- I look at the calories next to the traffic light label
- I use the traffic light label to understand the amount of Fat in products
- I use the traffic light label to understand the amount of Saturated fat in products
- I use the traffic light label to understand the amount of Sugar in products
- I use the traffic light label to understand the amount of Salt in products
- I use the traffic light label to find information on portion size
- I don’t do any of these
We would now like you to think about promotions on food, such as money off or reduced price offers or offers like buy one get one free.
To what extent would you agree or disagree with the following statements on promotions:
- I am more likely to purchase fruit and vegetables if they are on promotion.
- I am more likely to purchase chocolate confectionery, crisps, snacks etc. if they are on promotion.
- I would like to see more promotions on fruit and vegetables
- Strongly disagree
- Tend to disagree
- Neither agree nor disagree
- Tend to agree
- Strongly agree
- Don’t know
Overall, for each of the following, how easy or difficult is it for you to choose healthier food and meals?
- When buying from a supermarket in-store
- When buying from a supermarket online
- When buying from a local/corner shop, newsagent or garage forecourt
- When eating in restaurants and/or pubs
- When eating in my staff restaurant at work
- When preparing meals at home
- When buying food from a vending machine
- When buying from cafés/sandwich shop e.g. supermarket cafés/high street coffee shops
- When buying from a take-away
- When buying from/eating in a fast food restaurant
- Food outlet in leisure facilities e.g. cinemas, bowling alleys, entertainment centres
- Very difficult
- Quite difficult
- Quite easy
- Very easy
- Not applicable
Where, if in any setting, would you like to see healthier products?
- Supermarkets
- Local/ corner shop, newsagents or garage forecourts
- Restaurants and/or pubs
- Staff restaurant at work
- Vending machines
- Cafés/Sandwich shops e.g. supermarket cafés/high street coffee shops
- Fast food restaurants
- Takeaways
- Food outlets in leisure facilities e.g. cinemas, bowling alleys, entertainment centres
- Other (please specify
- None of these
Have you ever noticed calories being shown on a food menu in any of these places?
- Restaurants/pubs
- Staff restaurant at work
- Cafés/Sandwich shops e.g. supermarket cafés/high street coffee shops
- Fast food restaurant
- Takeaways
- Food outlets in leisure facilities e.g. cinemas, bowling alleys, entertainment centres
- Other (please specify)
- None of these
How often, if at all, do calories shown on a food menu influence your decision of what to eat in?
- In restaurants/pubs
- Staff restaurant at work
- In cafés/Sandwich shops e.g. supermarket cafés/high street coffee shops
- In fast food restaurant
- In takeaways
- Food outlets in leisure facilities e.g. cinemas, bowling alleys, entertainment centres
- It never influences my decision
- Not very often
- Every now & then
- Most times
- It always influences my decision
In what venues, if any, would you like to see calories being shown on a food menu?
- Restaurants/pubs
- Staff restaurant at work
- Cafés / Sandwich shops e.g. supermarket cafés/high street coffee shops
- Fast food restaurant
- Takeaways
- Food outlets in leisure facilities e.g. cinemas, bowling alleys, entertainment centres
- Other (please specify)
- None of these
- Don’t know
Thinking about when you are shopping for/choosing food products, in particular manufactured products such as sauces, cereals, meals, snacks and puddings…
How likely or unlikely are you to buy these options compared to a regular version of products? (e.g. for sauces, cereals, meals, snacks & puddings)
- Reduced sugar products
- Reduced saturated fat products
- Reduced salt products
- Products with a maximum limit on calories (e.g. chocolate bars, sweets, slices of cake, croissants, biscuits)
- Smaller portion sizes of sugary snacks/meals
- Smaller portion sizes of snacks/meals high in saturated fat
- Smaller portion sizes of snacks/meals high in salt
- Much less likely to buy it
- A little less likely to buy it
- It wouldn’t change
- A little more likely to buy it
- Much more likely to buy it
Which, if any, would you like to see more of when you buy food?
- Reduced sugar products
- Reduced saturated fat products
- Reduced salt products
- Products with a maximum limit on calories (e.g. chocolate bars, sweets, slices of cake, croissants, biscuits)
- Smaller portion sizes of sugary snacks/meals
- Smaller portion sizes of snacks / meals high in saturated fat
- Smaller portion sizes of snacks / meals high in salt
- None of these
Please select the range which best describes your annual household income?
If you’re not sure, your best guess is fine.
-
Under £10,000
-
£10,000-£19,999
-
£20,000-£29,999
-
£30,000-£39,999
-
£40,000-£49,999
-
£50,000-£59,999
-
£60,000-£69,999
-
£70,000-£79,999
-
£80,000-£89,999
-
£90,000-£99,999
-
£100,000+
-
Not sure / Don’t know
-
Would rather not say