


1. Lay Summary
Using data generated by the third intestinal infectious disease survey (IID3), the FSA aims to estimate the current number of cases, general practice presentations, and hospitalisations caused by the foodborne transmission of selected pathogens in the UK. To calculate this, estimates of the percentage of disease attributable to foods for each pathogen are needed. Here a systematic literature review was conducted to provide foodborne disease attribution estimates based on previously published studies for four pathogens the FSA has an interest in. This project pilots the review methodology and makes recommendations to the continuation of this work for the remaining pathogens within IID3.
The pathogens reviewed include enteropathogenic Escherichia coli (EPEC) and sapovirus (both included within the IID3 study), hepatitis A virus (HAV), and Toxoplasma gondii. Search results from the SCOPUS, PubMed, and ScienceDirect databases were retrieved and stored in individual libraries for each of the pathogens under study. Articles were screened for inclusion based on whether they contained data on the percentage of disease attributable to individual transmission pathways, and were published after 2012, in English.
In total, 13 studies were included. These suggested the percentage of total disease attributable to foods for EPEC was 64%. For HAV this ranged from 10% to 42%, sapovirus from 13% to 16.3% and T. gondii, from 28% to 61%. Some studies contained data apportioning foodborne disease to individual food groups. These suggested that fresh produce was the most common foodborne transmission pathway for HAV, with estimates ranging from 45% to 95.4%, and for sapovirus, 58.3%. Meanwhile, pork was suggested as a more impactful transmission pathway for T. gondii, ranging from 20% to 41% of transmission.
High variability was observed in the results reported by different studies, which may stem from variations in study design, the types of data used, or the geographic regions or time periods investigated. Nevertheless, these estimates are useful for the FSA to calculate the burden of foodborne infectious intestinal disease in the UK.
2. Executive Summary
In 2021, the Foods Standards Agency (FSA) commissioned the third investigation of intestinal infectious disease in the UK (IID3), aiming to estimate the burden of intestinal infectious disease within the UK. This includes estimates for the number of community cases, general practice presentations, and hospitalisations in the UK from September 2023 to August 2025 for selected pathogens. The data generated from this study will be used to estimate the current burden of foodborne disease in the UK. To do this, estimates of the proportion of disease attributable to foodborne transmission is needed. Source attribution estimates may be derived in a number of ways, including from expert elicitation, outbreak surveillance, or case-control data. To compile source attribution estimates for pathogens within IID3, as well as for other pathogens the FSA has an interest in, a systematic review of the literature was undertaken, updating previous estimates from before 2012. In this report, the systematic review approach was piloted for four pathogens: two from IID3 (sapovirus and enteropathogenic Escherichia coli (EPEC), and two further pathogens (Toxoplasma gondii and hepatitis A virus). These pathogens were selected based on time constraints and to incorporate data on both IID and non-IID causing pathogens. Additionally, recommendations were made regarding the continuation of this work for the remaining pathogens under investigation in IID3.
Search results from the SCOPUS, PubMed, and ScienceDirect databases were collated into pathogen specific reference libraries. These were deduplicated and screened to remove irrelevant references. Eligible texts included any articles published since 2012 in English that contained estimates for the attribution of disease to specific transmission pathways for the four pathogens included. Studies from the UK, Europe, North America, Australia, New Zealand and Japan were included. Data was extracted from eligible studies using a standardised template.
Literature search and screening against eligibility criteria yielded seven studies for T. gondii, nine studies for HAV, one study for EPEC, and five studies for sapovirus containing relevant source attribution data. EPEC was found to have the highest food attributable portion at 64% followed by T. gondii (results ranged from 28% to 61%), HAV (10% to 42%) and sapovirus (13% to 16%). As only one study was recovered for EPEC, results for grouped diarrheagenic E. coli (DEC) pathotypes, not including Shiga toxin-producing E. coli were also included. These suggested between 25% and 55% of DEC disease could be attributed to foods.
Studies apportioning foodborne disease to specific food groups suggested produce was the main transport pathway for HAV and sapovirus, with HAV results ranging from 45% to 95.4% and sapovirus results at 53.8% of foodborne disease. On average, transmission via pork comprised the majority of foodborne transmission for T. gondii, representing between 20% and 41% of foodborne disease across the studies identified here. No commodity specific attributions were available for EPEC or grouped DEC.
High variability in T. gondii and HAV results was observed, as well as variation compared to previous pre-2011 estimates for sapovirus and HAV. This may be due to methodological differences, especially where studies have used different data sources to estimate the attribution of disease. Similarly, variation may stem from regional and temporal differences between the studies identified.
Based on the review results presented here, the following key recommendations are made concerning the continuation of this project:
-
The search strategy used here has been kept broad in scope. However, adapting this to include method specific key words may reduce the number of irrelevant articles identified.
-
Given the large proportion of studies identified reporting source attribution data on multiple pathogens, search results from all pathogens may be combined into one library prior to de-replication. This will prevent duplicate studies being identified across multiple reference libraries.
-
Similarly, to reduce the risk of bias and human error, the screening and extraction results should be checked by a second reviewer.
-
Given the low number of studies investigating EPEC, it is recommended that general DEC be included as another search category as this may encompass more studies than individual E. coli pathotypes and so provide more reliable source attribution estimates.
3. Introduction
3.1. General background
Ensuring food safety is a mission statement of the FSA. Infectious intestinal disease (IID) transmission from foods exerts a significant disease burden on the UK (Daniel et al., 2020). In 2014, the FSA published the results of the costed extension to the IID2 study (project code FS231043), detailing estimates of the burden of foodborne disease in the UK (Tam et al., 2012, 2014). These estimates were updated in 2018 with new demographic and norovirus disease burden data, suggesting the UK suffers from approximately 2.4 million (95% credible intervals 1.8 million to 3.1 million) cases of foodborne disease per annum (Holland & Mahmoudzadeh, 2020). This comprises 222,000 GP presentations (95% Cred. Int. 150,000 to 322,000), and 16,400 hospitalisations (95% Cred. Int. 11,200 to 26,000).
In 2021, the FSA commissioned the third UK IID study (IID3) (project code FS301058) aiming to estimate the burden of IID within the UK, identify its causes, and calculate the proportion of cases not reported to healthcare providers based on data collected from September 2023 to August 2025. These data will be used by the FSA to estimate the number of foodborne domestic disease cases, general practice presentations, and hospitalisations, updating the 2018 estimates.
As part of this investigation, the FSA seeks to estimate the burden of IID linked to foodborne transmission. As IID may be transmitted by multiple transmission pathways (including foodborne, waterborne, person-to-person contact, and zoonotic transmission), the foodborne disease (FBD) burden is expected to be lower than the total disease burden (EFSA, 2008). Therefore, to estimate the burden of foodborne disease specifically, total burden estimates will be scaled based on the proportion of overall disease attributable to foods. Secondarily, these estimates will be used to assess the relative burden attributable to key food groups.
3.2. What is source attribution?
Source attribution is the process of estimating the proportional contribution of different transmission pathways to the overall burden (or prevalence) of disease. This allows the calculation of transmission pathway-specific estimates of disease burden and has been used across several national and multi-national foodborne disease studies to apportion the total FBD burden to specific foods (Hald et al., 2016; Scallan, Griffin, et al., 2011; Scallan, Hoekstra, et al., 2011; Tam et al., 2014).
3.3. Techniques to estimate percentage foodborne attribution
Several approaches have been used to produce source attribution estimates, including structured expert elicitation, outbreak surveillance, case-control studies, comparative exposure assessments, microbiological subtyping, and whole genome sequencing (WGS) techniques (Batz et al., 2005; EFSA, 2008; McCarthy et al., 2021). As part of the costed extension to IID2, the FSA performed a systematic literature review collating data from these different approaches published between 2001 and 2011 to estimate the UK burden of foodborne IID (Tam et al., 2014).
3.3.1. Structured expert elicitation
Expert elicitation estimates source attribution using the opinions of a panel of experts. This method is most frequently used when there is limited data availability, or the data are too sparse or uncertain to conduct other source attribution techniques (Batz et al., 2005). Various methods have been developed to conduct expert elicitation including Cooke’s ‘classical model’ (Cooke, 1991), used by the WHO foodborne disease burden epidemiology reference group (FERG) for source attribution to foods for use in the global burden of foodborne disease study (Hald et al., 2016; Havelaar et al., 2015). Within the classical model, experts first answer calibration questions to assess and weight their performance when answering the target questions. This allows the uncertainty within their answers to be quantified. Using the classical model, the WHO FERG estimated the percentage contribution of different transmission pathways for a total 18 pathogens across 14 global subregions. They estimated roughly 76% of Campylobacter infections in western and southern Europe (EUR-A region) were foodborne (95% uncertainty intervals 44% to 93%), similar to the 42% - 80% (minimum and maximum) found from pre-2011 literature review, and the 49% estimated by outbreak surveillance modelling in the IID2 extension report (Hald et al., 2016; Tam et al., 2014). The classical model has also been used to attribute foodborne disease burden to individual food commodities (Hoffmann et al., 2017).
Despite the utility of elicitation exercises, observable data-based approaches are often considered preferable as expert judgements are based on perceptions or opinions (Batz et al., 2005). As such, they are sensitive to group biases or misconceptions in the academic field, which may lead to false or highly variable results. Efforts to combat these biases include leveraging multi-disciplinary expert panels to provide a broader opinion on the target questions (Hald et al., 2016).
3.3.2. Outbreak surveillance
Data from outbreaks definitively linked to a foodborne source can be used to estimate the proportion of overall disease linked to food. This is often the most widely available data to perform food attribution studies with and has been used extensively in the USA and the UK (Adak et al., 2005; Batz et al., 2012; Scallan, Griffin, et al., 2011; Scallan, Hoekstra, et al., 2011; Tam et al., 2014). Outbreak data is generally averaged across a number of years to account for seasonality and year-on-year effects of disease incidence (Batz et al., 2012). Attribution estimates may be based on either the number of outbreaks or the number of outbreak cases. This approach was used by the CDC to estimate that 68% of STEC O157 infections were foodborne, and of these, 55.2% were attributable to beef products (Batz et al., 2012; Scallan, Hoekstra, et al., 2011). Outbreak data was also used alongside the systematic literature review results within the IID2 extension and was central in generating the 2011 and 2018 UK foodborne IID estimates (Holland & Mahmoudzadeh, 2020; Tam et al., 2014).
However, this approach has several limitations. First it requires robust surveillance efforts to collect outbreak data over a long period of time. Where this data is lacking, estimates based on outbreak surveillance are either unreliable or (for pathogens with no reported outbreaks) un-calculatable (Batz et al., 2012). Second, the approach requires robust links between the outbreaks used and a foodborne source. For the majority of outbreaks, the source remains unknown or only weakly associated and may be subject to bias, which limits the applicability of this approach. Finally, this approach assumes that the distribution of outbreaks among transmission pathways is the same as the distribution of sporadic disease (EFSA, 2008).
3.3.3. Microbial subtyping and whole genome sequencing
Microbial subtyping encompasses methods designed to distinguish bacterial isolates from one-another using genotypic or phenotypic characterisation methods (EFSA, 2008). These methods include serotyping, multi-locus sequence typing (MLST), pulsed-field gel electrophoresis (PFGE), and WGS techniques (EFSA, 2008; McCarthy et al., 2021). Isolates from human disease cases can be compared with one-another to identify emerging outbreaks, and with environmental isolates for source attribution. This data is often stored in databases (e.g. PulseNet), to facilitate outbreak tracking and surveillance across public health laboratories (Batz et al., 2005; Swaminathan et al., 2001). WGS was used by the FSA to attribute Campylobacter infections to food animal sources based on the MLST of sequenced isolates (McCarthy et al., 2021). Human derived isolates were attributed to different sources based on statistical prediction using the MLST data. This approach estimated roughly 70% of C. jejuni and 50% of C. coli infections could be attributed to chicken. Similarly, ruminants were identified as the second most important source of C. jejuni and most important source of C. coli infections.
However, this approach may be sensitive to biases within the models used for source attribution, requiring correction procedures to provide more accurate results (McCarthy et al., 2021). Not all microbial subtyping data may be used for source attribution, as this requires concurrent sampling of human infections and environmental sources (Batz et al., 2005). Finally, previous systematic literature review found few published methods using WGS data for source attribution, suggesting further methodological development may be needed to fully utilise WGS data for source attribution (McCarthy et al., 2021).
3.3.4. Case-control studies
Source attribution can also be estimated based on the results of case-control studies investigating the association between sporadic infections and risk factors representing transmission pathways. This approach uses the population attributable fractions (PAF) (also called population attributable risks) of the significant risk factors as the percentage attributable to that source.
However, this approach suffers from several limitations. First, the usability of case-control studies for source attribution depends on the target population of the study; as results in at-risk or vulnerable groups may not be representative of the wider population. Thus, careful definitions of the cases and controls used need to be considered (EFSA, 2008). Similarly, these studies are often limited in their scope and may not attribute infections to a fully comprehensive list of risk factors. Case-control studies often find conflicting results, as they are sensitive to the study population investigated, the case definition, age-groups, and risk factors included, and the methodology used. As a result, these studies might not be directly comparable, requiring comprehensive review and meta-analysis to synthesise results across a wide variety of literature.
3.3.5. Systematic review and meta-analysis
Systematic review has been used to combine information on transmission pathways across multiple studies. It can be used across case-control studies to build a better understanding of the influence of multiple risk factors and provide more comprehensive overview of the PAFs. Similarly, it was used within the IID2 extension to aggregate results across source attribution studies employing different methodologies to produce their estimates (Tam et al., 2014).
The World Health Organisation (WHO) used a combined approach of outbreak analysis and systematic review (and meta-analysis) to investigate Shiga-toxin producing Escherichia coli (STEC) attribution to specific food commodities (FAO & WHO, 2019). They analysed the results of 22 case-control studies investigating sporadic STEC infections published from 1985 to 2015 in a pooled meta-analysis, finding the main foodborne sources of STEC were likely to be beef, unspecified meat, produce, dairy, and chicken, although this varied by region. While the authors did not estimate the proportion of disease attributed to these factors across studies, the results were similar to the outbreak analysis, which found the main sources of STEC in Europe to be beef (11.8%), produce (11.4%), and dairy (6.2%) with 61.9% of food-attributed infections stemming from an unknown source (FAO & WHO, 2019). Previous UK estimates from the 2014 systematic review align with these commodities, suggesting the primary foodborne sources of E. coli O157 (the most prevalent STEC serotype at the time) were beef and lamb (comprising between 46.1% and 69.8% of foodborne cases across the studies reviewed), produce (8.8% and 29.2%), and dairy (4.1% and 10.2%) (Tam et al., 2014).
3.4. Aims and objectives
This study aims to begin the systematic literature review for four pathogens included within IID3 and other FSA investigations to estimate the proportion of disease attributable to foods. To achieve this, four objectives have been identified:
-
To identify the proportion of disease attributable to foods for each included pathogen.
-
To identify the proportion of foodborne disease attributable to individual food commodities or groups of commodities for these same pathogens.
-
Where possible, to compare results with those obtained in the IID2 extension.
-
To make recommendations on the methodology for future systematic review covering the pathogens not included here.
4. Materials and Methods
4.1. Literature searches
From IID3, enteropathogenic E. coli (EPEC) and sapovirus were selected to include within this literature review. EPEC currently (circa November 2024) is the most commonly isolated pathogen observed within the cohort study. Contrarywise sapovirus has not been observed as frequently, and the amount of data available is expected to be lower, making it a manageable addition to the review. Additionally, two further non-IID causing pathogens were also selected, to test the approach across a wider range of pathogens: hepatitis A virus (HAV) and Toxoplasma gondii.
Previous UK studies commissioned by the FSA have estimated the foodborne burden of sapovirus and reviewed the risk of infection from foods for T. gondii (Ad Hoc Group on Vulnerable Groups, 2012; Tam et al., 2014). However, recent specific estimates for the proportion of disease attributable to foods for these organisms are unavailable. The burden for foodborne disease attributable to HAV and EPEC in the UK is unknown and has not been investigated before. Therefore, their inclusion here will provide evidence to support future studies of their prevalence and associated disease burden within UK food systems.
Literature searches were conducted for each of the included pathogens individually across the PubMed, SCOPUS, and ScienceDirect databases. Results available in English between the years 2012 and 2025 were retrieved. PubMed and SCOPUS were searched using MeSH search terms, while ScienceDirect was searched using free text, with additional filters for the abstract, title, and keywords (Appendix A). Searching was done using combinations of search terms across three categories to ensure balanced breadth and specificity of results for each pathogen included. The search strategy used for EPEC and PubMed/ SCOPUS are listed below as an example (see Appendix A for a full breakdown of the search terms used and number of results by pathogen and database):
i. (EPEC OR “enteropathogenic Escherichia coli”)
ii. AND (disease OR illness OR infection)
iii. AND (food or food*)
iv. AND human
-
Search i. independently
-
Search i. AND ii. combined
-
Search i. AND ii. AND iii. combined
-
Search i. AND ii. AND iii. AND iv. Combined
Grey literature was retrieved from the CDC, EFSA, WHO, UK FSA, Dutch National Institute for Public Health and the Environment, Australian Department of Health and Aged Care (OzFoodNet Network), and the Canadian Public Health Agency websites. These national and multi-national organisations were chosen as institutions that have previously conducted or funded source attribution or disease burden estimations across UK-comparable geographic regions. Pathogen-specific search terms did not retrieve the expected articles identified within the wider literature search, and as such the free-text term “food attribution” was used to search grey-literature sources instead. In each case, the top 100 results were assessed for inclusion. Articles containing relevant data were incorporated into pathogen-specific libraries for data extraction.
4.2. Screening process
Search results were downloaded into individual EndNote (Microsoft Corporation) libraries for each pathogen. The ‘Find Duplicates’ function was used to find, and separate duplicate entries in EndNote. These were manually reviewed and removed. EndNote libraries were exported as xml files using the Alfasoft XML export style for EndNote (Alfasoft Limited). Exported xml files were imported into Microsoft Excel for title and abstract screening per pathogen.
Articles were included or excluded based on the following eligibility criteria: Studies included were source attribution studies providing estimates of the total proportion of disease that is foodborne. These may include expert elicitations, modelling studies (including disease burden studies and quantitative microbial risk assessments), and case-control studies attributing disease cases to a number of risk factors (including food). Studies excluded were those done as part of outbreak investigations (including case-control studies within outbreak investigations), surveillance data, cross-sectional surveys, studies done in live animals or food products, case-control studies not including food products as risk factors, studies done in countries not comparable to the UK (European countries, Canada, the USA, Australia, New Zealand, and Japan included), studies published before 2012, and studies unavailable in English.
Borderline cases, and articles that did not fit the inclusion criteria, but that may contain relevant references or supporting information were labelled as ‘other’ and assessed separately. The final list of studies was further curated based on the accessibility of the studies.
4.3. Data extraction and curation
Included articles were retrieved and data extracted using a standardised template. For articles labelled as other, borderline cases were reviewed alongside included articles. Where articles did not contain relevant data, the in-text citations were screened to identify further studies that may be applicable. Where possible, data was extracted across the following fields: study title, first author, year, DOI, study design, case definition and age groups (relevant for case-control studies only), food commodity, and food attribution estimate. When reported, the uncertainty interval, and interval type were also extracted; however, given the range of different uncertainty measures used, these were ultimately not incorporated into the main results. A full list of attribution estimates, and corresponding uncertainty intervals (when reported) may be found in Appendix B.
For commodity specific attributions, the food coding scheme from IID2 was used to maintain comparability between the studies. The food categories used in this report are listed in Table 1. For graphical representation and comparison to IID2, estimates from other categories were combined where necessary in line with the foods included within each category (Table 1). The specific food attribution estimates extracted may be found in Appendix B.
Given the range of source attribution methods used, a purely descriptive analysis of the extracted data was undertaken. Extracted data was imported into R version 4.3.2 for visualisation (R Core Team, 2023). Data manipulation was done using the readxl 1.4.3 (Wickham & Bryan, 2023), data.table 1.15.4 (Barrett et al., 2024), and dplyr 1.1.4 (Wickham et al., 2023) packages, and graphs were generated using ggplot2 3.5.1 (Wickham, 2016).
5. Results
5.2. Literature search results
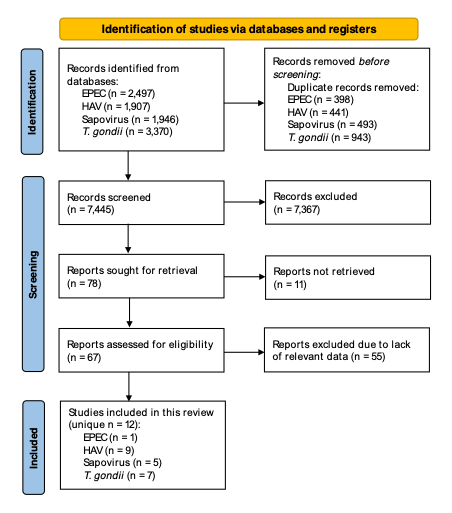
In total, 7,445 de-duplicated studies were retrieved and screened across the four pathogens included (EPEC: 2,099 records, HAV: 1,466, sapovirus: 1,453, T. gondii: 2,427). Post screening, the full text was sought for retrieval for a total 78 studies (including duplicate studies within different pathogen libraries). This left 67 studies from which data extraction was attempted. A final 12 studies contained relevant estimates of the percentage of disease attributable to foods, included within this report (Figure 1). These included data on EPEC (one study), HAV (nine studies), sapovirus (five studies), and T. gondii (seven studies). Table 2 provides a summary of study characteristics, including the types of data used to produce estimates, the geographic region covered, and time periods the studies were conducted over.

5.2. Foodborne attribution of total disease cases
Data were extracted from five multi-pathogen food attribution studies using expert elicitation (Table 3). No outbreak surveillance nor case-control studies were identified containing relevant data regarding aim one. One study (Drudge et al., 2019) used expert elicitation data collected within Butler et al. (2015), but modelled that data differently (as distributions rather than median estimates), forming different estimates for the food attributable fraction of disease. On average, sapovirus was estimated to have the lowest food-attributable percentage of disease, while EPEC had the highest (Figure 2). For both HAV and T. gondii a wide range of food attributable proportions was observed.

Three of the studies identified contained data from non-food transmission pathways (Table 4). Alongside food, human contact formed a major transmission pathway for HAV, EPEC, and sapovirus, and was a greater contributor to the total transmission of disease for sapovirus and HAV in some studies. For T. gondii, person to person transmission was less impactful, and was not included in the analysis for two studies. Instead, animal contact, waterborne, and environmental (specifically through soil) transmission were identified as more impactful across studies.
Only one study was identified that contained data on EPEC (Hald et al., 2016). E. coli disease was more frequently broken down into Shiga-toxin producing (STEC), and non-Shiga toxin producing (non-STEC) diarrheagenic variants, with a few studies also including enterotoxigenic pathotypes (ETEC) (Beshearse et al., 2021; Butler et al., 2015). Three studies contained data on multiple non-STEC intraintestinal E. coli pathotypes grouped together as diarrheagenic E. coli (DEC) (including EPEC). These suggested the majority of DEC disease was transmitted by food, although transmission through human contact emerged as another important exposure pathway (Table 5).
The literature search identified two further studies producing multiple models of food attribution for HAV and sapovirus. Each study used multiple different modelling techniques that were based on approaches leveraged in previous studies, but across a longer data collection period (Scharff, 2020; Yang & Scharff, 2024). The choice of models was not identical between the two studies; however, there was considerable overlap in the approaches used. Scharff, 2020 leveraged models based on approaches used by the USA Interagency Food Safety Analytics Collaboration group (IFSAC) (models 1 and 4), Batz 2012 (model 2), and Painter 2013 (model 3) (Batz et al., 2012; Interagency Food Safety Analytics Collaboration, 2021; Painter et al., 2013). Yang 2024 used the same approach for models from the IFSAC and Painter 2013 (models 1 and 2 respectively), and included a third model based on Pires et al., 2019 (model 3). These studies attributed total disease burden to individual food groups. Given that these do not directly align with the specified aims of this review, these were tabulated and assessed separately (Table 6 and Table 7). Scharff (2020) also contained data on T. gondii using expert elicitation data from Scallen et al. (2011). This data was collected before 2012, and so these results were not included here.
Across the two studies, more sapovirus transmission was apportioned to meat and poultry (20.4 – 50% across models) compared to leafy greens (0 – 12.4%). There was less variation in the attribution estimates for HAV between the food groups (meat and poultry: 0.1 – 4.5%, leafy greens: 0.86 – 3.3%). Scharff, 2020 also included a breakdown of results by food commodity for some of the models estimated (Appendix B).
5.3. Foodborne disease attribution to individual food groups
Four studies were identified containing data on attribution of foodborne disease to specific food groups or commodities, with one further study identified that attributed disease to food product subcategories. None of the studies identified contained attribution results for EPEC (Table 8). Only one study containing relevant data included sapovirus results, while two studies were identified for HAV and three for T. gondii.
The highest percentage of HAV disease was attributed to produce, although there was a large difference in the estimates reported by each study (45% versus 95.4%) (Figure 3). Meanwhile, red meats (pork, beef, game, etc.), and produce had the highest contribution to foodborne disease from T. gondii; although disease attributed to these food commodities varied between the studies. Specifically, Batz et al. (2012) suggested pork was the single most important foodborne source of T. gondii infections; while Hoffmann et al. (2017) suggest that produce and beef were more impactful. Produce, and other foods (grains and beans) made up 100% of the foodborne sapovirus disease attributed (Painter et al., 2013). However, this was based on outbreak data and therefore for food groups lacking corresponding outbreaks, no percentage of disease could be attributed. The food groups reported here follow the coding scheme reported previously (Table 1) and have been combined where necessary for ease of comparison (raw data reported in Appendix B).

One expert elicitation study was identified reporting on disease attribution to food product subcategories (e.g. whole cuts versus mince) which contained data regarding T. gondii (Zanabria et al., 2019). For each of the three commodities included (beef, pork and poultry), the majority of infections was suggested to derive from non-ready-to-eat (non-RTE), minced products (Table 9). Furthermore, all RTE product subcategories formed a minority of the predicted disease burden.
5.4. Comparison to IID2 source attribution results
The food attribution results for sapovirus were compared to those identified from the systematic review, and outbreak data investigations conducted in the IID2 extension project (Tam et al., 2014). The IID2 extension project constructed three separate disease burden models each using a slightly different approach to estimate foodborne attribution. Model one relied on outbreak surveillance data alone, while models two and three incorporated data from the systematic literature review as well. No sapovirus outbreaks were identified in IID2, and so the food attribution results for norovirus were used for model one instead. The IID2 extension project literature review identified one eligible study containing estimates for sapovirus attribution, but this was not enough data to inform estimates in models two and three, and so sapovirus was excluded from these models. Here, the estimates from model one, and the single study identified through literature review are compared to the two studies identified within this review.
Estimates identified here for sapovirus attribution were slightly higher than in the IID2 extension, although no formal statistical comparison of results between the two studies was made. While the recovered literature here suggested foodborne transmission was responsible for 13% – 16.9% of total disease, IID2 model one results suggested it was responsible for only 2.5% of outbreak cases and the literature review reported just 0.5% (Scallan, Hoekstra, et al., 2011) (Figure 4). No commodity specific estimates to sapovirus were identified in IID2. Here, only Painter et al. (2013) included food commodity-specific sapovirus results, attributing the disease observed to produce and grains and beans (Painter et al., 2013) (Figure 4).

6. Discussion
6.1. General discussion
Overall, the data collected here suggests foodborne transmission comprises a larger percentage of disease for EPEC, and T. gondii compared to sapovirus and HAV; although there was considerable variation in source attribution estimates between different studies.
The food attribution results identified for sapovirus were higher than those within the IID2 extension project (Tam et al., 2014). Here, food was estimated to account for roughly 13% – 16.9% of sapovirus infections, compared to just 0.5% and 2.5% identified previously (Beshearse et al., 2021; Butler et al., 2015; Scallan, Hoekstra, et al., 2011; Tam et al., 2014). While most of these studies were conducted across the US and Canada (except the IID2 extension), they vary in the methodological approach used; with Scallen et al. (2011) and IID2 using a mixture of outbreak surveillance and literature review, and the remaining two studies leveraging expert elicitation methods. Therefore, while the different food attributable fractions identified may reflect a changing epidemiology of disease, they may also stem from the methodological and temporal differences between the studies.
Only one study provided food-specific estimates for sapovirus, leveraging outbreak surveillance data to apportion disease (Painter et al., 2013). Given outbreaks were not observed across all food commodities included, this approach was unable to fully estimate the disease proportion across different food groups. Previous research has implicated shellfish as a source of sapovirus outbreaks, suggesting a wider role of foodstuffs in sapovirus transmission than has been identified here (Iizuka et al., 2010). In lieu of the limited sapovirus outbreak data available, future studies might consider expert elicitation or case-control study designs as a means to apportion sapovirus disease to food-specific transmission pathways.
The EPEC (and non-STEC DEC) food attribution estimates identified here were similar to pre-2012 from Australia and the USA (50% and 30% respectively) (Hall et al., 2005; Scallan, Hoekstra, et al., 2011). However, previous UK results were much lower at only 8.2% (Adak et al., 2002). This difference may stem from the different methodologies used between studies. Adak et al. (2002) leveraged outbreak surveillance data to estimate foodborne attribution and so may be sensitive to disease underreporting. Similarly, data from 1992 – 2000 was used, and as such this may not be representative of the current incidence of disease.
More studies assessing general non-STEC DEC were found than specific EPEC studies. Non-STEC DEC was not specifically searched for, and the results were identified from the relatively narrow selection of multi-pathogen studies surveyed here. Further studies may be found if searching for non-STEC DEC specifically. No food-specific attribution results were identified for either EPEC or non-STEC DEC. Future multi-pathogen source attribution studies, and food commodity-specific studies should include non-STEC DEC or specific E. coli pathotypes to better apportion disease to different transmission pathways, including foods.
The range of T. gondii attribution results identified (28% – 61%) encompassed the previous US estimate (50%), suggesting the food attributable fraction of disease may not vary greatly over the timescales investigated (Scallan, Hoekstra, et al., 2011). Two studies were identified estimating the proportion of foodborne disease attributable to specific food commodities; however, attribution estimates varied considerably between them. Batz et al. (2012) used US expert elicitation data published in 2007 apportioning foodborne T. gondii infections to food groups (Hoffmann et al., 2007), and as such these estimates may be less comparable to the UK than those reported in Hoffmann et al. (2017) using more recently collected expert judgement data for western Europe.
The food attributable fraction of HAV disease was previously estimated at approximately 7% based on US surveillance data from 2000 – 2007 (Scallan, Hoekstra, et al., 2011). However, estimates identified here covered a range of values from 10% – 42% of the total disease observed. The wide range of food attribution percentages for HAV and T. gondii may reflect differences in study design, disease epidemiology, and food systems structure across different geographic areas and time periods. Several notable foodborne outbreaks have occurred in Europe since 2012, including two outbreaks linked to frozen berries (Collective Nordic outbreak investigation team, 2013; EFSA & ECDC, 2013). Such largescale outbreaks may lead to an increase in the estimated foodborne proportion of disease reported using both outbreak surveillance and expert elicitation. However, from the data identified here, it is not possible to determine the specific factors that may contribute to the different estimates of food attribution identified.
Two studies were identified attributing HAV disease to individual food commodities, jointly suggesting produce, complex and other foods, and seafood comprised a majority of foodborne disease. However, one of these apportioned HAV disease cases using limited surveillance data, covering a narrow range of products (Painter et al., 2013). This limits the applicability of these estimates and may lead to an over estimated contribution of produce to foodborne disease.
Given the variation in geographic region and methodology between the studies reviewed, quantitative comparison of food attribution estimates was not possible here. Multiple methodologies have been used to estimate source attribution proportions from expert elicitation or outbreak surveillance data. Some of the studies included summarise results as mean average values, while others report medians, or most probable estimates. This methodological variation stretches from study design to analysis and severely complicates the formal comparison of attribution estimates between studies.
6.2. Recommendations toward the systematic review of the remaining pathogens within IID3
To complete the systematic review of the remaining pathogens included in IID3, the following recommendations are made:
-
The multi-pathogen food attribution studies identified here may be used to benchmark search results to ensure relevant studies are included. This should streamline the literature searching steps, improving efficiency.
-
The search strategy used here has been kept broad in scope. Adapting it to include method specific key words may reduce the number of irrelevant articles identified. For instance, “case control OR expert elicitation OR…” would restrict search results to methodologies used to estimate source attribution, eliminating many off-target results. This approach was used in the IID2 extension project, where the authors recovered 1,443 unique articles for Campylobacter, compared to the 3,911 identified using the final search strategy outlined here.
-
Using the current review approach, studies providing data on multiple pathogens may be present across multiple reference libraries and so may be screened repeatedly. To avoid this, final search results can be combined into one library, deduplicated, and screened as one.
-
In line with the PRISMA guidelines (Page et al., 2021), is its recommended that a second reviewer check the screening and data extraction results. This allows for better decision-making for borderline articles and reduces the risk of bias and human error.
-
The inclusion of grey literature search results is recommended. While no grey literature studies were identified in this review, searches of national governmental databases identified at least one further peer-reviewed publication which were not recovered by the original search. Here, utilising peer-reviewed studies commissioned by national or international agencies as benchmarks for this search process proved effective.
-
Given the limited data available for specific E. coli pathotypes (EPEC investigated here) the inclusion of studies reporting grouped results for non-STEC DEC should be considered. If included in the final review, these studies should be searched for specifically.
7. Conclusion
Here, estimates for the food attributable portions of disease for four important foodborne UK pathogens are reported. These will be used to support future FSA studies estimating the food-attributable burden of disease. While these attribution estimates were similar to pre-2012 estimates, the variability of results between studies is highlighted. This variability may be due to variation in study design, data analysis, differences in disease epidemiology between geographic regions, and over different time periods. Recommendations on extending this work to the remaining pathogens covered by IID3 include combining search results into a single multi-pathogen reference library, and revising the search strategy to narrow the scope of articles recovered. Finally, given the paucity of attribution data available for EPEC, it is recommended that non-STEC DEC be included in further review as a separate category, to provide more reliable estimates of food attribution for DEC pathotypes.
8. Acknowledgements
Sam A. Mellor, a BBSRC funded Norwich Research Park Doctoral Training Partnership student based at the Quadram Institute Bioscience completed his PIPS at the FSA. The authors would like to thank Amy Hale, Anthony Wilson, Darren Holland, and Laura Biddle for their help in reviewing this report.