Acknowledgements
The authors would like to thank the chicken processing sites visited in this project for their generous access to their data and support and access to their sites.
The authors would like to thank Miss Hamida Musah Alhassan, Mr Oliver Horne, Miss Sophie Bowers, Mr Bamidele Adedeji, Mr Jesse Adenola, Dr Essam Hebishy, and Dr Samson Oyeyinka for their involvement in the sample collection and sample preparation stages of this project.
We would also like to thank the UK Food Standards Agency for funding this work.
Glossary and abbreviations
| Term/Abbreviation |
Definition/Description |
| Antibiotic |
An antibiotic is a drug used to treat bacterial infections. Such agents have no effect on viral or fungal infections. Examples of antibiotics include penicillins, tetracyclines, fluoroquinolones and polymyxins such as colistin. Antibiotic growth promoters (AGPs) have been used as additives to improve feed efficiency in food animals. Their use for this purpose has been banned in EU countries, including the UK, since the early 2000s but some AGPs are still licensed for use in some countries. |
| Antimicrobial |
Any substance that kills or stops the growth of microorganisms, such as antibiotics, antifungals, biocides, and preservatives. |
| AMU |
Antimicrobial use |
| AMR |
Antimicrobial resistance.
For the interpretation of AMR, the WHO definition was applied (WHO, 2018): “Antimicrobial resistance is resistance of a microorganism to an antimicrobial drug that was originally effective for treatment of infections caused by it. Resistant microorganisms (including bacteria, fungi, viruses, and parasites) are able to withstand attack by antimicrobial drugs, such as antibacterial drugs (e.g., antibiotics, antifungals, antivirals, and antimalarials), so that standard treatments become ineffective, and infections persist, increasing the risk of spread to others.” |
| ARG(s) |
Antimicrobial resistance gene (s).
An ARG is a gene implicated in or associated with conferring phenotypic resistance to one or more antimicrobial. The resistance may result from the presence or absence of a gene, or specific mutations acquired spontaneously or accumulated through evolution over time. Although ARGs confer resistance, clinical treatment with higher doses of the antimicrobial may still be effective. |
| Bacteriophage |
Often shortened to phage (as in this report), a bacteriophage is a virus that parasitises a bacterium by infecting it and reproducing inside it. Phages are capable of packaging part of their host’s genetic material (including ARGs) either by reproducing within the host cell before lysing the cell (lytic) or through incorporation into the host cell genome (lysogenic). Phages cannot infect human cells. |
| Biofilm |
A community, which may consist of one or more types of bacteria and also other microorganisms. Biofilms attach to a surface (biotic or abiotic) and are covered by an extracellular substance, which may afford protection from an antimicrobial, due to lack of, or slower penetration of the biofilm. Organisms may grow slower in a biofilm and enter a hyper-mutable state and such proximity of bacterial cells may help promote Horizontal Gene Transfer. |
| BIOHAZ Panel |
European Food Safety Authority (EFSA) Panel on Biological Hazards. |
|
blaTEM
|
An ARG conferring resistance to β-lactam antibiotics located on a family of related β-lactamase plasmids. |
|
blaCMY-2
|
A family of the AmpC β-lactamase genes that confer broad-spectrum resistance to β-lactam antimicrobials, including ceftriaxone and ceftiofur, as well as to β-lactamase inhibitors, such as clavulanic acid. |
|
blaCTX-M
|
An ARG conferring extended spectrum β-lactamase (ESBL) resistance against a wide range of β-lactam antimicrobials by different transposons and Insertion sequences (IS). |
| Breakpoint |
Breakpoints are the values used by clinical microbiology laboratories to interpret the results of antimicrobial susceptibility testing (AST) and classify isolates as susceptible or resistant. |
| CFU |
Colony-forming unit
A CFU is a unit which estimates the number of microbial cells (bacteria, fungi, viruses etc.) in a sample that are viable and able to multiply via binary fission under controlled conditions, i.e. the number of colonies counted on a petri dish. |
| CIAs |
‘Critically Important Antimicrobials’ (WHO terminology).
There are some differences in the categorisation of CIAs between different organisations. The WHO (WHO, 2018) categorises CIAs as meeting two criteria:
Criterion 1 (C1): The antimicrobial class is the sole, or one of limited available therapies, to treat serious bacterial infections in people.
Criterion 2 (C2): The antimicrobial class is used to treat infections in people caused by either: (1) bacteria that may be transmitted to humans from non-human sources, or (2) bacteria that may acquire resistance genes from non-human sources. |
| Commensal |
An organism that co-exists in the internal or external environment of the host, without causing harm, as far as is known. |
| DNA |
Deoxyribonucleic acid.
Deoxyribonucleic acid is a molecule composed of two polynucleotide chains that coil around each other to form a double helix carrying genetic instructions for the development, functioning, growth and reproduction of all known organisms and many viruses. |
| ECOFF |
Epidemiological Cut Off value (with respect to antimicrobial resistance): represents the point (breakpoint) at which bacteria have developed a higher level of resistance to an antimicrobial agent than the background level of resistance that exists naturally for that bacterial species. A ‘resistant’ (or ‘non-susceptible’) ECOFF does not necessarily imply a level of resistance which would correspond with clinical treatment failure. |
| EFSA |
European Food Safety Authority. |
| ESBL(s) |
Extended spectrum beta-lactamases.
ESBLs are enzymes produced by bacteria such as Escherichia coli and Klebsiella species. ESBLs mediate resistance to 3rd/4th generation cephalosporins. |
| EUCAST |
European Committee on Antimicrobial Susceptibility Testing |
| FAO |
Food and Agriculture Organization of the United Nations. |
| FSA |
Food Standards Agency. |
| Genome |
The genetic information of an organism. |
| Gram-negative bacteria |
Gram-negative bacteria are characterised by their cell envelopes, which are composed of a thin peptidoglycan cell wall sandwiched between an inner cytoplasmic cell membrane and a bacterial outer membrane. They do not retain the crystal violet stain used in the Gram staining method of bacterial differentiation. Pathogenic Gram-negative bacteria are increasingly resistant to most available antimicrobials. They have built-in abilities to find new ways to be resistant and can pass along genetic materials that allow other bacteria to become drug resistant. Gram-negative bacteria are generally more resistant to antimicrobials than Gram-positive bacteria. |
| Gram-positive bacteria |
Gram-positive bacteria have a thick peptidoglycan layer in the bacterial cell wall which allows for the take up the crystal violet stain used in the Gram staining method of bacterial differentiation. Gram-positive bacteria appear to be purple-coloured when seen through an optical microscope. |
| gyrA |
Mutation in this gene can confer resistance to ciprofloxacin and nalidixic acid. |
| HGT |
Horizontal Gene Transfer
Transfer of genetic material (including ARGs), among different bacteria and species, other than by the transmission of DNA from parent to daughter cell. There are a number of different mechanisms through which HGT can occur. |
| Integron |
A type of mobile genetic element (MGE) with the ability to capture and disseminate genes (including ARGs). These genes are located on gene cassettes (a term that is changing to integron cassette), though an integron does not necessarily include any gene cassettes. Integrons can be found in plasmids, chromosomes, and transposons. |
| MDR |
Multidrug Resistance.
Resistance of a bacterial isolate to three or more classes of antimicrobial. |
| Metaphylactic |
Treatment of a group of animals without evidence of disease, which are in close contact with other animals that do have evidence of infectious disease. |
| MIC |
Minimum Inhibitory Concentration.
The lowest concentration of an antimicrobial that prevents visible growth of a bacteria in a liquid or agar test. |
| Microbiota |
The assemblage of living microorganisms present in a defined environment. |
| Microorganisms (microbes) |
Organisms that include bacteria, viruses, fungi, and parasites. |
| MGE(s) |
Mobile Genetic Element (s).
MGEs, also known as transposable elements (TEs), are fragments/sequences of DNA that can be transported between bacteria. They can encode a variety of virulence or resistance determinants (such as ARGs) that can change places on a chromosome, and can be transferred between chromosomes, between bacteria, sometimes including different species. Types of MGEs include plasmids, integron gene cassettes, and transposable elements. |
| NAP |
National Action Plan
UK Government 5-year (2024 to 2029) AMR National Action Plan (NAP) for tackling antimicrobial resistance. |
| PCR |
Polymerase chain reaction
A laboratory technique that amplifies specific DNA or RNA segments to detect and analyse genetic material. |
| Phylum |
A grouping together of related organisms on the basis of their fundamental characteristics. It is the third most broad category of taxonomy, falling between kingdom and class. |
| Plasmid |
A type of MGE in a cell that can replicate independently of the chromosome(s), typically a small circular double DNA strand in the cytoplasm of a bacterium. Plasmids can carry and transfer ARGs from the host to other cells, via other MGEs (integron gene cassettes and transposable elements). |
| Shotgun metagenomic sequencing |
The untargeted ('shotgun') sequencing of all ('meta-') microbial genomes ('genomics') present in a biological sample. Shotgun sequencing can be used to profile taxonomic composition and functional potential of microbial communities and to recover whole genome sequences. |
| Spp. |
Species. |
| ST |
Sequence type
An unambiguous procedure for characterising isolates of bacterial species using the sequences of internal fragments of (usually) seven house-keeping genes. |
| Tet(A) |
An ARG found in Gram-positive bacteria, and which confers resistance to tetracycline group of antibiotics -chlortetracycline, doxycycline, and minocycline - by encoding a tetracycline efflux protein. |
| Therapeutic use |
Use of antimicrobials to treat individual humans or animals (or groups of animals) suffering from a bacterial infection. |
| WGS |
Whole-Genome Sequencing
WGS reveals the complete DNA make-up of an organism, enabling an understanding of variations both within and between species. |
| WHO |
World Health Organisation (of the United Nations). |
Lay Summary
The emergence and spread of resistance to antimicrobials in bacteria, viruses, fungi, and parasites is of global concern. There is increasing concern that the food chain and food processing environments may significantly contribute to the transmission of antimicrobial resistant bacteria and genes (ARGs), potentially serving as hotspots for the acquisition and spread of antimicrobial resistance (AMR). However, relatively little is known about the role of the food chain in the transmission of AMR bacteria in general, including the transmission and prevalence of AMR bacteria in chicken and chicken products, before retail. The overall aim of this project was to access the impact that processing has on the presence and transfer of antimicrobial resistant Campylobacter species (spp.) and Escherichia coli and associated genes on chicken meat. Since poultry accounts for half of the meat eaten in the United Kingdom (UK) it potentially represents a significant reservoir for AMR to transfer to humans. This project therefore was intended to act as a baseline for work comparing two similar typical large scale UK chicken plants using traditional and newer approaches, as well as an incentive for further testing, to establish the importance of different processing steps in AMR transmission and identify mitigating strategies for reducing and eliminating persistence and transmission of AMR.
This project was carried out in two parts. Part 1. an initial literature review which was carried out to aid the project sampling plan/design and part 2. a field and laboratory study conducted to assess the presence and potential transmission of AMR- Campylobacter spp. and E. coli during the processing of chicken in two similar sized large scale UK chicken processing sites producing whole chickens and chicken meat for major UK retailers at different points in the year.
Key findings
Our literature review found that:
-
Few published studies have investigated the transmission of AMR bacteria or ARGs during poultry processing, with existing research suggesting that AMR and ARGs in outgoing meat are primarily influenced by farm-level factors rather than in-plant procedures. There is limited published evidence on the transmission and persistence of AMR bacteria and genes occurring in processing environment.
-
No published studies have looked at the impact of physical interventions (such as steam) that may be employed to reduce pathogenic contamination on chicken carcasses on the transmission of AMR. Such interventions are now being employed by some UK chicken processors and employed in both plants studied in this project.
Our field and laboratory study found that:
-
Of the 376 samples collected from the poultry plants during this current project, 65.1% of samples were positive for presence of Campylobacter spp. and 95.6% were positive for presence of E. coli.
-
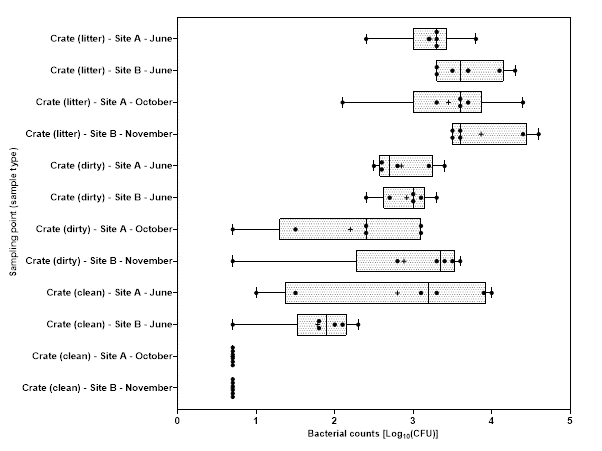
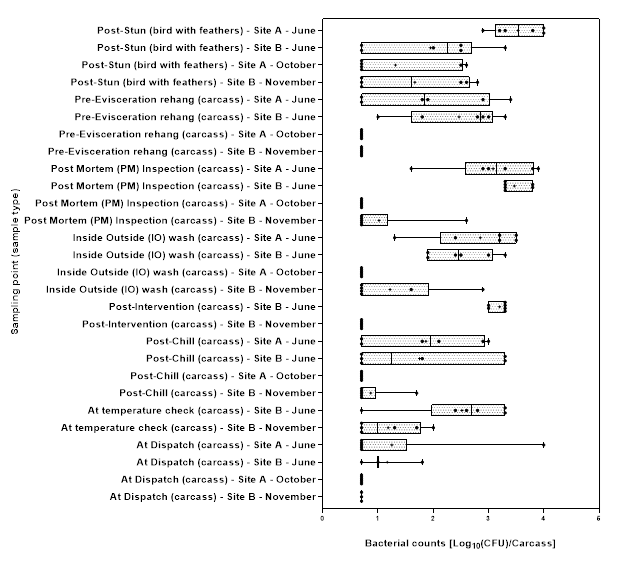
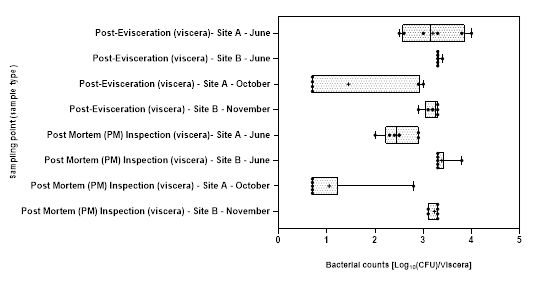
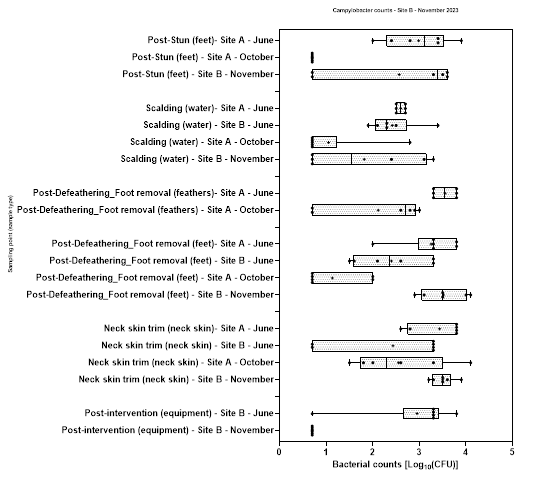
Levels of Campylobacter spp. isolated from sample collected from the 2 UK plants ranged from 1.00±0.0 to 3.9±0.5 log10 Colony Forming Units (CFU) per sample; with the highest level recorded from chicken litter and the lower levels recorded from post intervention equipment, scalding water, clean crates, and on carcasses at dispatch.
-
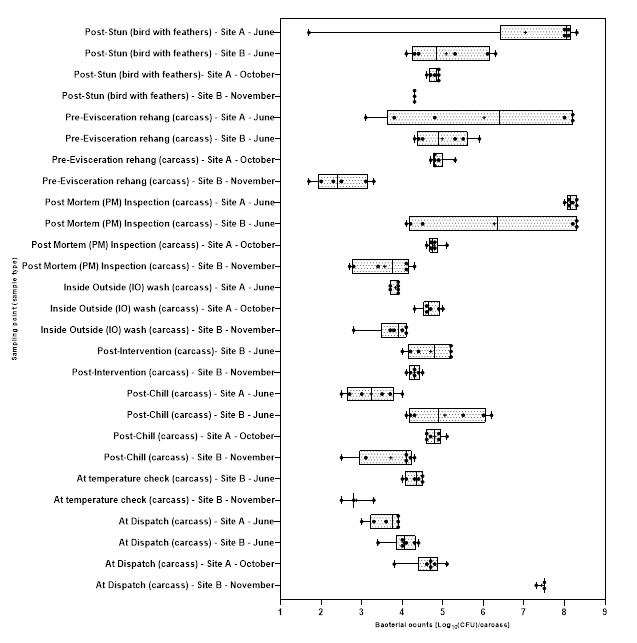
Levels of E. coli isolated from sample collected from the 2 UK plants ranged from 2.0±0.0 to 8.3±0.2 log10 CFU per sample; with the highest level recorded from chicken litter and the lower levels recorded from post intervention equipment, post intervention carcasses, scalding water, post chill, inside outside wash and clean crate processing stages.
-
Campylobacter spp. and E. coli were detected at different stages throughout the production process in both plants, with higher numbers measured at the earlier stages of the process in both plants.
-
At some stages of the process no Campylobacter spp. or E. coli were isolated in either plant.
-
Generally, levels of Campylobacter spp. decreased to non-detectable levels in samples taken further along the processing stages. For E. coli while there was a general decrease in the level of the organisms, samples tested at the later stages of processing remained still positive for the presence of E. coli.
-
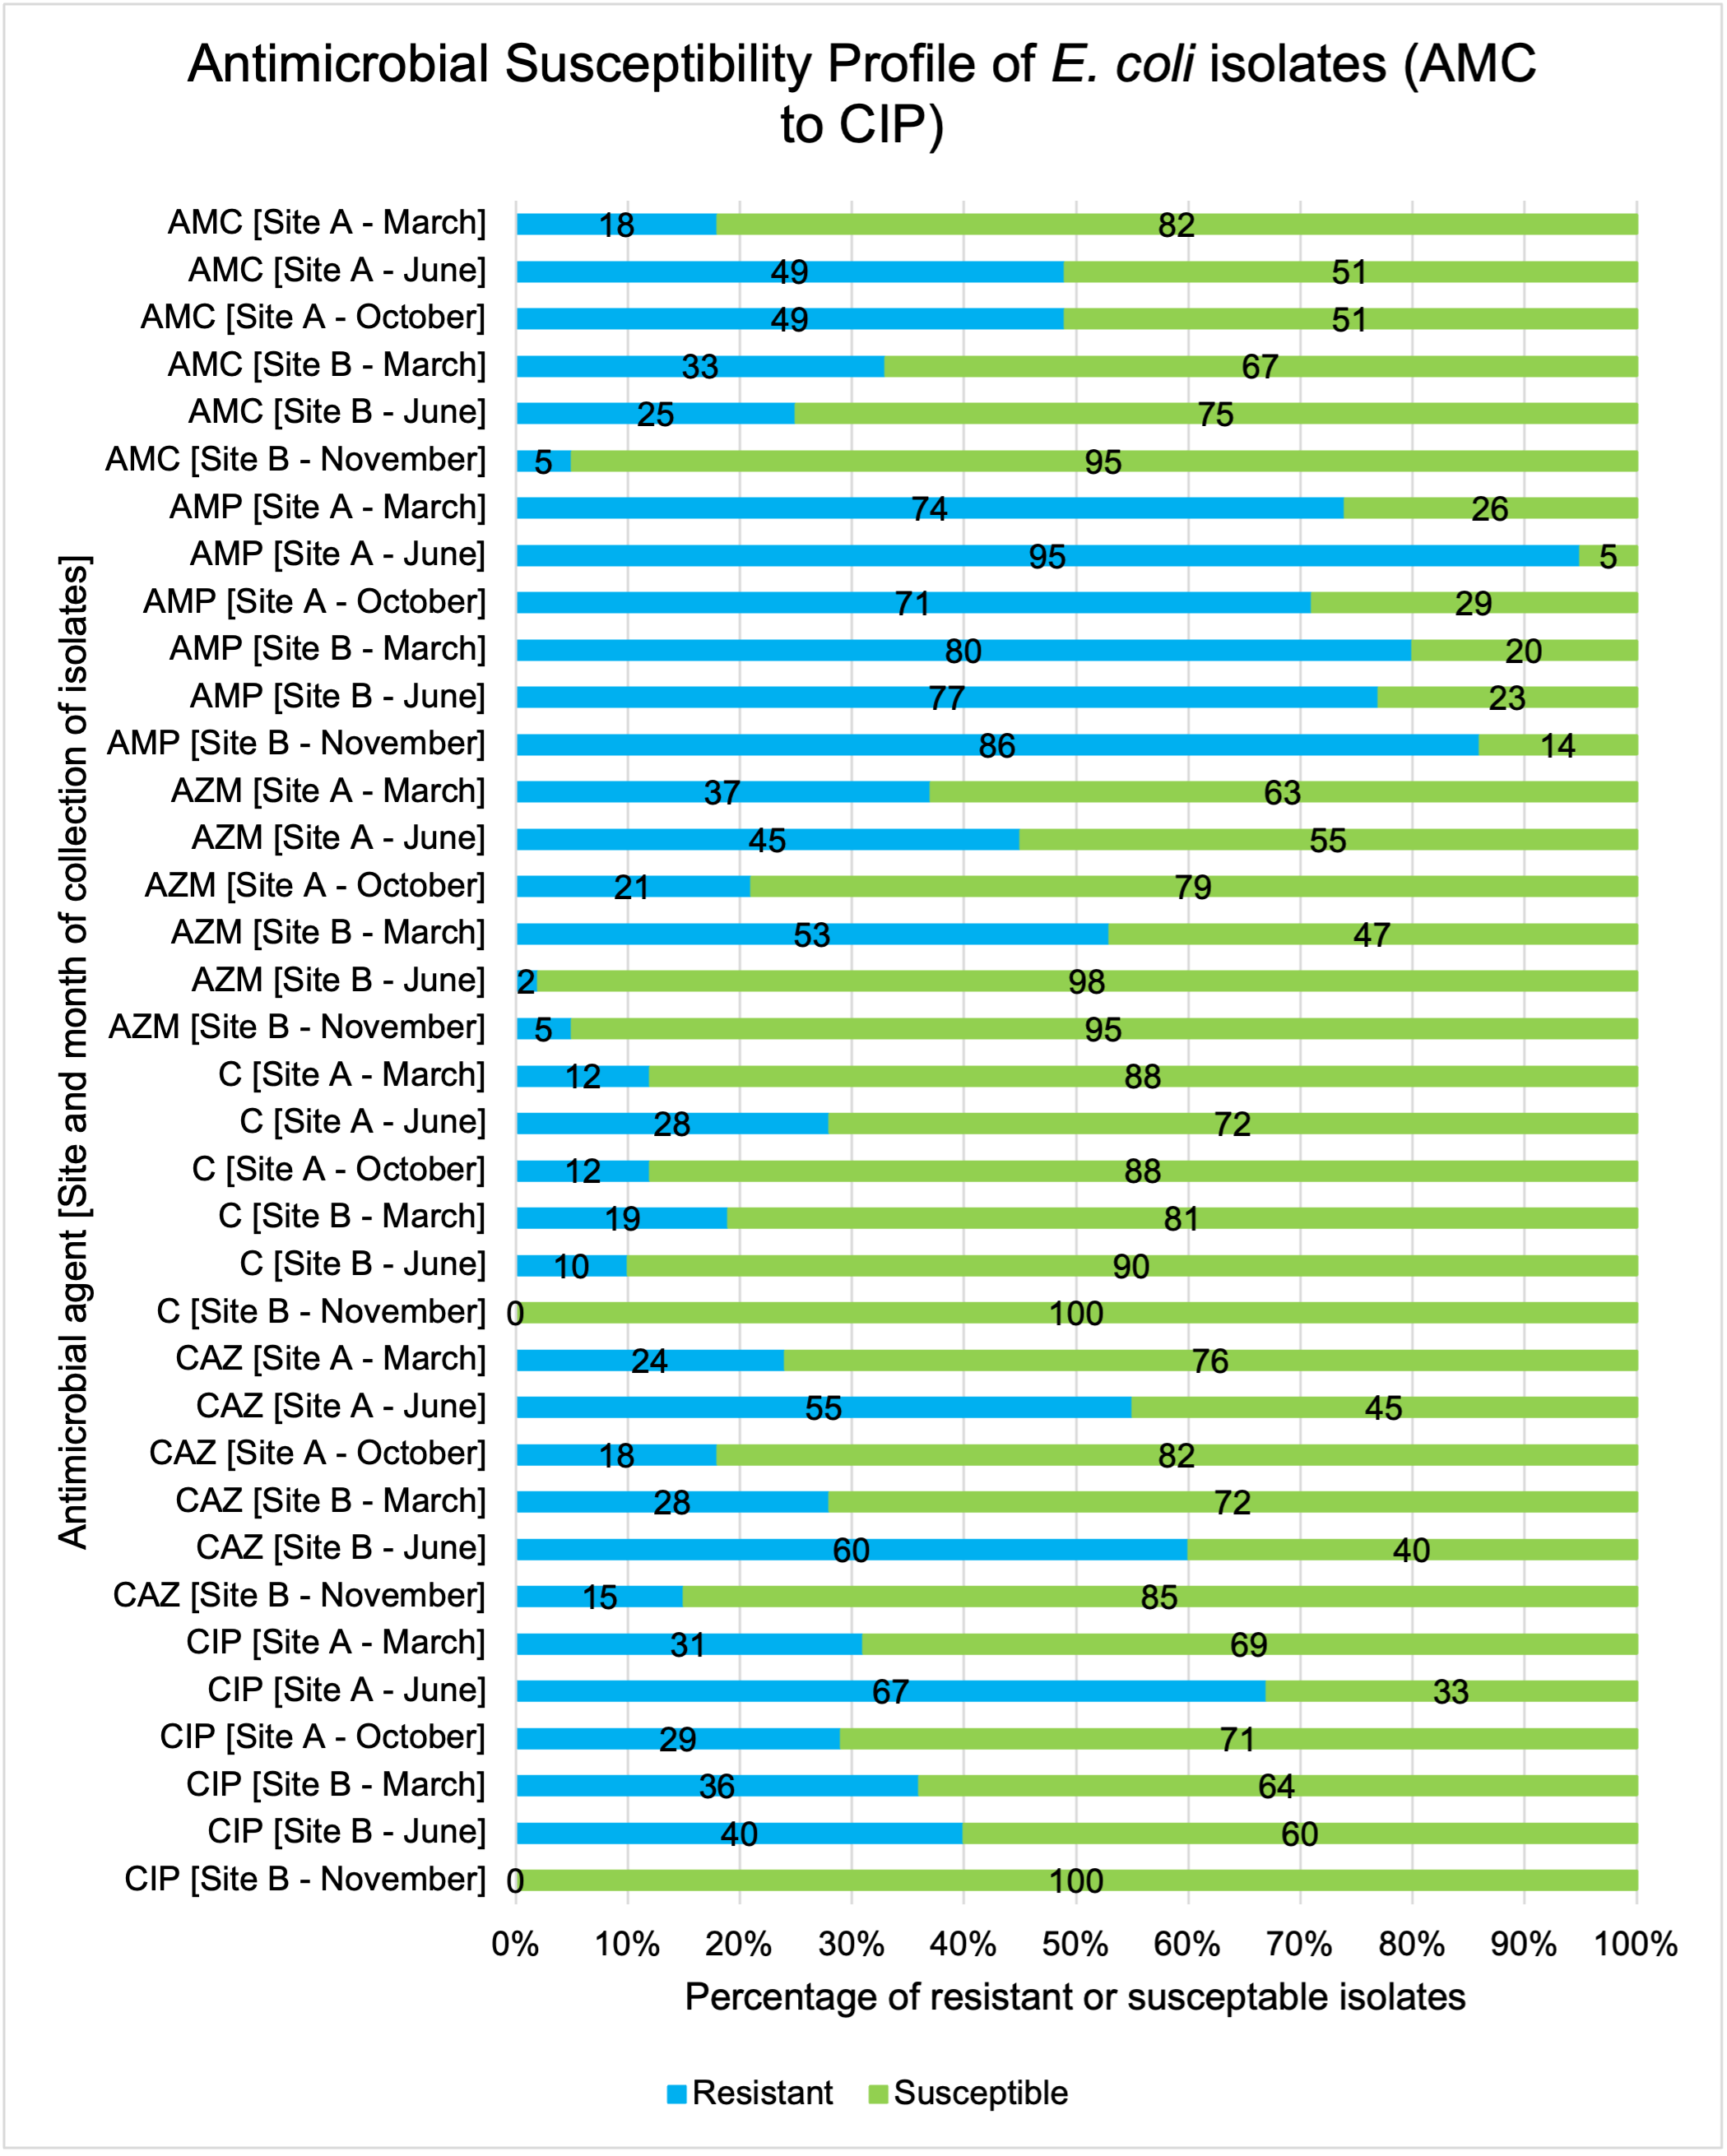
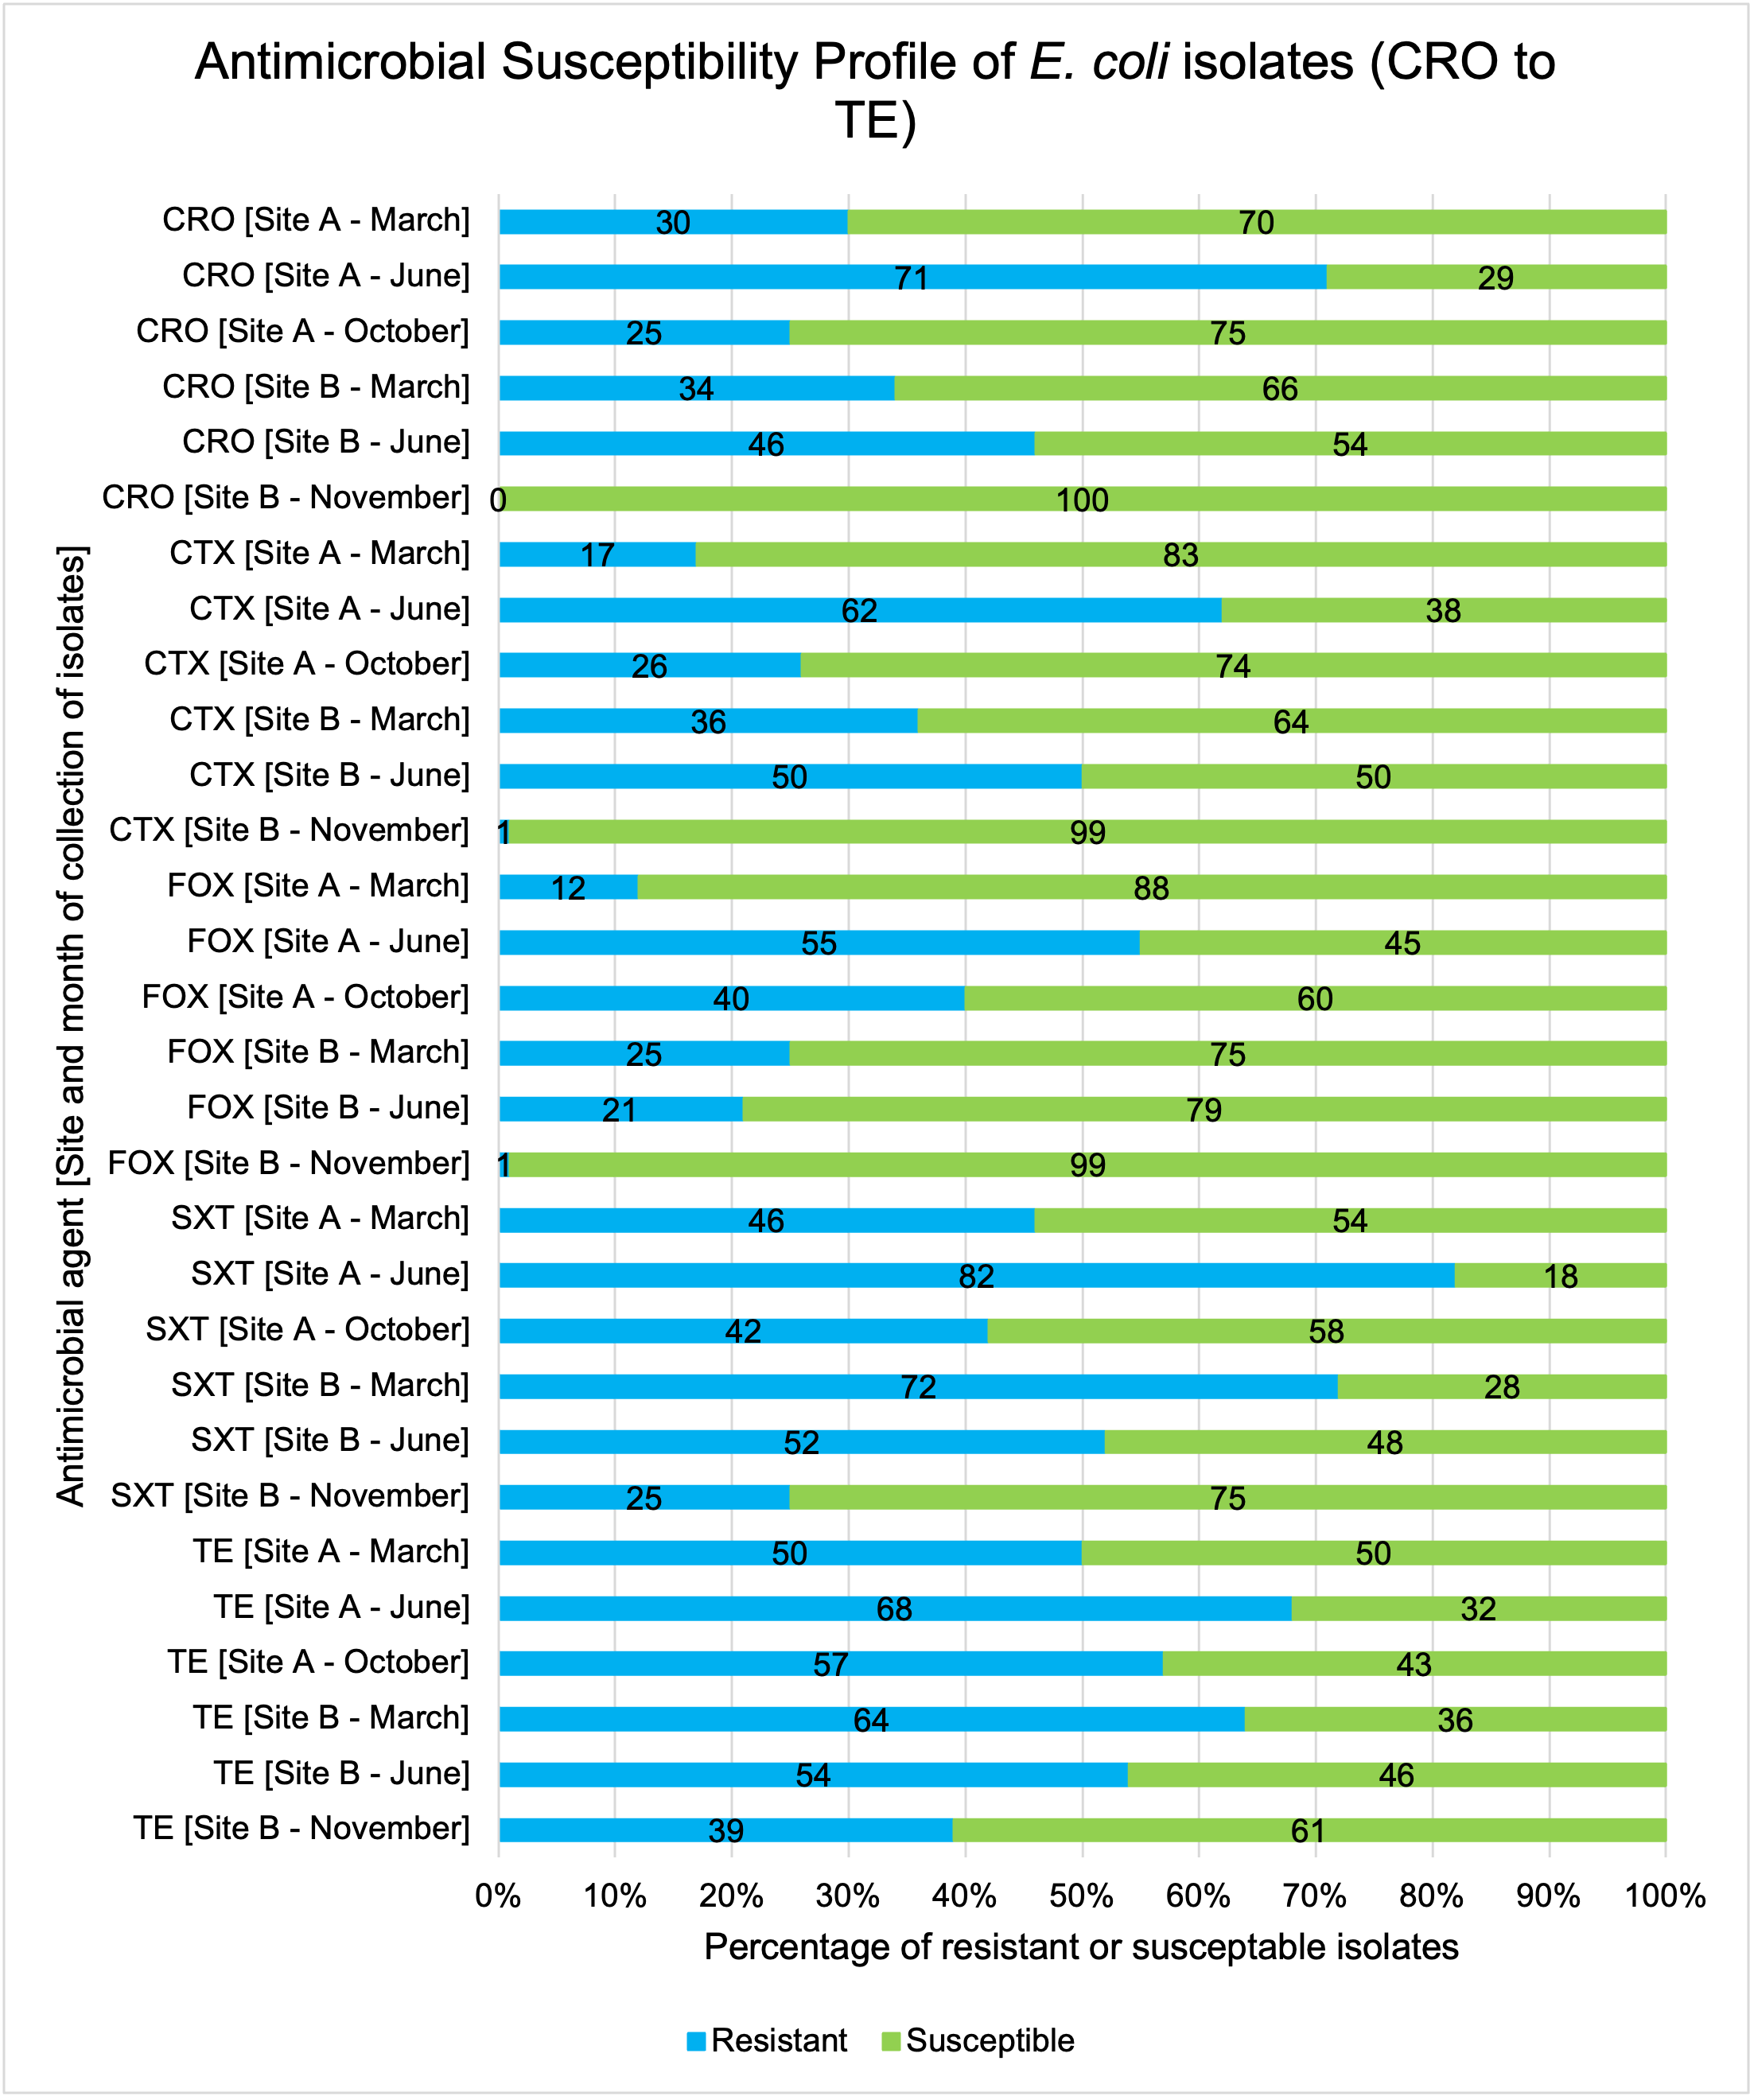
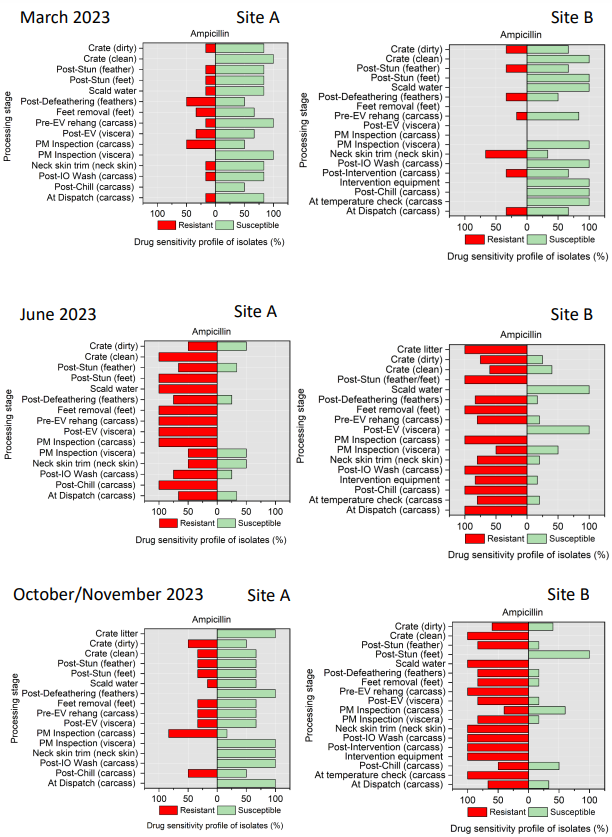
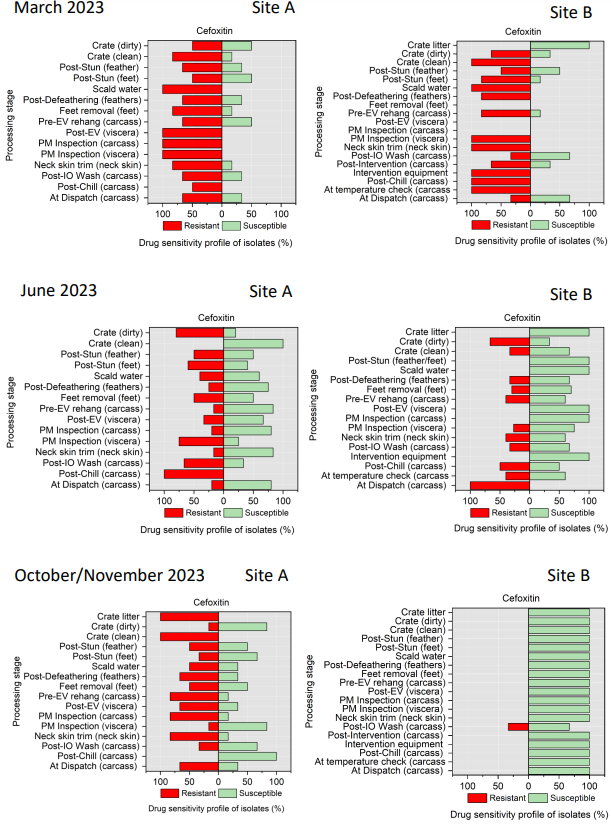
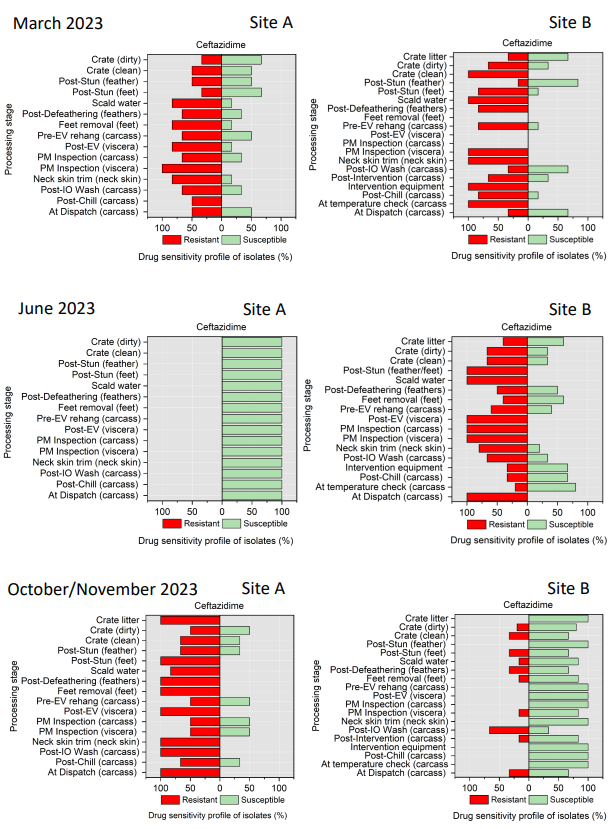
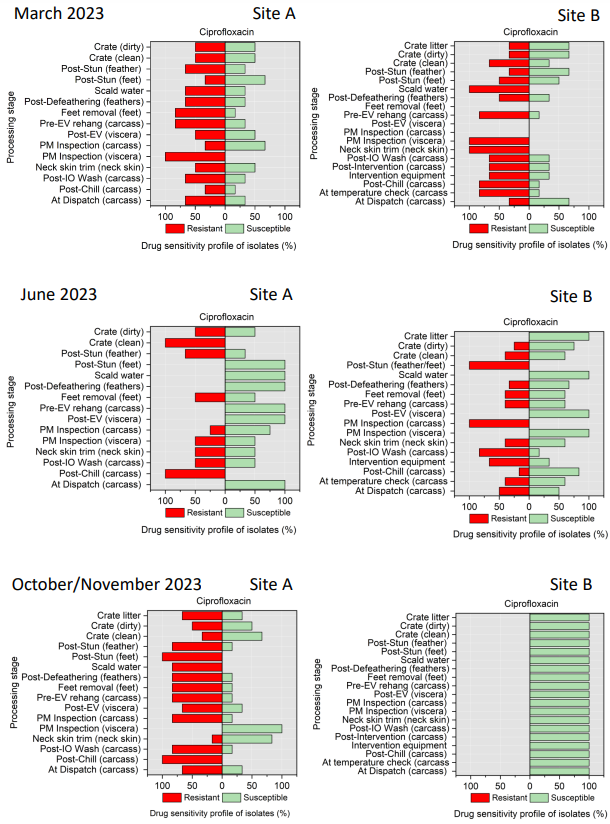
The resistance of Campylobacter spp. isolates to 5 antimicrobial agents were tested and E. coli isolates were tested against 11 antimicrobial agents. Of the Campylobacter spp. isolates, we recorded the highest overall percentage resistance to tetracycline (53%) and lowest overall percentage (7%) resistance to erythromycin. For E. coli isolates, we recorded the highest overall percentage resistance to ampicillin (80%) and lowest overall percentage (13%) resistance to chloramphenicol.
-
Approximately 7% of the Campylobacter jejuni isolates were resistant to three or more classes of antimicrobial (tested against examples of four different classes).
-
Approximately 60% of the E. coli isolates were resistant to three or more classes of antimicrobial (tested against examples of eight different classes).
-
Analysis of the genetics of cultured C. jejuni and E. coli isolates (using whole genome sequencing [WGS]) showed that both C. jejuni and E. coli isolates tested were genetically diverse across sampling points and periods. However, E. coli displayed greater variability in sequence types (STs). In total, 5 C. jejuni STs (3 recognised) and 40 E. coli STs (36 recognised) were identified.
-
Four C. jejuni STs (21, 262, 5136, 6175) were identified across sites, with ST 6175 being most prevalent. All STs isolated carried resistance genes for ampicillin or tetracycline, and a gyrA gene mutation conferring resistance to ciprofloxacin and nalidixic acid.
-
E. coli isolates from both sites showed high genetic diversity with 36 distinct STs identified. Prevalent STs included 10, 155, and 6448. Isolates carried multiple resistance genes and plasmids (genetic elements that can transfer genes between different organisms), with blaTEM and tet(A) genes being common. Plasmid types varied across sampling periods, with Col156, Inc1-l(Alpha), and P0111 being frequently observed.
-
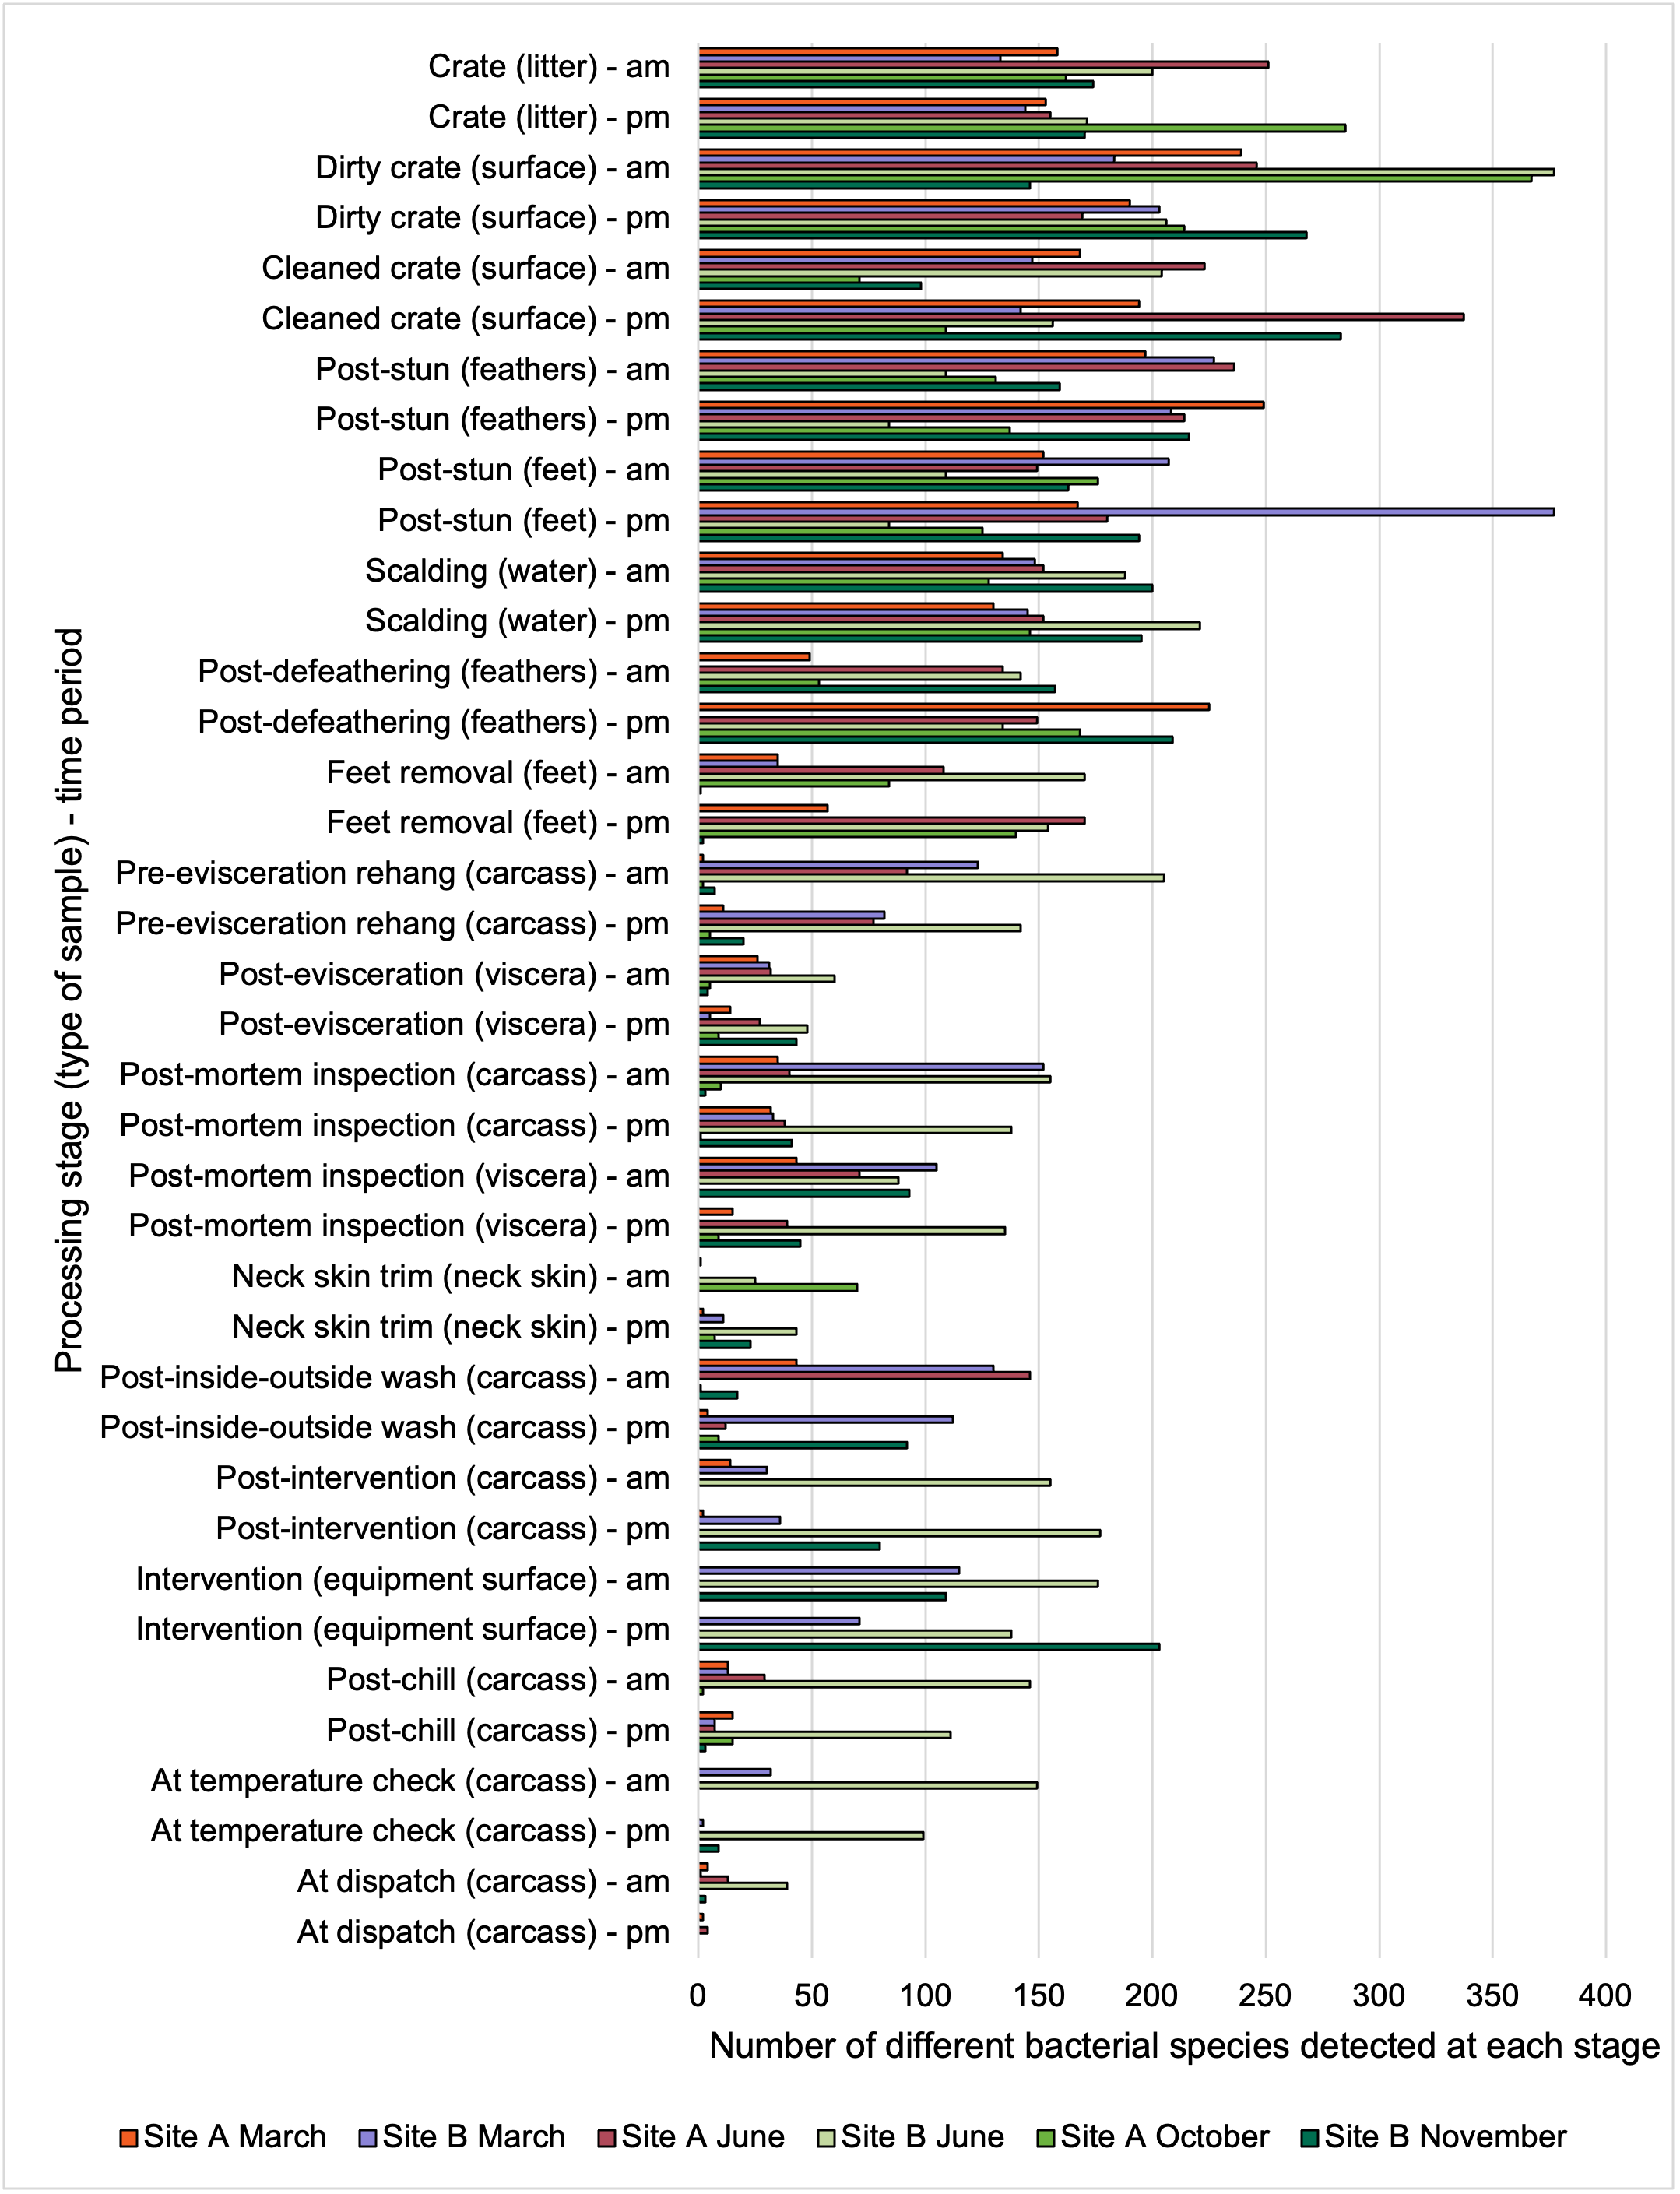
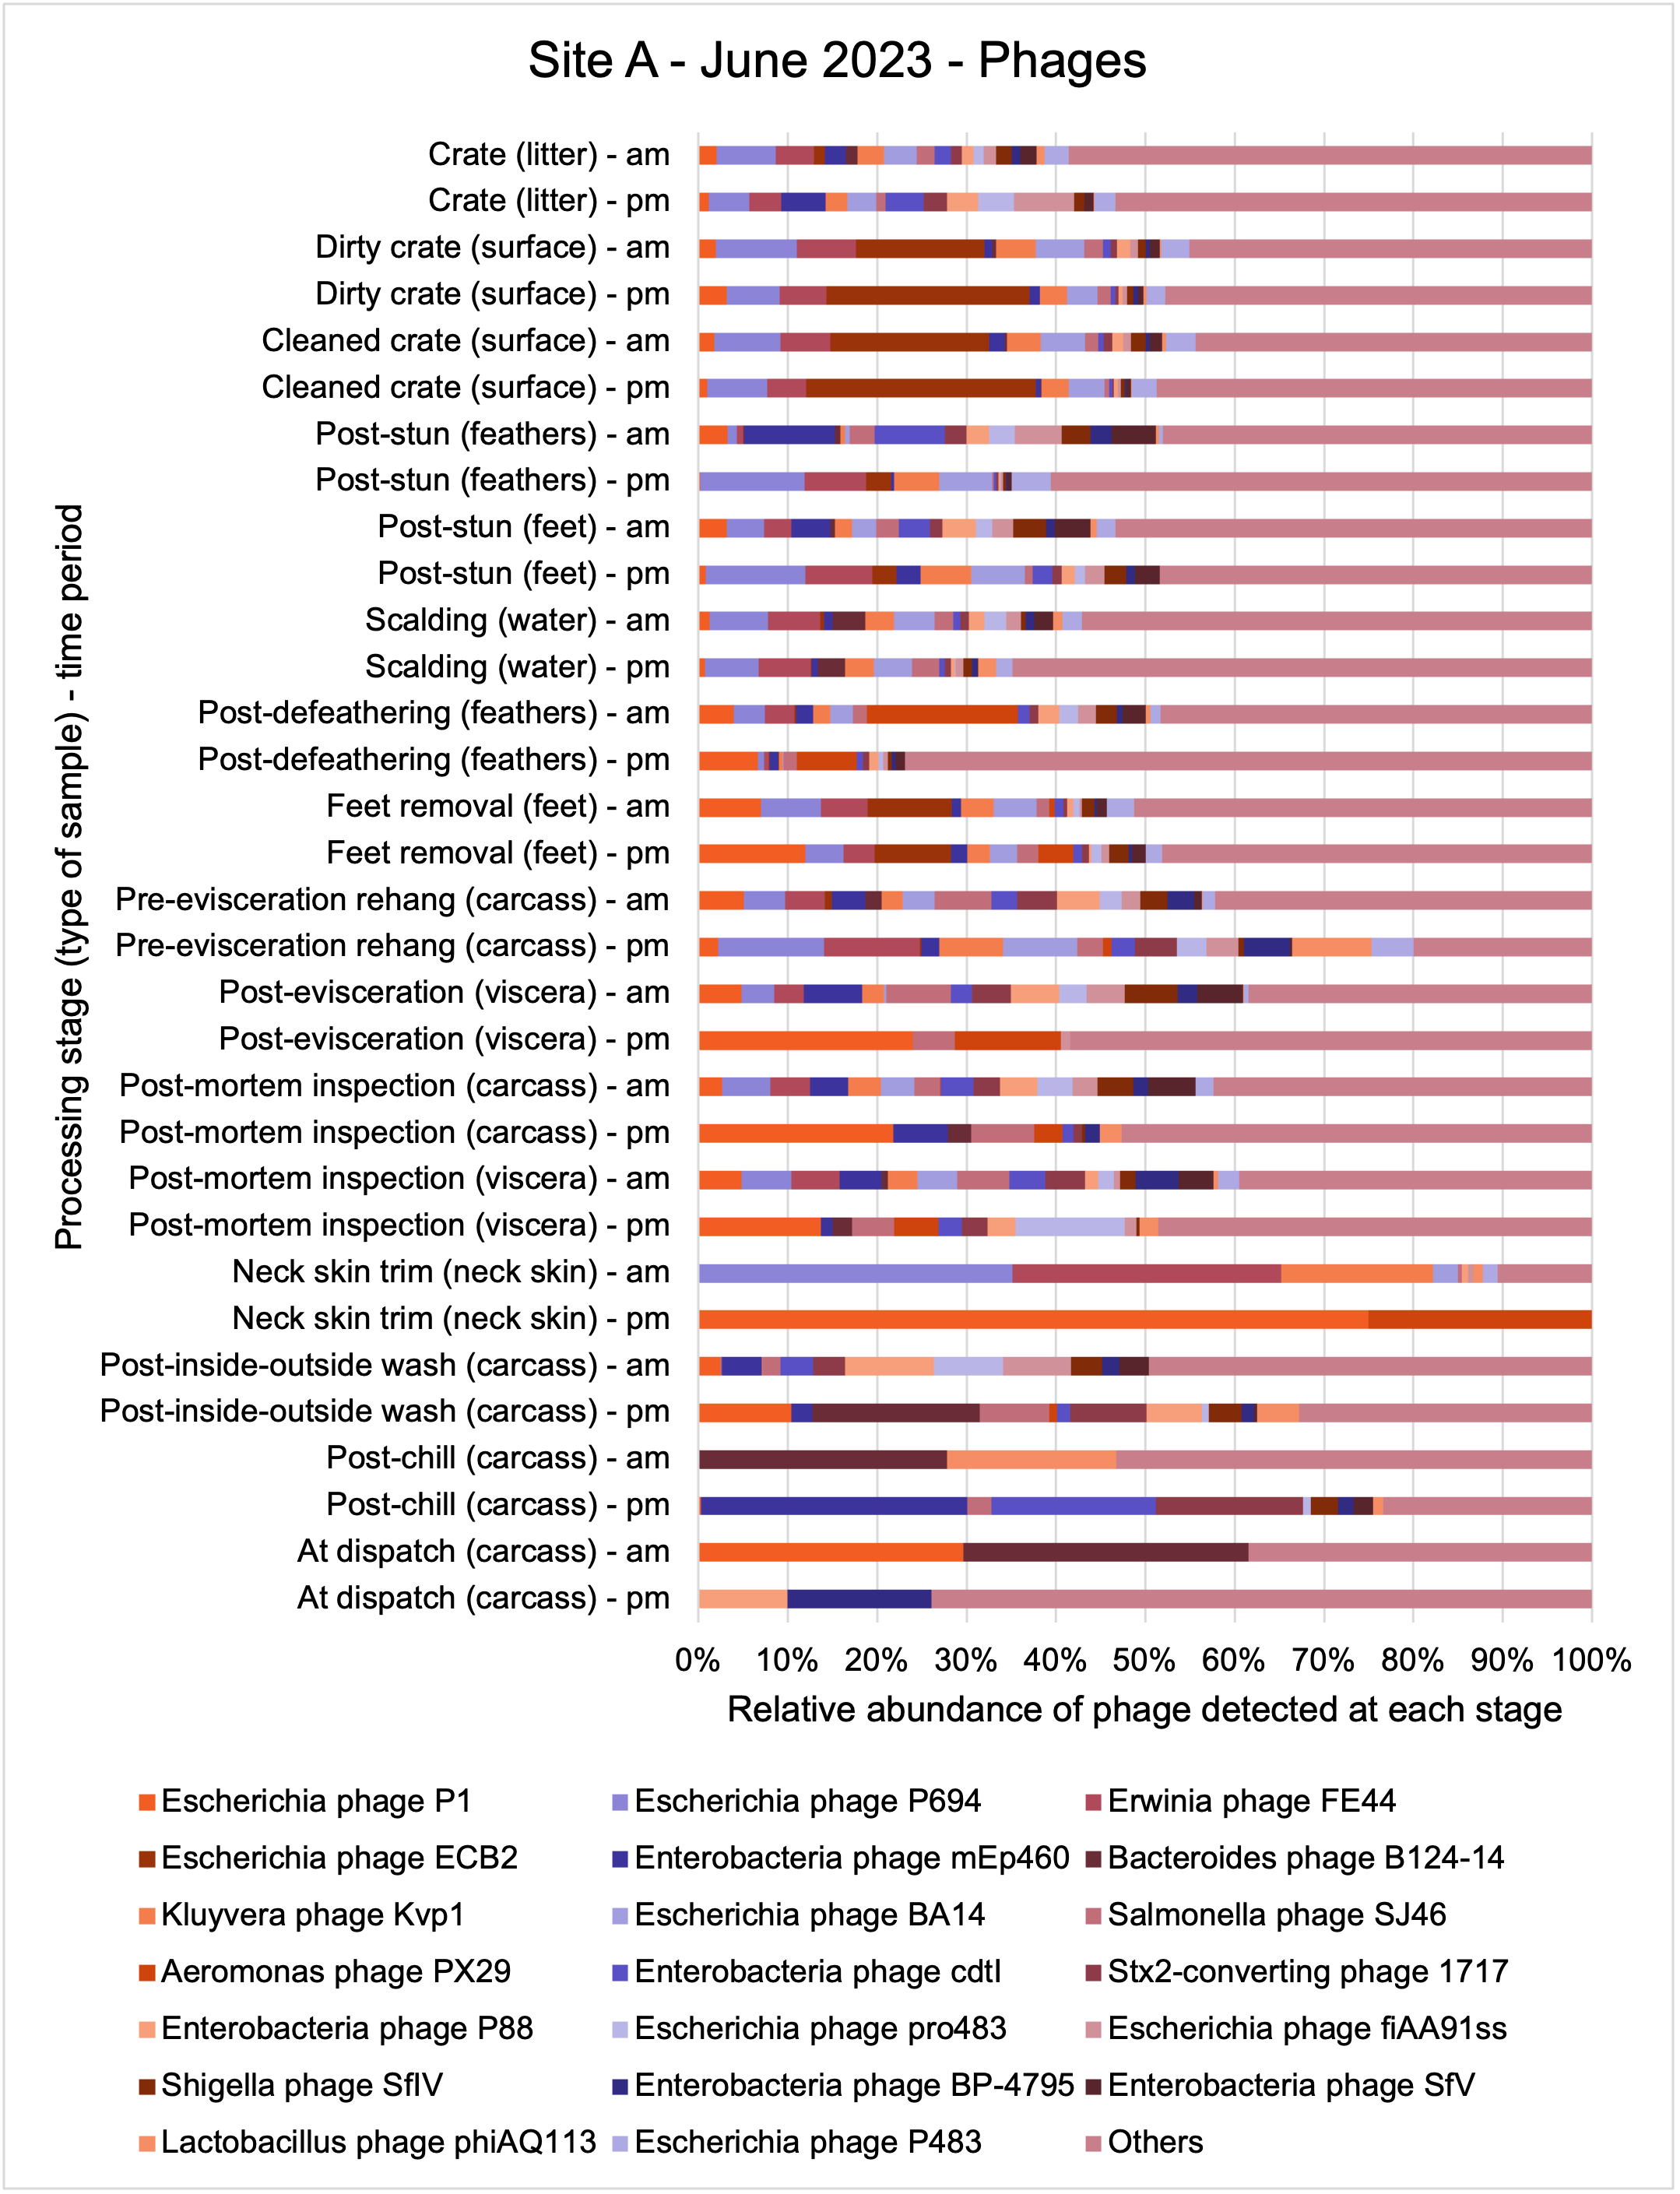
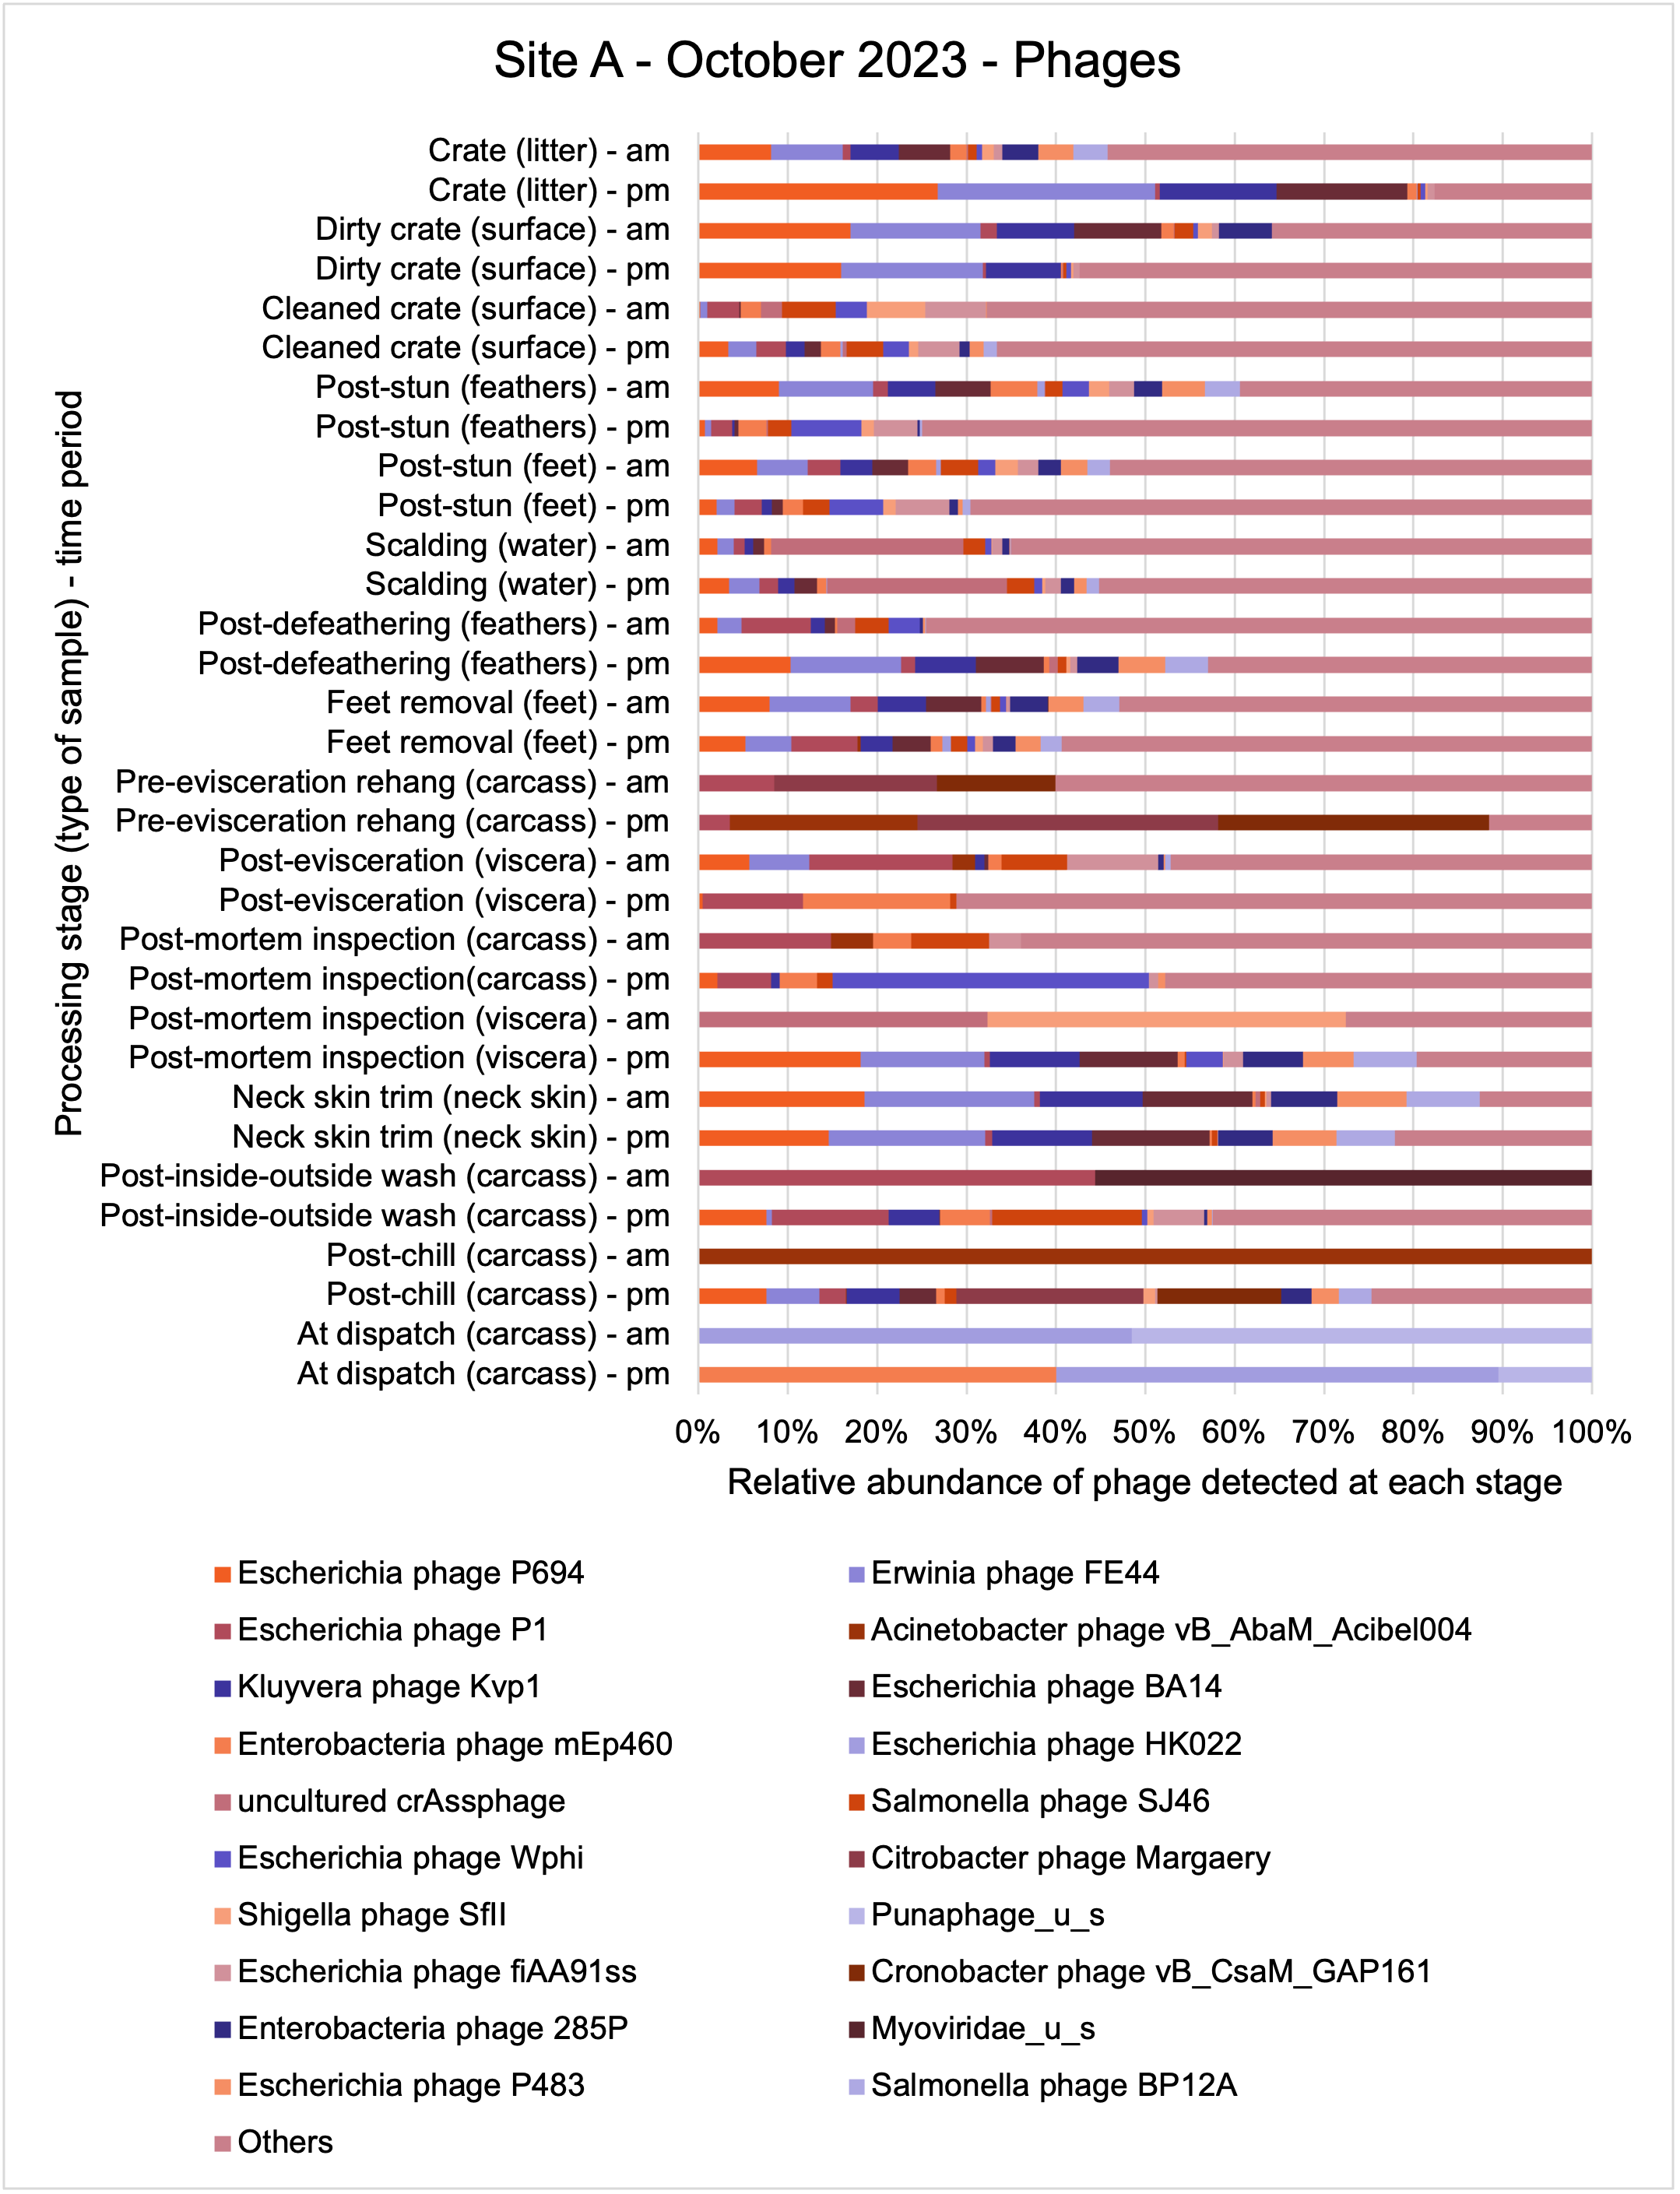
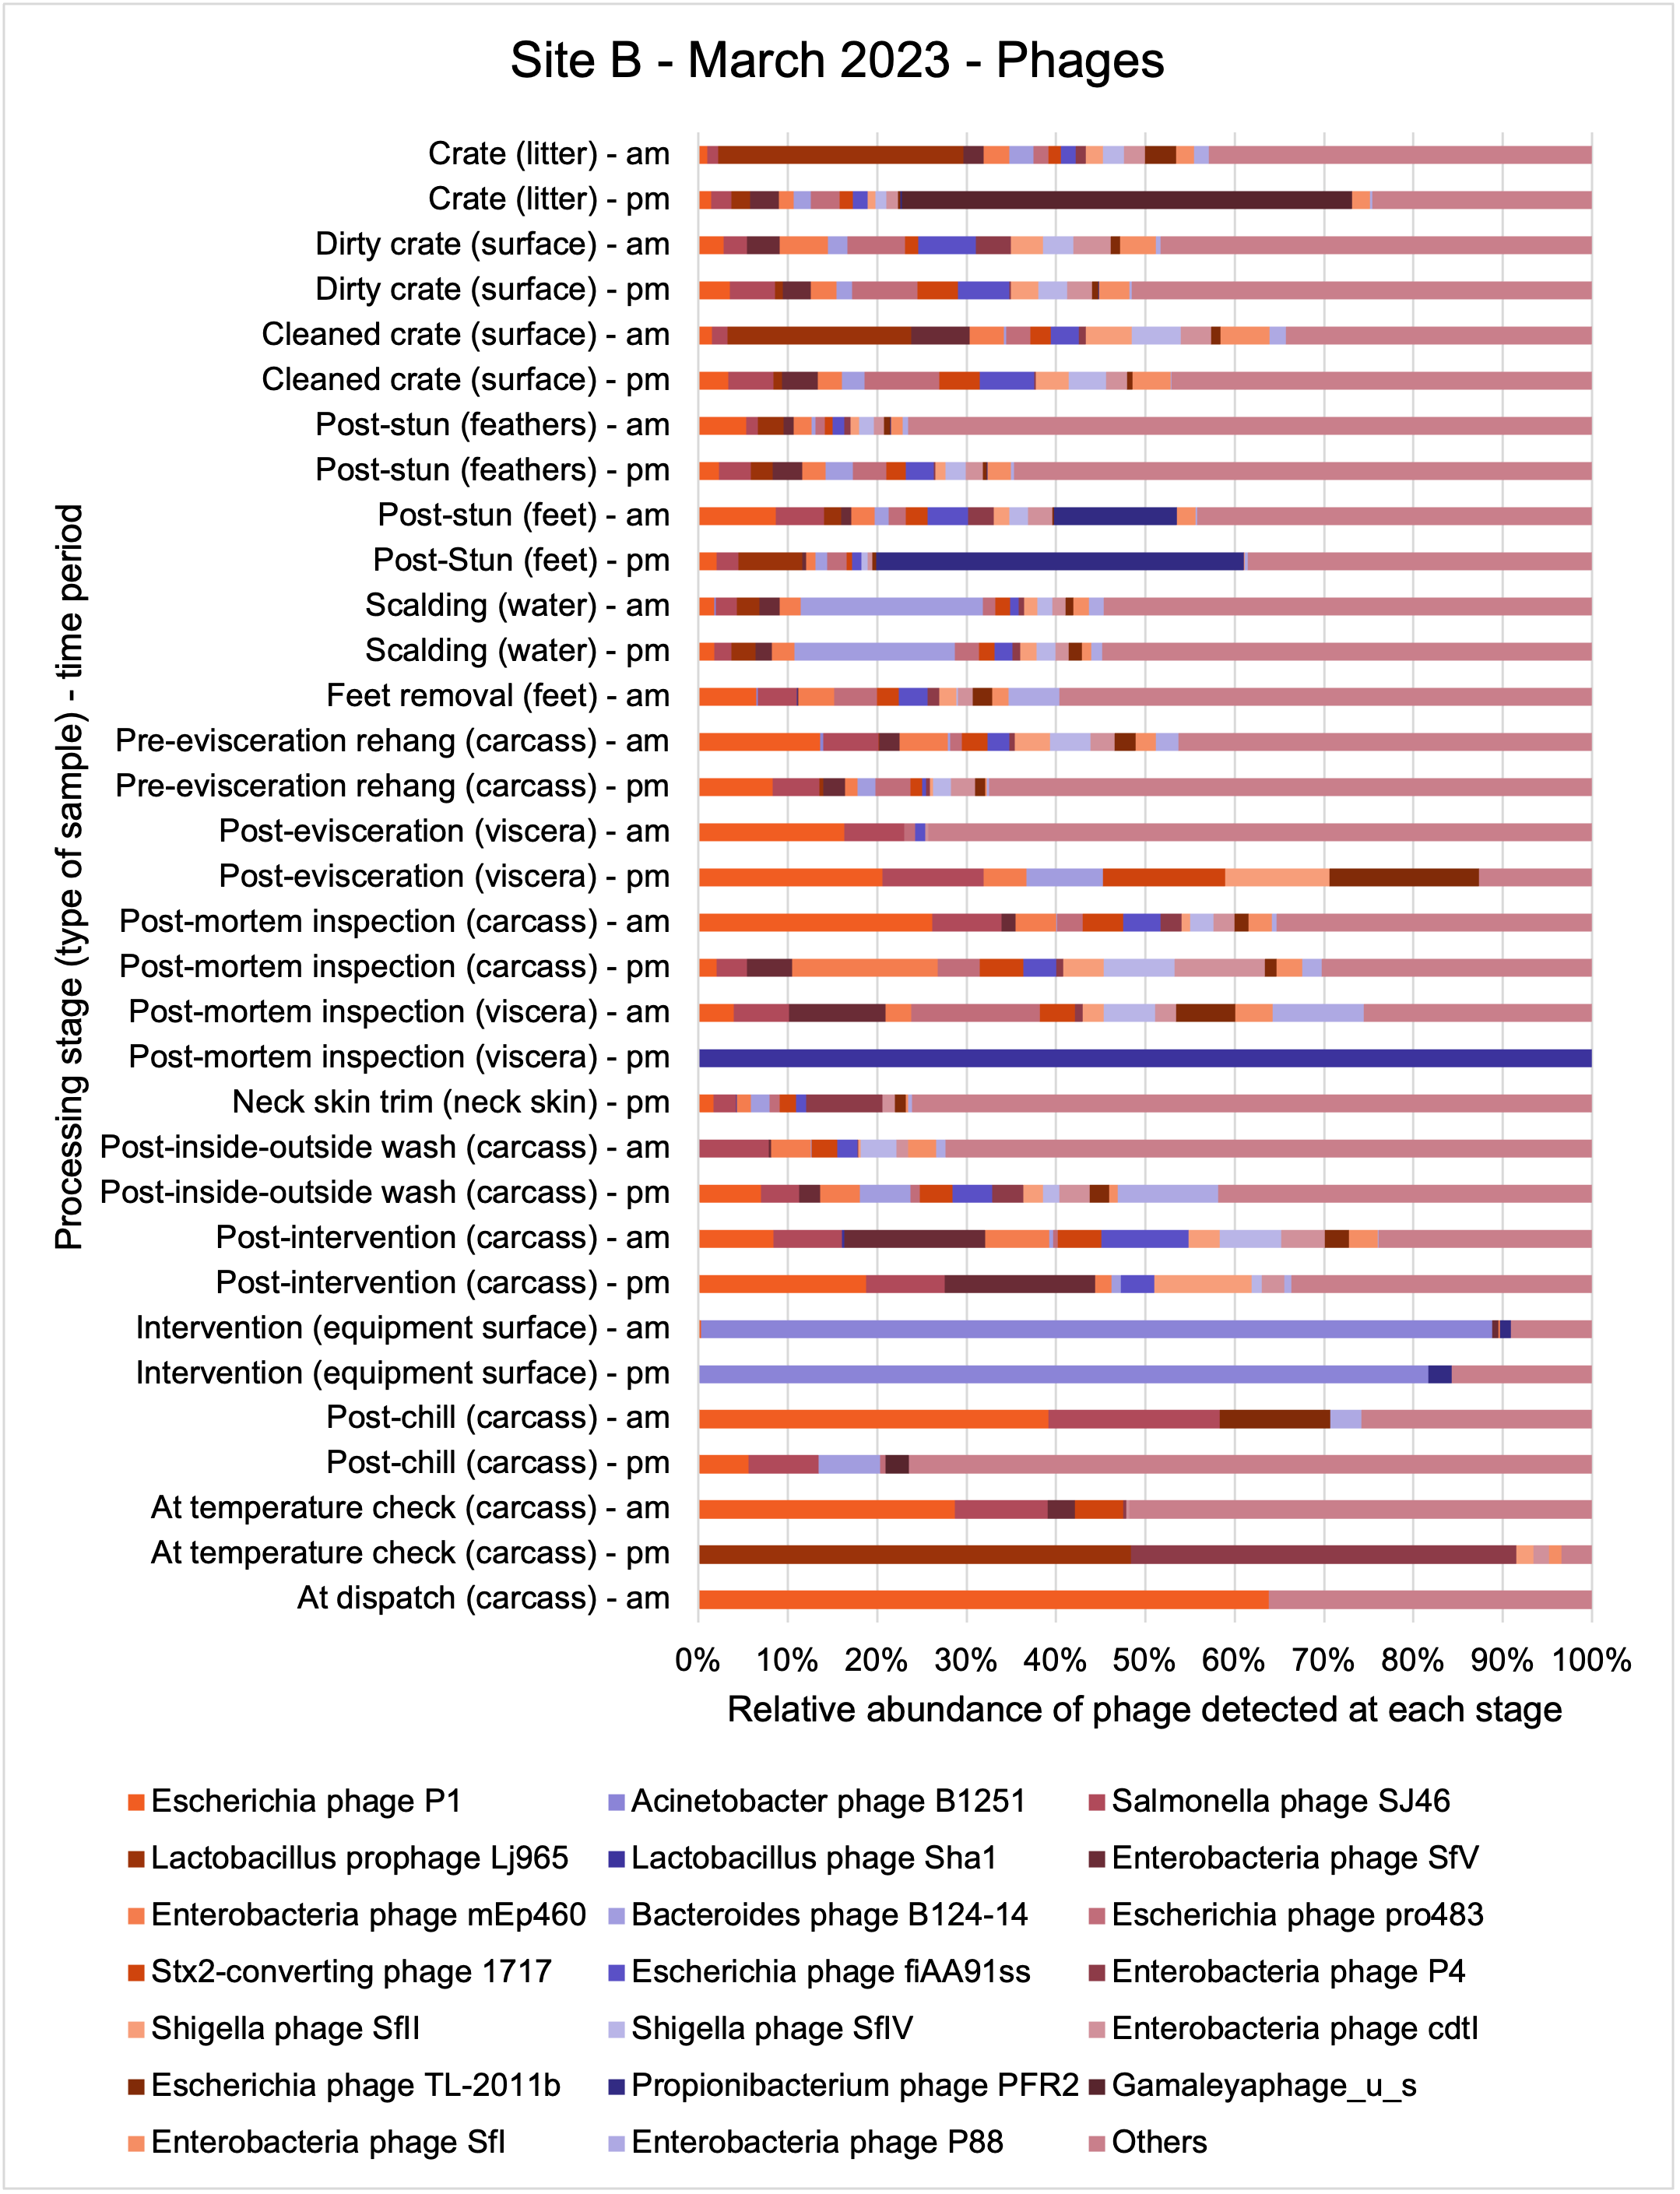
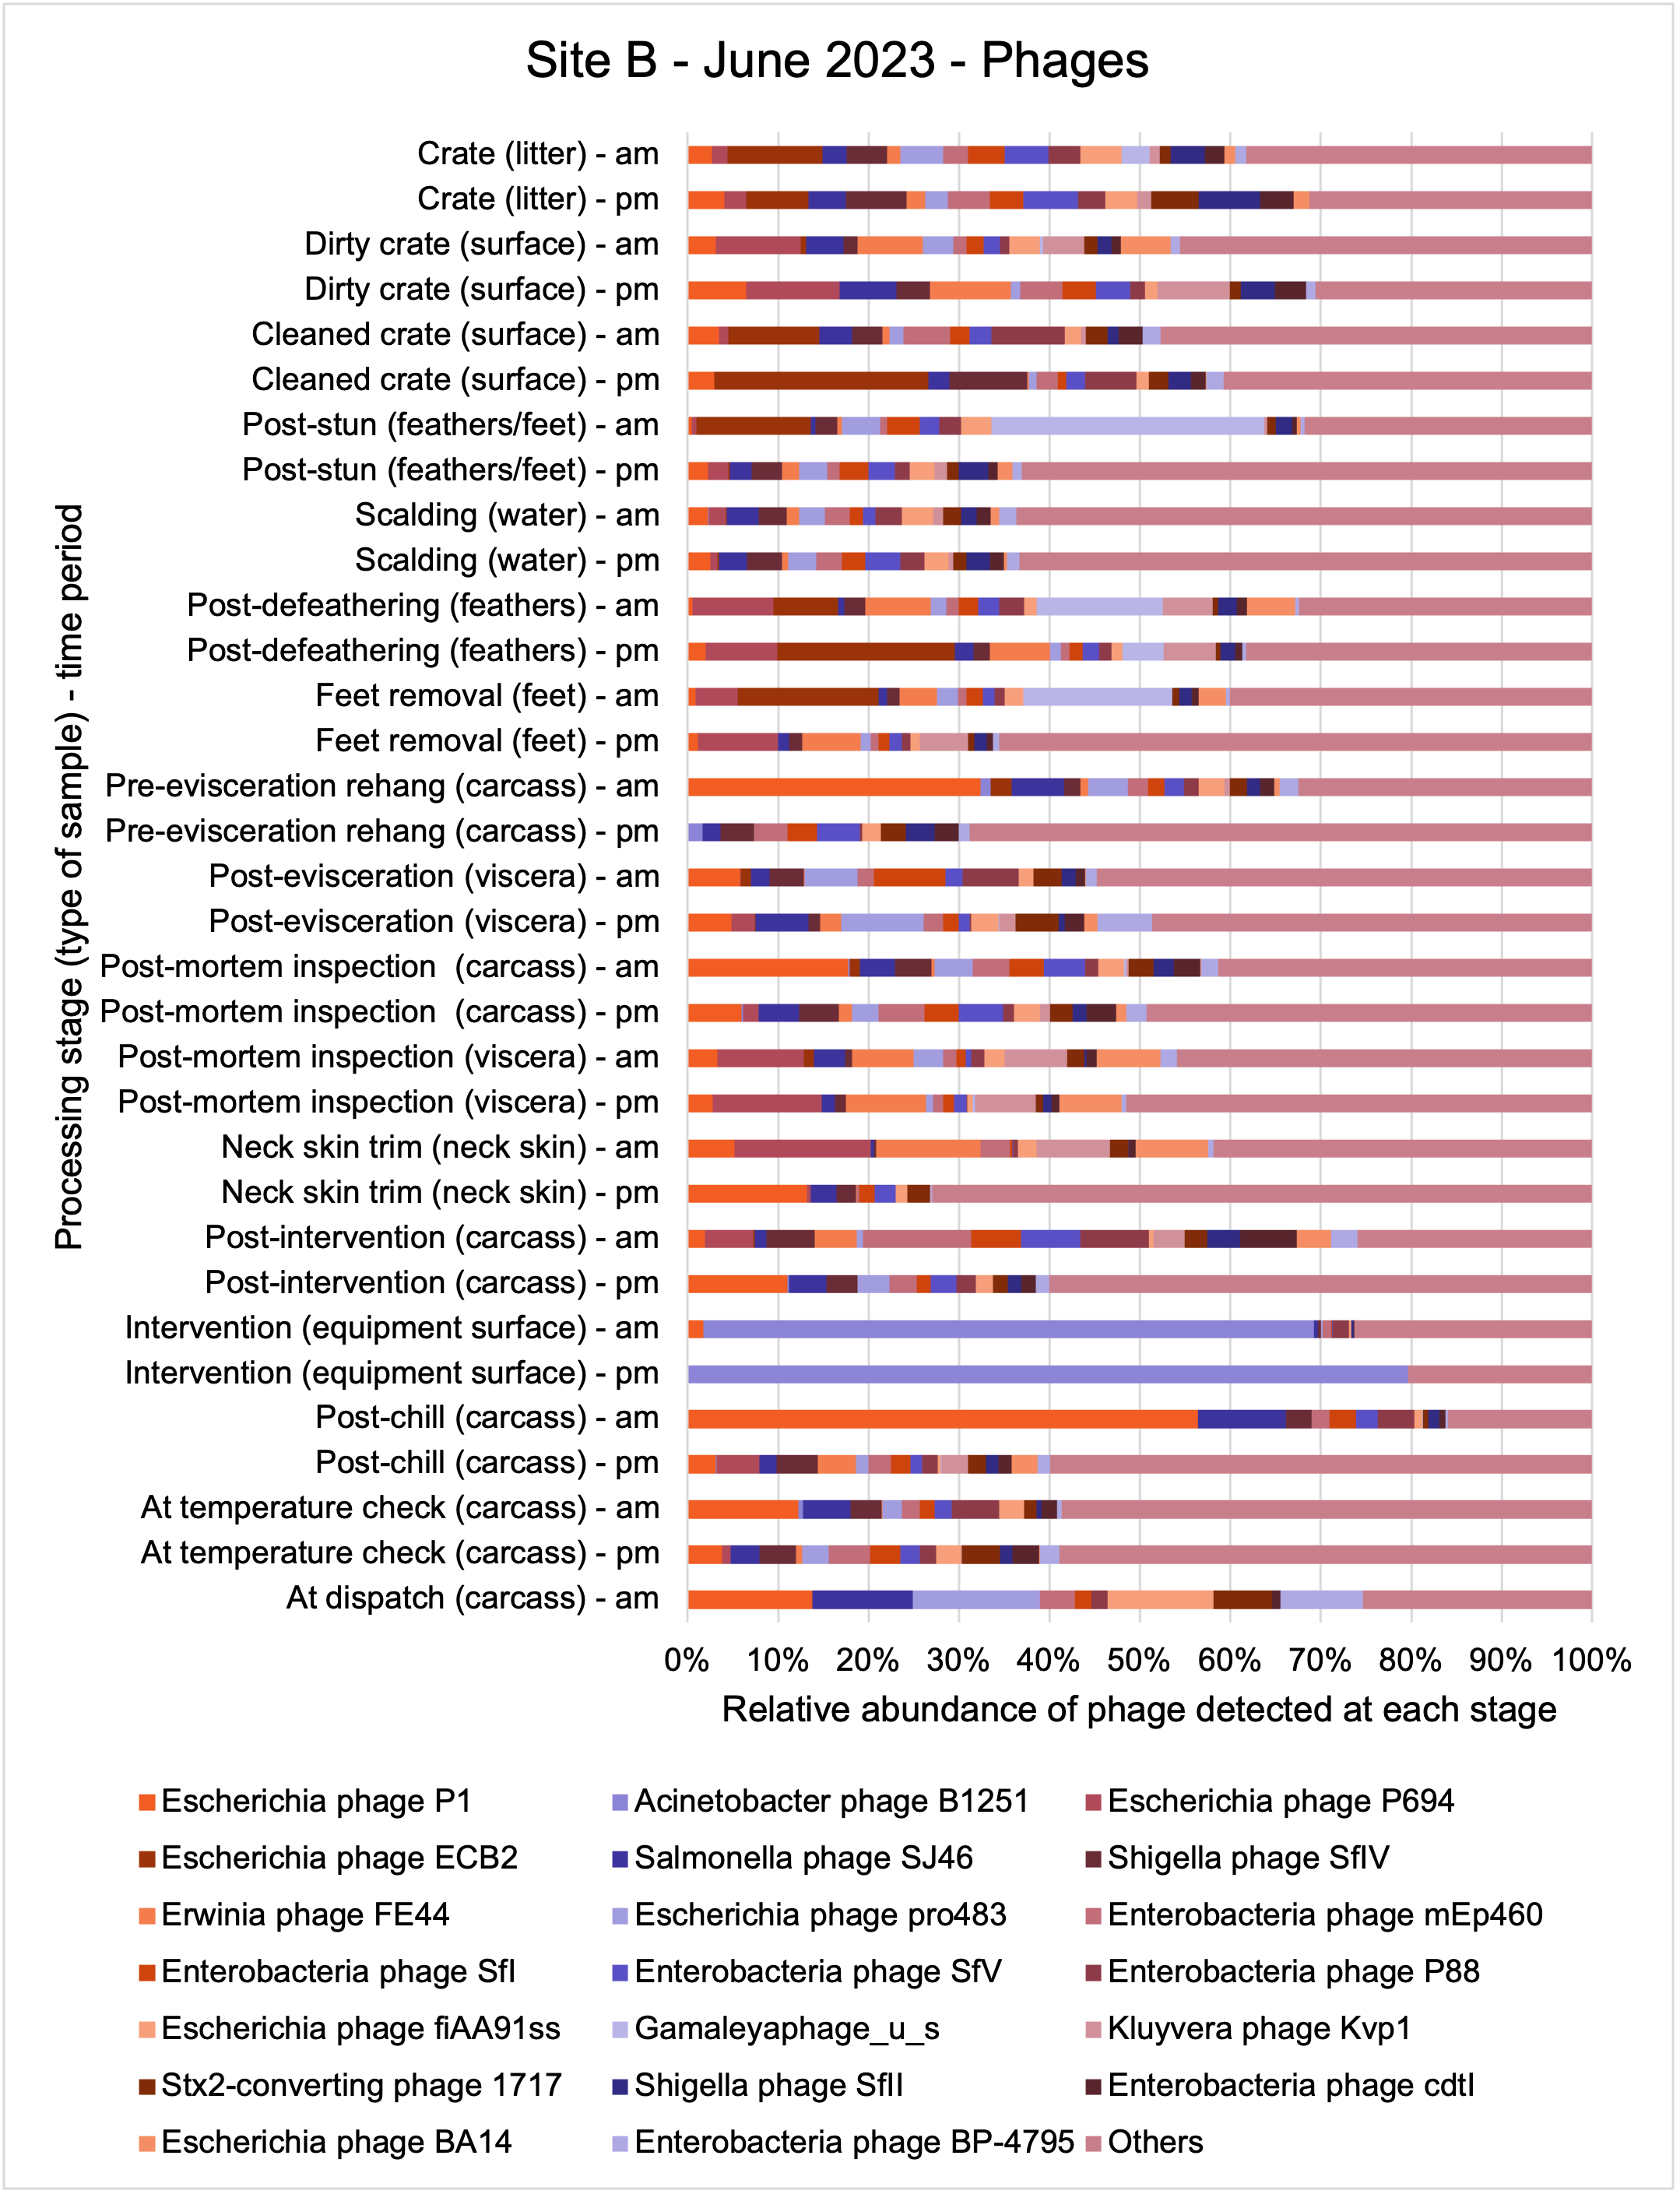
An analysis of samples taken at different processing stages using shotgun metagenomic sequencing (which detects DNA from all organisms within a sample) showed a wide diversity of bacteria, ARGs, and bacteriophages (naturally occurring viruses than target bacteria, usually called phage) present at both poultry sites on the different sampling periods.
-
Overall, there were similarities in the composition of the microbiomes at both sites, though there were some differences in the overall diversity (number of different bacteria, ARGs, or phage) between both sites and some seasonal differences (though mainly only at one site).
-
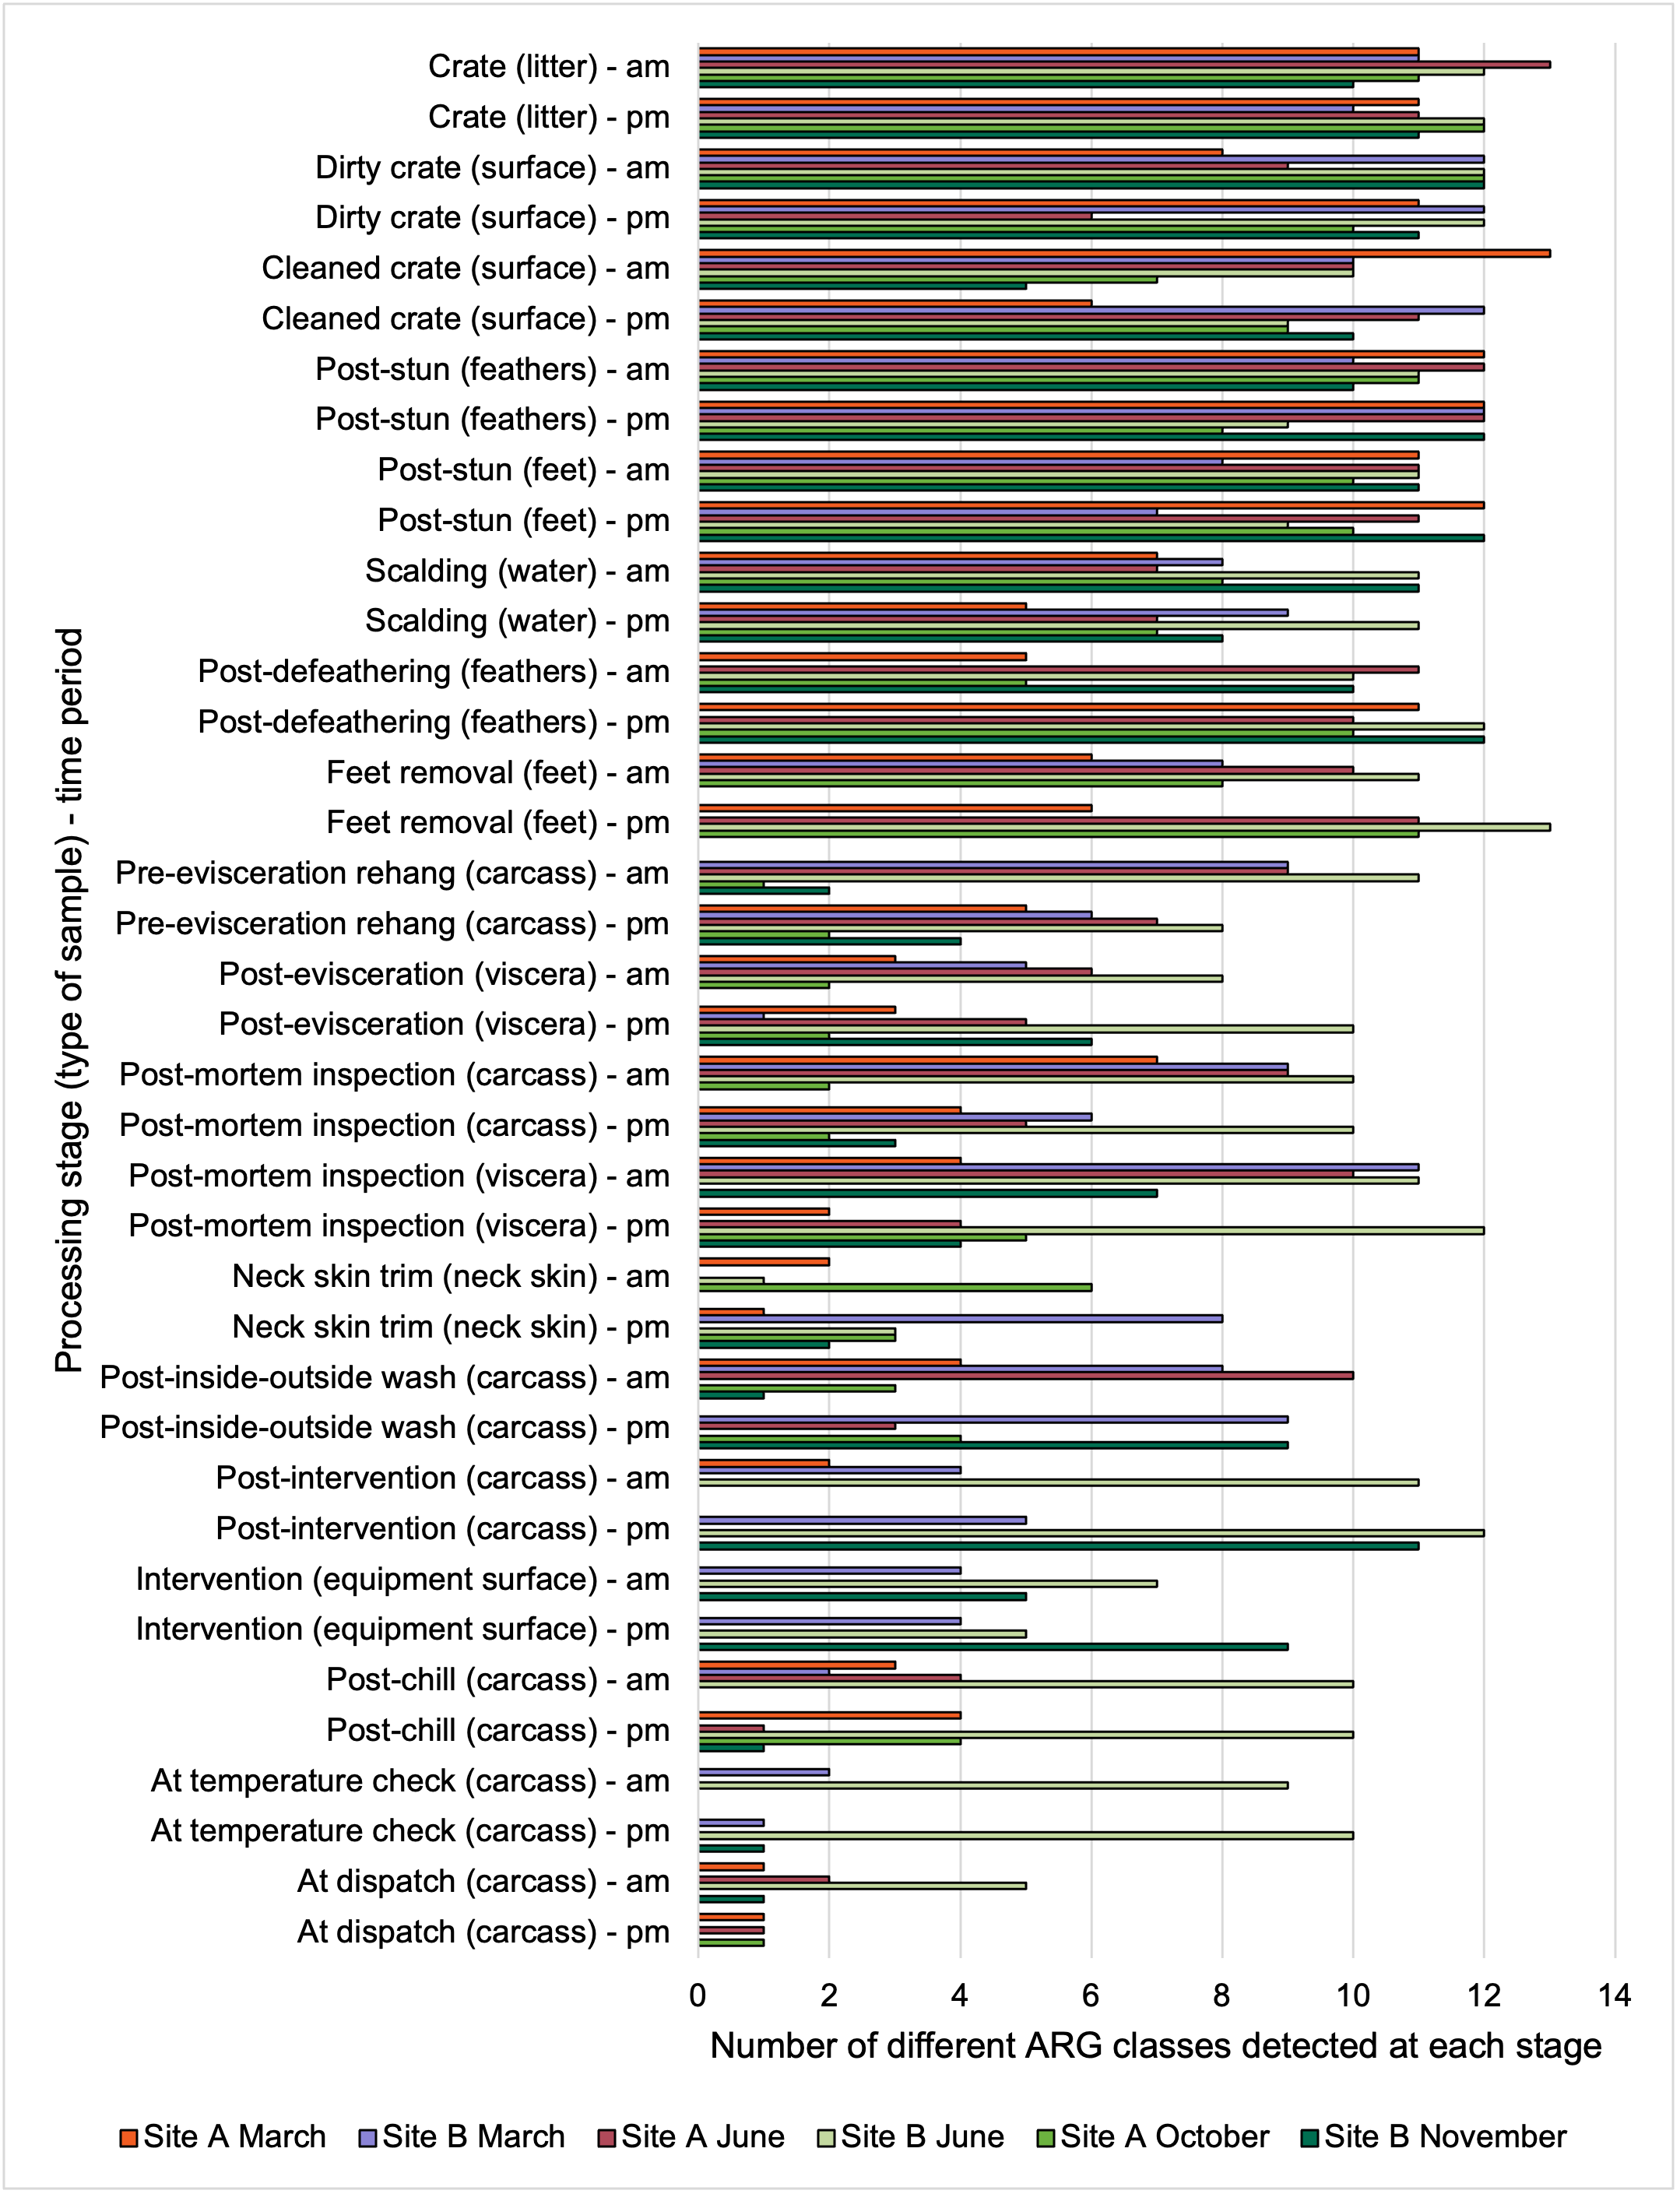
Interestingly, the most abundant bacteria, ARGs, and phages were the same (though not always in the same order) at both sites and prevalent throughout processing. However, the overall diversity (number) of different bacteria, ARGs, and phages present at different processing stages reduced during processing at both sites.
Overall conclusions
Combining traditional culture methods with modern genomics dependent on DNA sequence analysis of bacteria and ARGs, we created a detailed map of bacterial and gene presence in the poultry processing units under investigation. Our findings using traditional methods showed that while target bacteria like Campylobacter spp. and E. coli were initially present in birds entering the plants, their presence and numbers significantly decreased along the poultry processing line especially following specific procedures such as defeathering and evisceration (internal organ removal). The prevalence of Campylobacter spp. was generally lower than E. coli overall in the samples collected. Specifically, only 65.1% of the total samples from various stages tested positive for the presence of Campylobacter spp., whilst 95.6% of total samples were positive for E. coli.
Antimicrobial resistance testing revealed varying patterns among Campylobacter spp. and E. coli isolates. Campylobacter spp. showed highest resistance to tetracycline (53%) and lowest to erythromycin (7%), while E. coli exhibited highest resistance to ampicillin (80%) and lowest to chloramphenicol (13%). Notably, 7% of Campylobacter spp. and 60% of E. coli isolates were resistant to three or more antimicrobial classes, indicating multidrug resistance (MDR), particularly in E. coli.
Genetic analysis via WGS revealed diverse C. jejuni and E. coli isolates across sampling points. Five C. jejuni STs were identified, with ST 6175 most prevalent, all carrying resistance genes. E. coli showed higher diversity with 36 STs, commonly carrying blaTEM and tet(A) genes. Various plasmid types were observed in E. coli isolates. Genomic analysis of parallel samples confirmed reductions in bacterial and associated ARG diversity through the processing chain, suggesting that the hygienic measures implemented during the poultry processing stages can effectively reduce both bacteria and ARGs. The fate of some resistant bacteria appears less certain and for reasons unknown persist throughout the poultry processing stages. It should be noted that this study is based on only two large scale UK chicken processing plants and may not be a reflection of all chicken processing plants in the UK. Further studies are needed to confirm these results and assess the role of poultry products in spreading AMR/ARGs of concern to human health.
Executive Summary
The overall aim of this project was to access the impact that processing has on the presence and transfer of antimicrobial resistant Campylobacter spp. and E. coli and their associated genes on chicken meat. There is a growing concern that some AMR transmission to humans occurs via the food chain and food processing environments and that these could act as potential hotspots for AMR acquisition and spread. However, relatively little is known about the role of the food chain in the transmission of AMR bacteria, including the transmission and prevalence of AMR bacteria in chicken and chicken products before retail. Since poultry accounts for half of the meat eaten in the UK (BPC, 2018) it represents potentially a significant reservoir for AMR.
Key findings
Although only few studies have focused on the transmission of AMR bacteria or genes during poultry processing, existing research suggests that AMR and ARGs in incoming birds are primarily influenced by farm-level factors rather than in-plant operations leading to cross contamination. There is very limited evidence on the sequential transmission of AMR bacteria and genes during chicken slaughter or the persistence of AMR bacteria and genes in the processing environment. While some studies indicate that ARGs can persist in processing environments and contribute to cross-contamination, the evidence is scarce. Additionally, the impact of cutting operations and physical interventions such as steam on AMR or ARGs in UK plants remains largely unexplored.
This study took samples along the processing chain of two similar sized large scale UK chicken processing sites producing whole chickens and chicken meat for major UK retailers on 3 occasions during the year (March, June, and October/November).
In this study of 376 samples from most stages of poultry processing plants, overall, 65.1% were positive for Campylobacter and 95.6% for E. coli. Levels of Campylobacter spp. ranged from 1.00±0.0 to 3.9±0.5 Log10 CFU/sample, while E. coli levels ranged from 2.0±0.0 to 8.3±0.2 Log10 CFU/sample, with chicken litter (pre-processing stage) showing the highest levels for both bacteria. Both organisms were detected at various processing stages in both plants, with higher counts in earlier stages. Some processing stages yielded no detectable Campylobacter spp. or E. coli in either plant. Interestingly, Campylobacter spp. levels decreased from samples along the processing stages, to non-detectable levels while E. coli, although showing a general decrease, remained detectable in samples from later processing stages.
Out of testing against 5 antimicrobial agents, Campylobacter isolates showed the highest overall resistance to tetracycline (53%) and the lowest overall percentage (7%) to erythromycin. For E. coli isolates, tested against 11 antimicrobial agents, the highest resistance was observed for ampicillin (80%) and the lowest overall percentage for chloramphenicol (12%). MDR was observed in approximately 7% of Campylobacter spp. isolates and 60% of E. coli isolates.
WGS analysis of C. jejuni and E. coli isolates revealed genetic diversity across sampling points and periods, with E. coli showing greater variability in sequence types (STs). Five C. jejuni STs, including ST 6175, which was most prevalent, were identified, all carrying resistance genes for ampicillin or tetracycline, as well as a gyrA mutation conferring resistance to ciprofloxacin and nalidixic acid. E. coli isolates demonstrated high genetic diversity with 36 distinct STs identified, including STs 10, 155, and 6448, carrying multiple resistance genes and plasmids, the resistance genes blaTEM and tet(A) being common. Plasmid types varied across sampling periods, with Col156, Inc1-l(Alpha), and P0111 frequently observed.
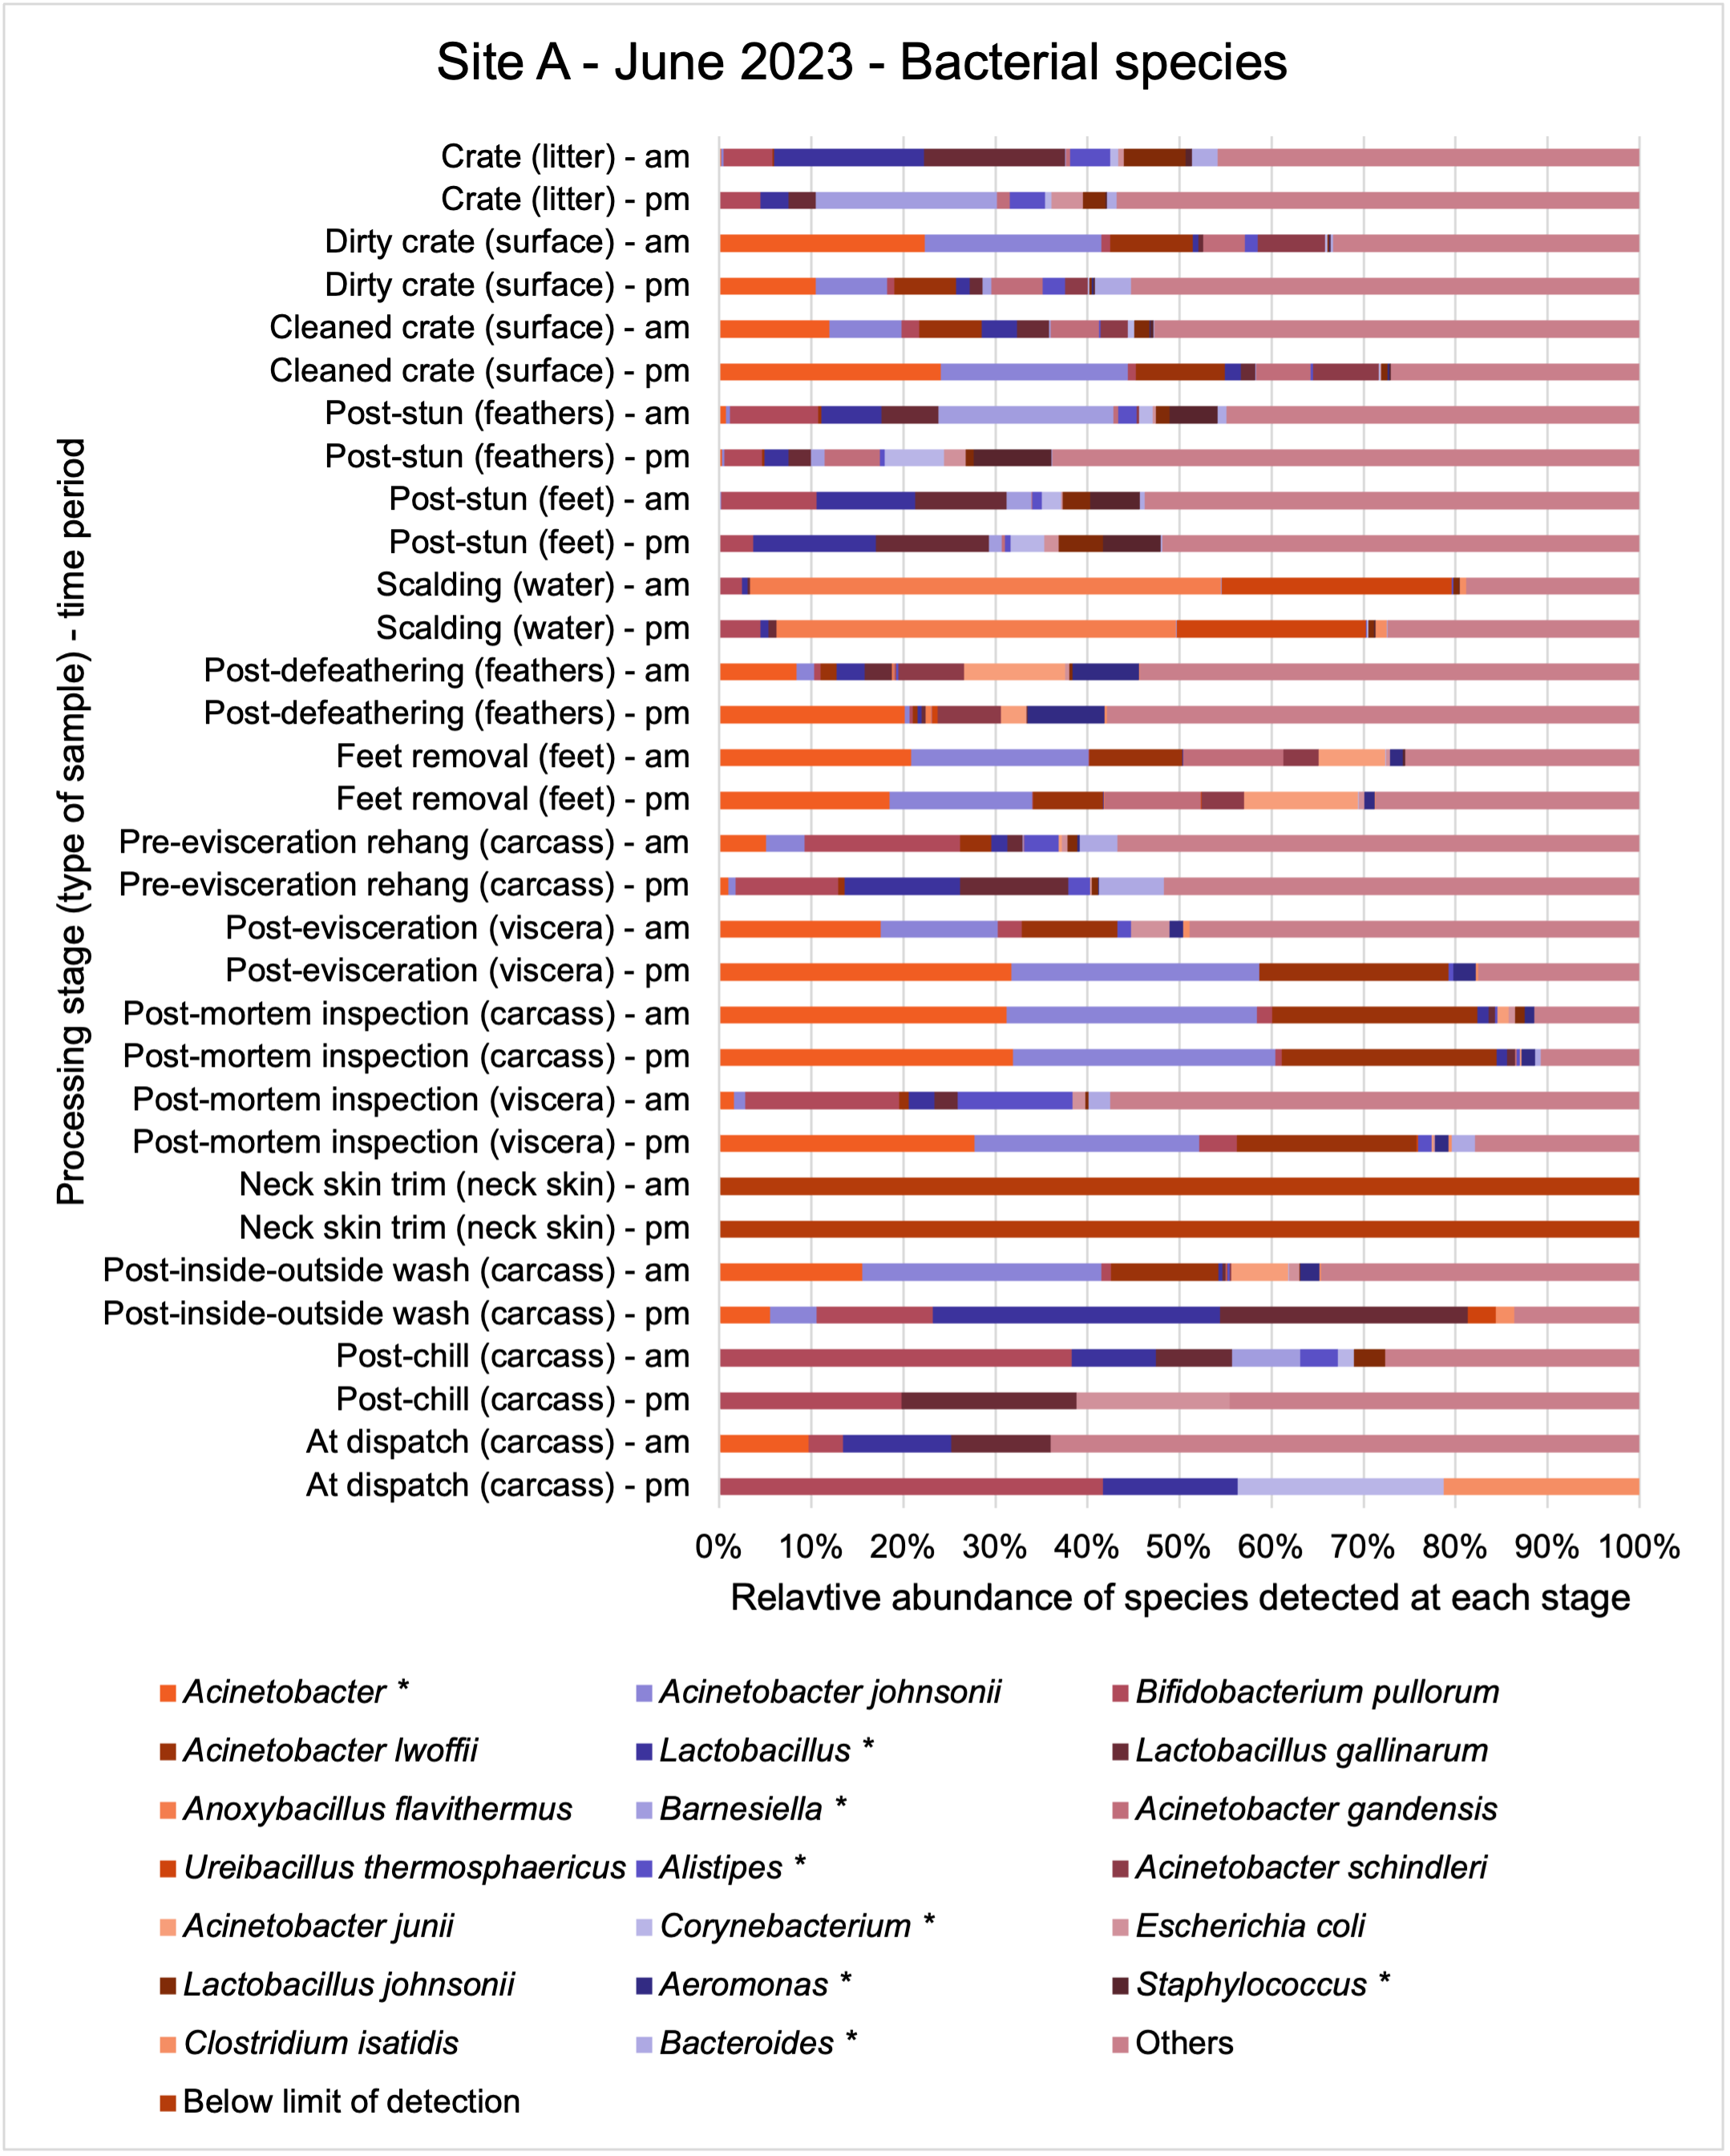
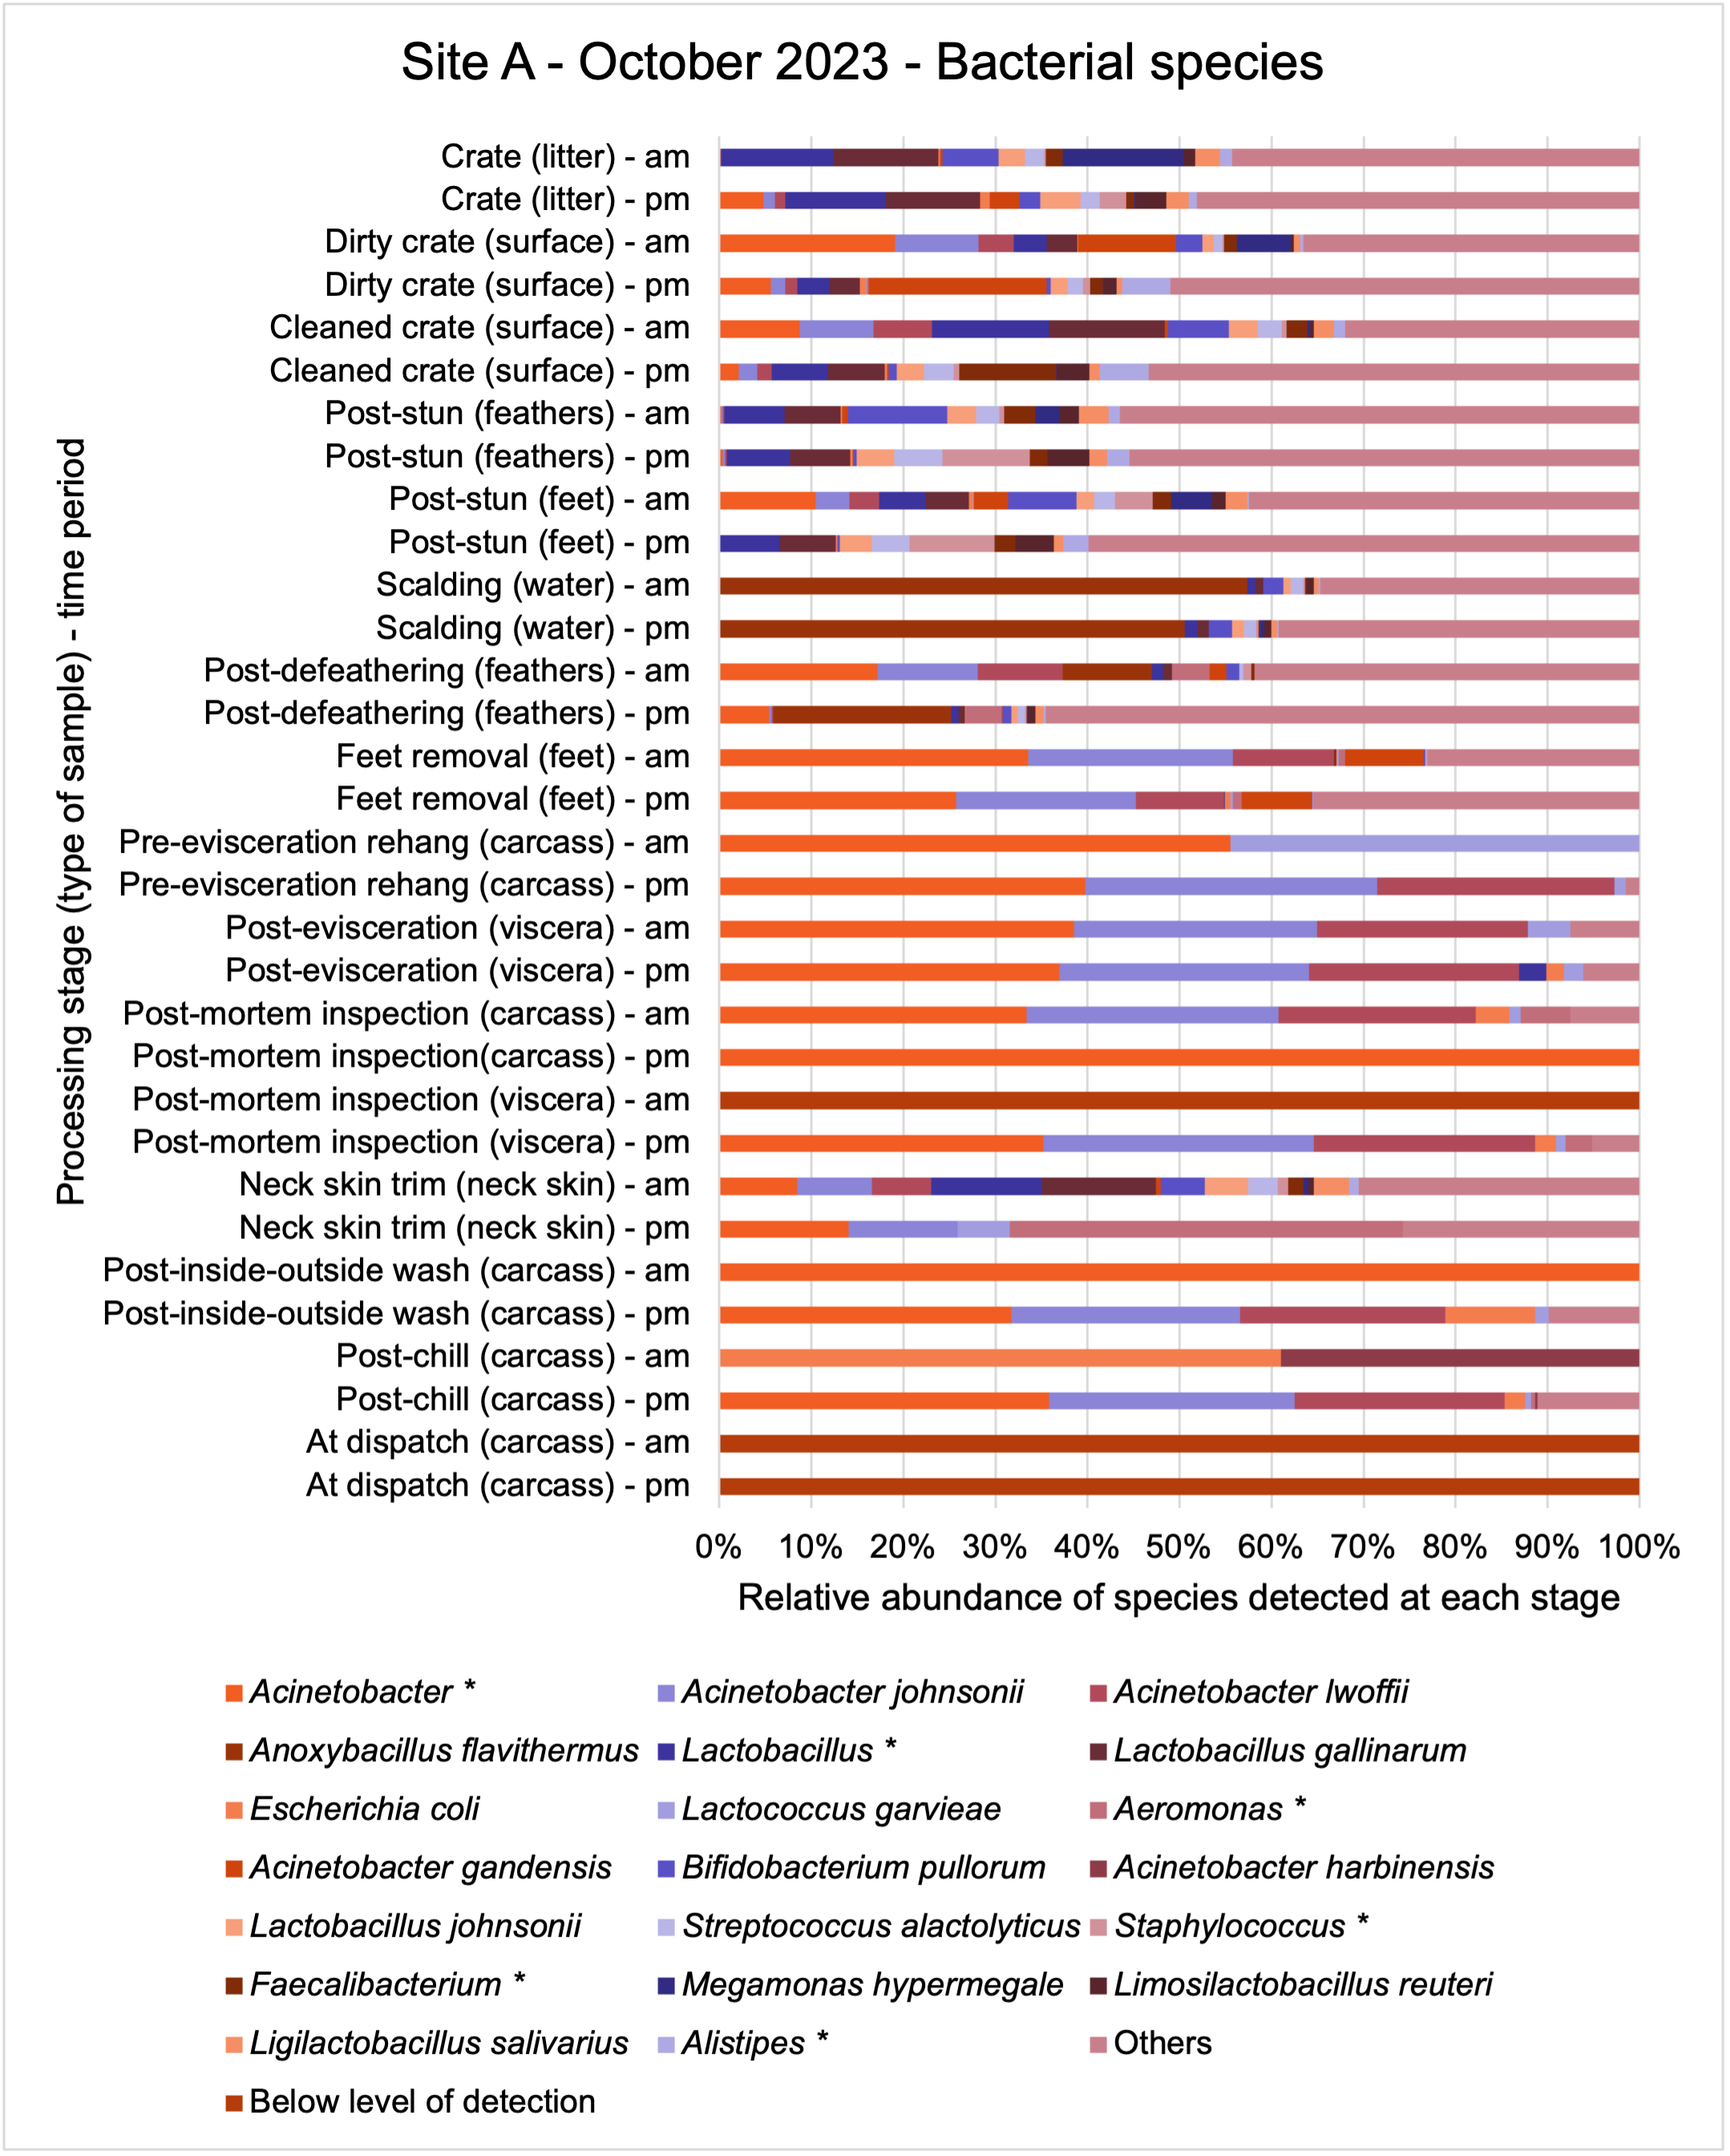
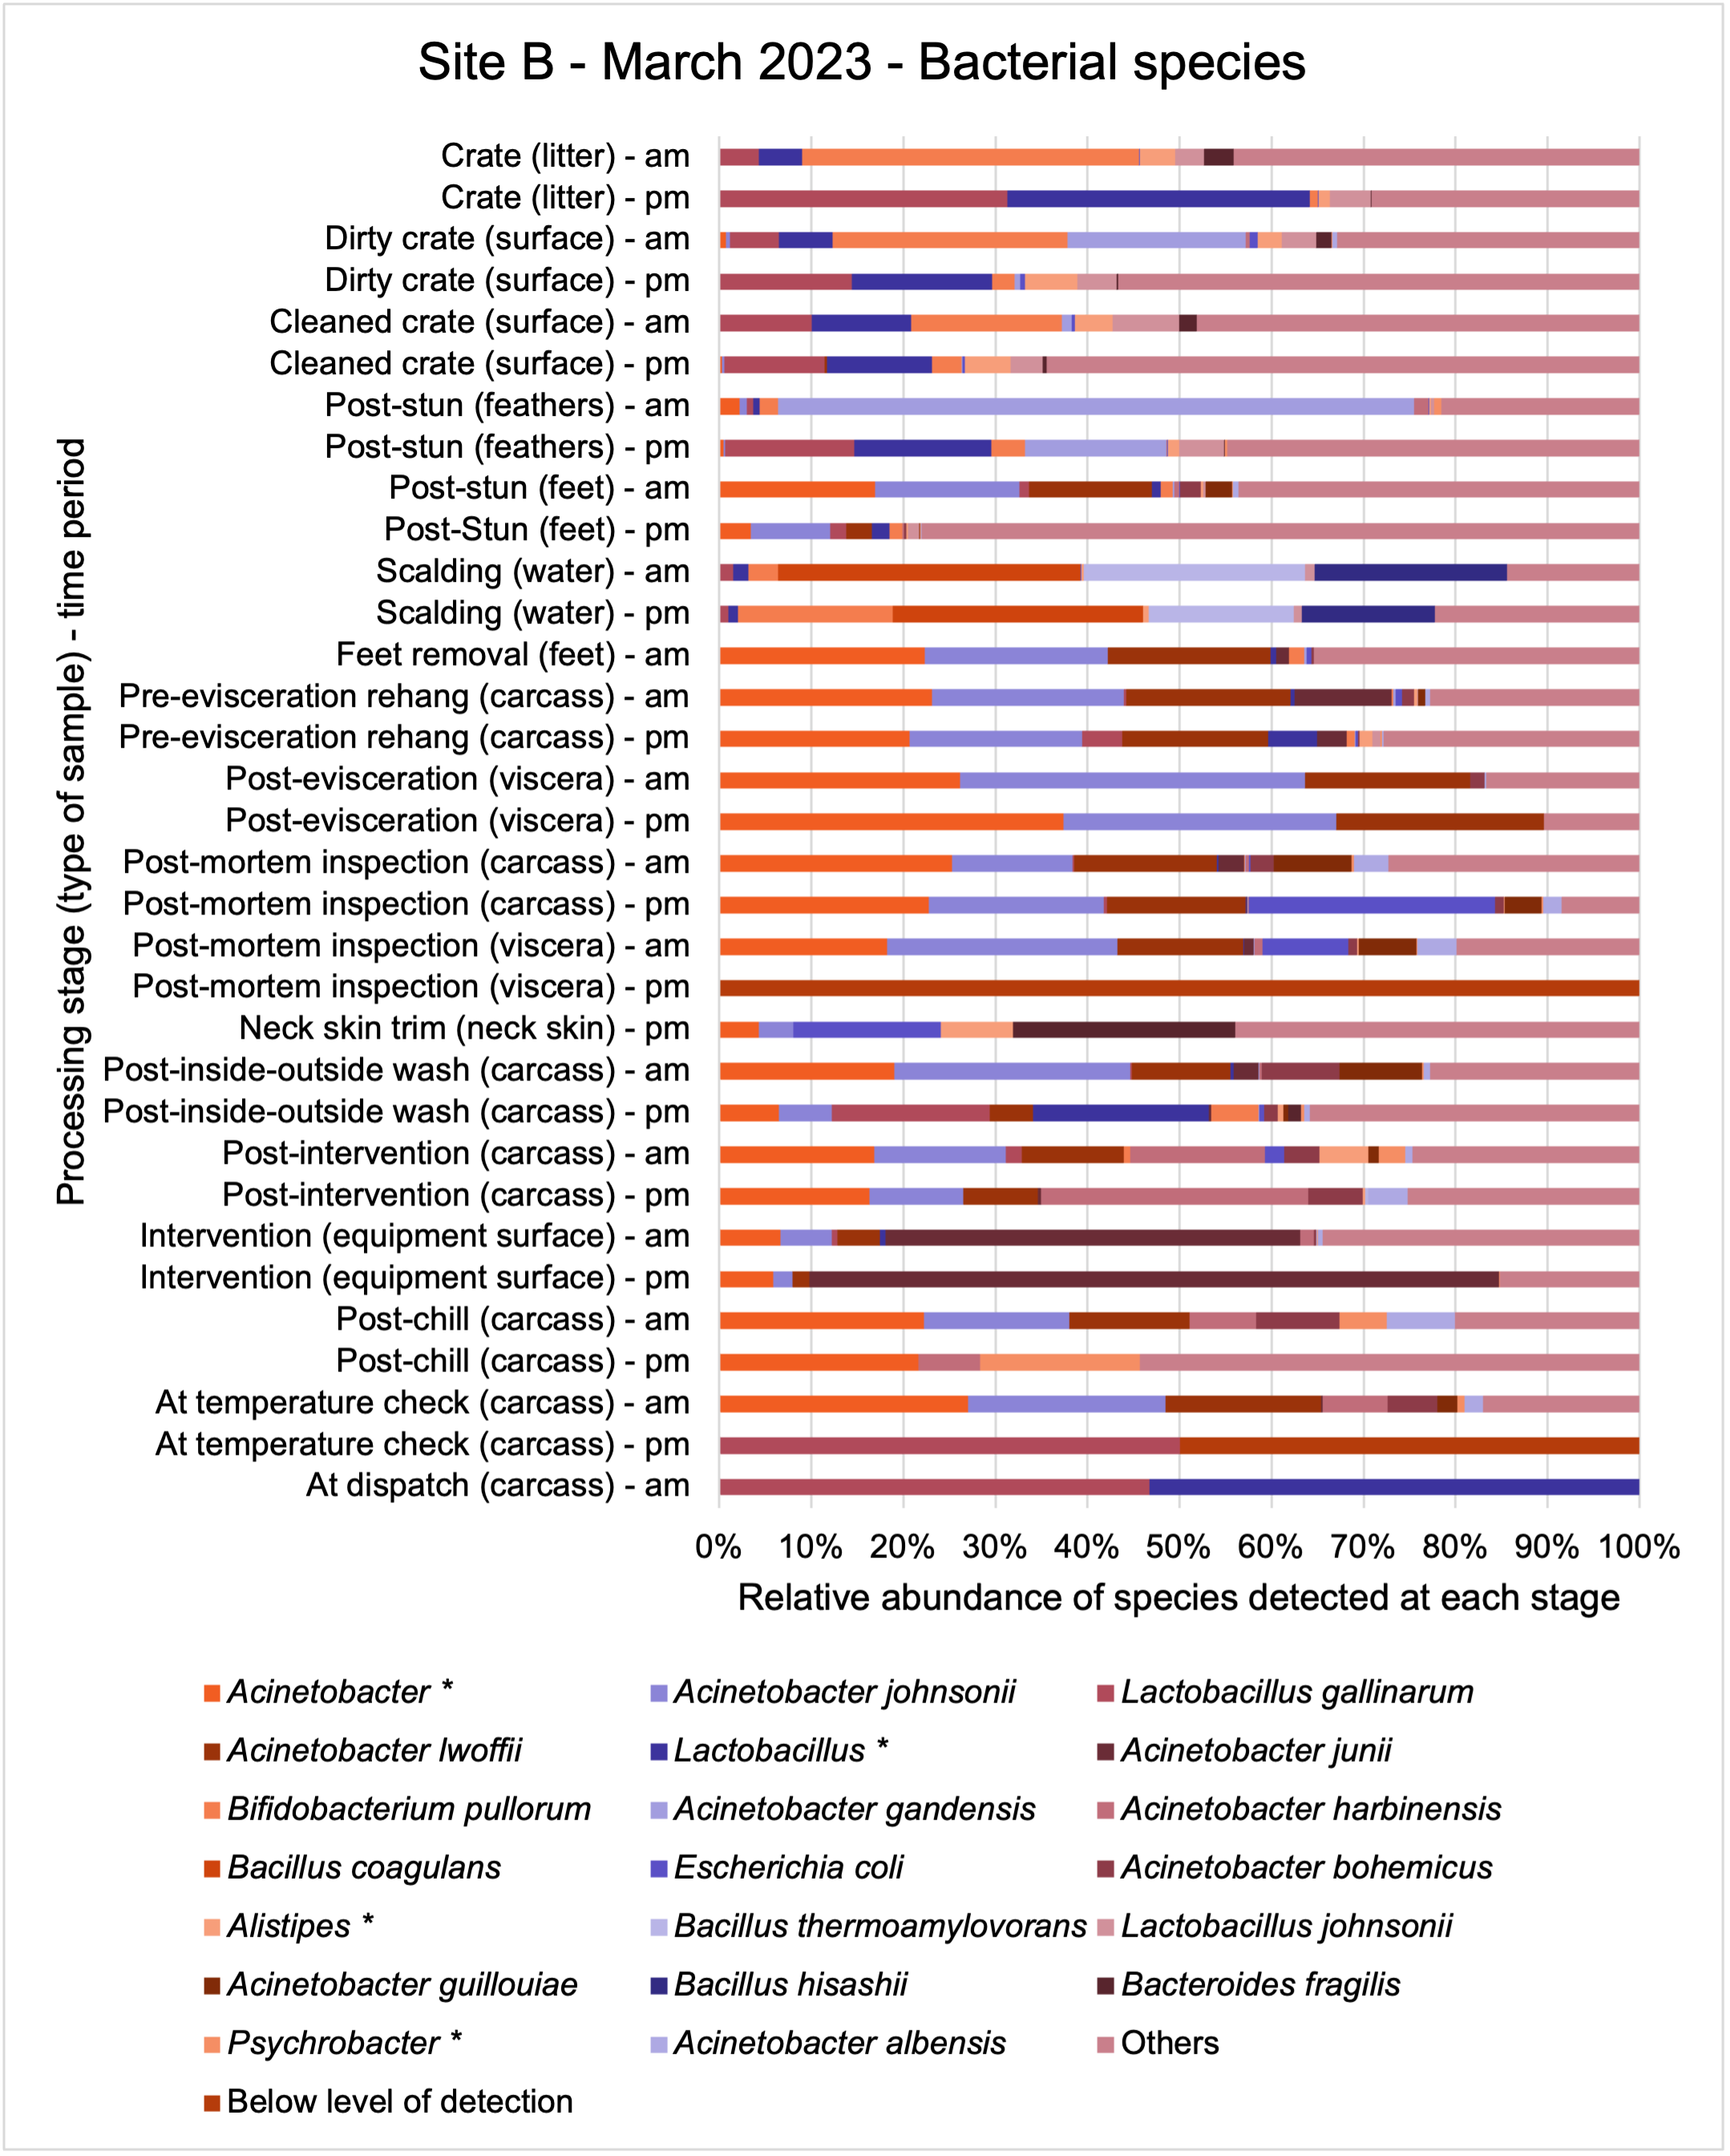
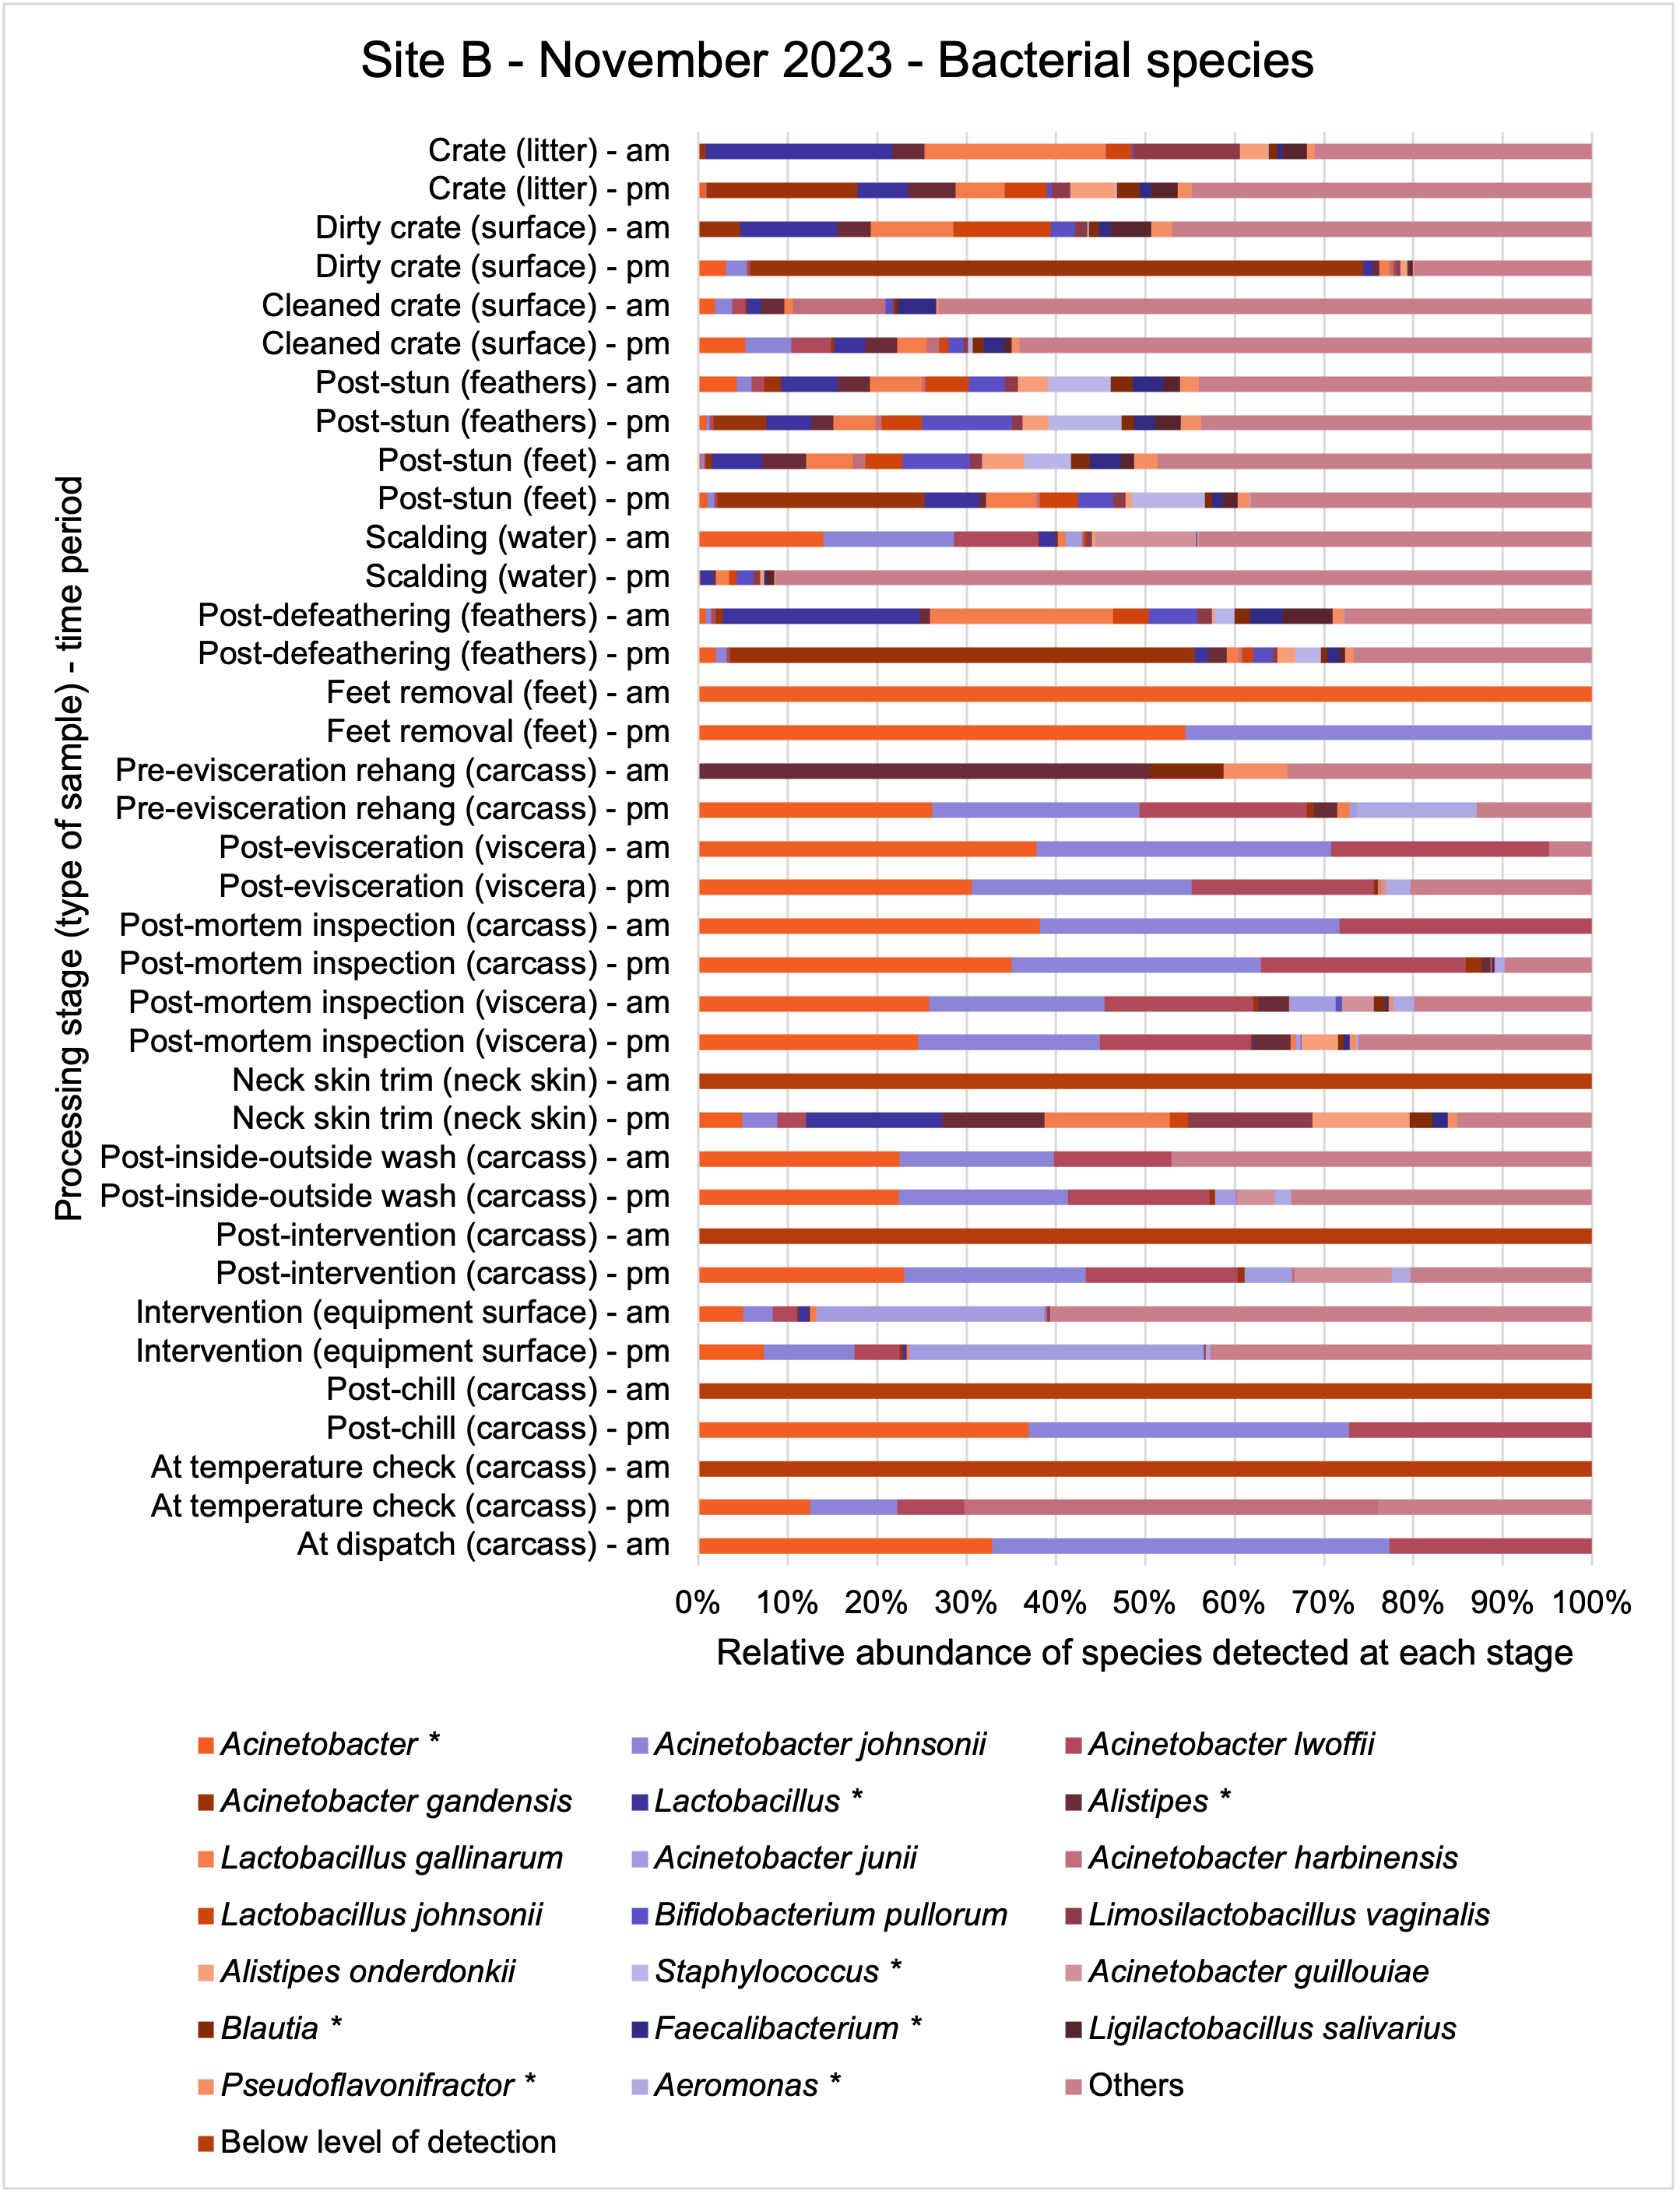
The shotgun metagenomics sequencing identified a diversity of bacteria, ARGs, and phages present across the processing lines at both sites. The results showed a wide diversity of bacteria, ARGs, and phages to be present at both sites on the different sampling periods, many of which only occurred on the individual sampling occasions. However, not surprisingly, there were similarities in the dominant composition of the bacteria, ARGs, and phages at both sites, though there were differences in the overall diversity between both sites and some seasonal differences (though many only at one site). The most abundant phyla were Proteobacteria, Firmicutes, and Actinobacteria, which accounted for the majority of detected phyla in all samples. These same phyla have been reported to be the most abundant phyla in poultry in other studies in other countries (though not always in the same order). Acinetobacter spp. were the most abundant species at both sites, particularly A. johnsonii, lwoffii, and gandensis, and were detected in samples from sampling points along the whole processing chain (from entry to dispatch) at both sites.
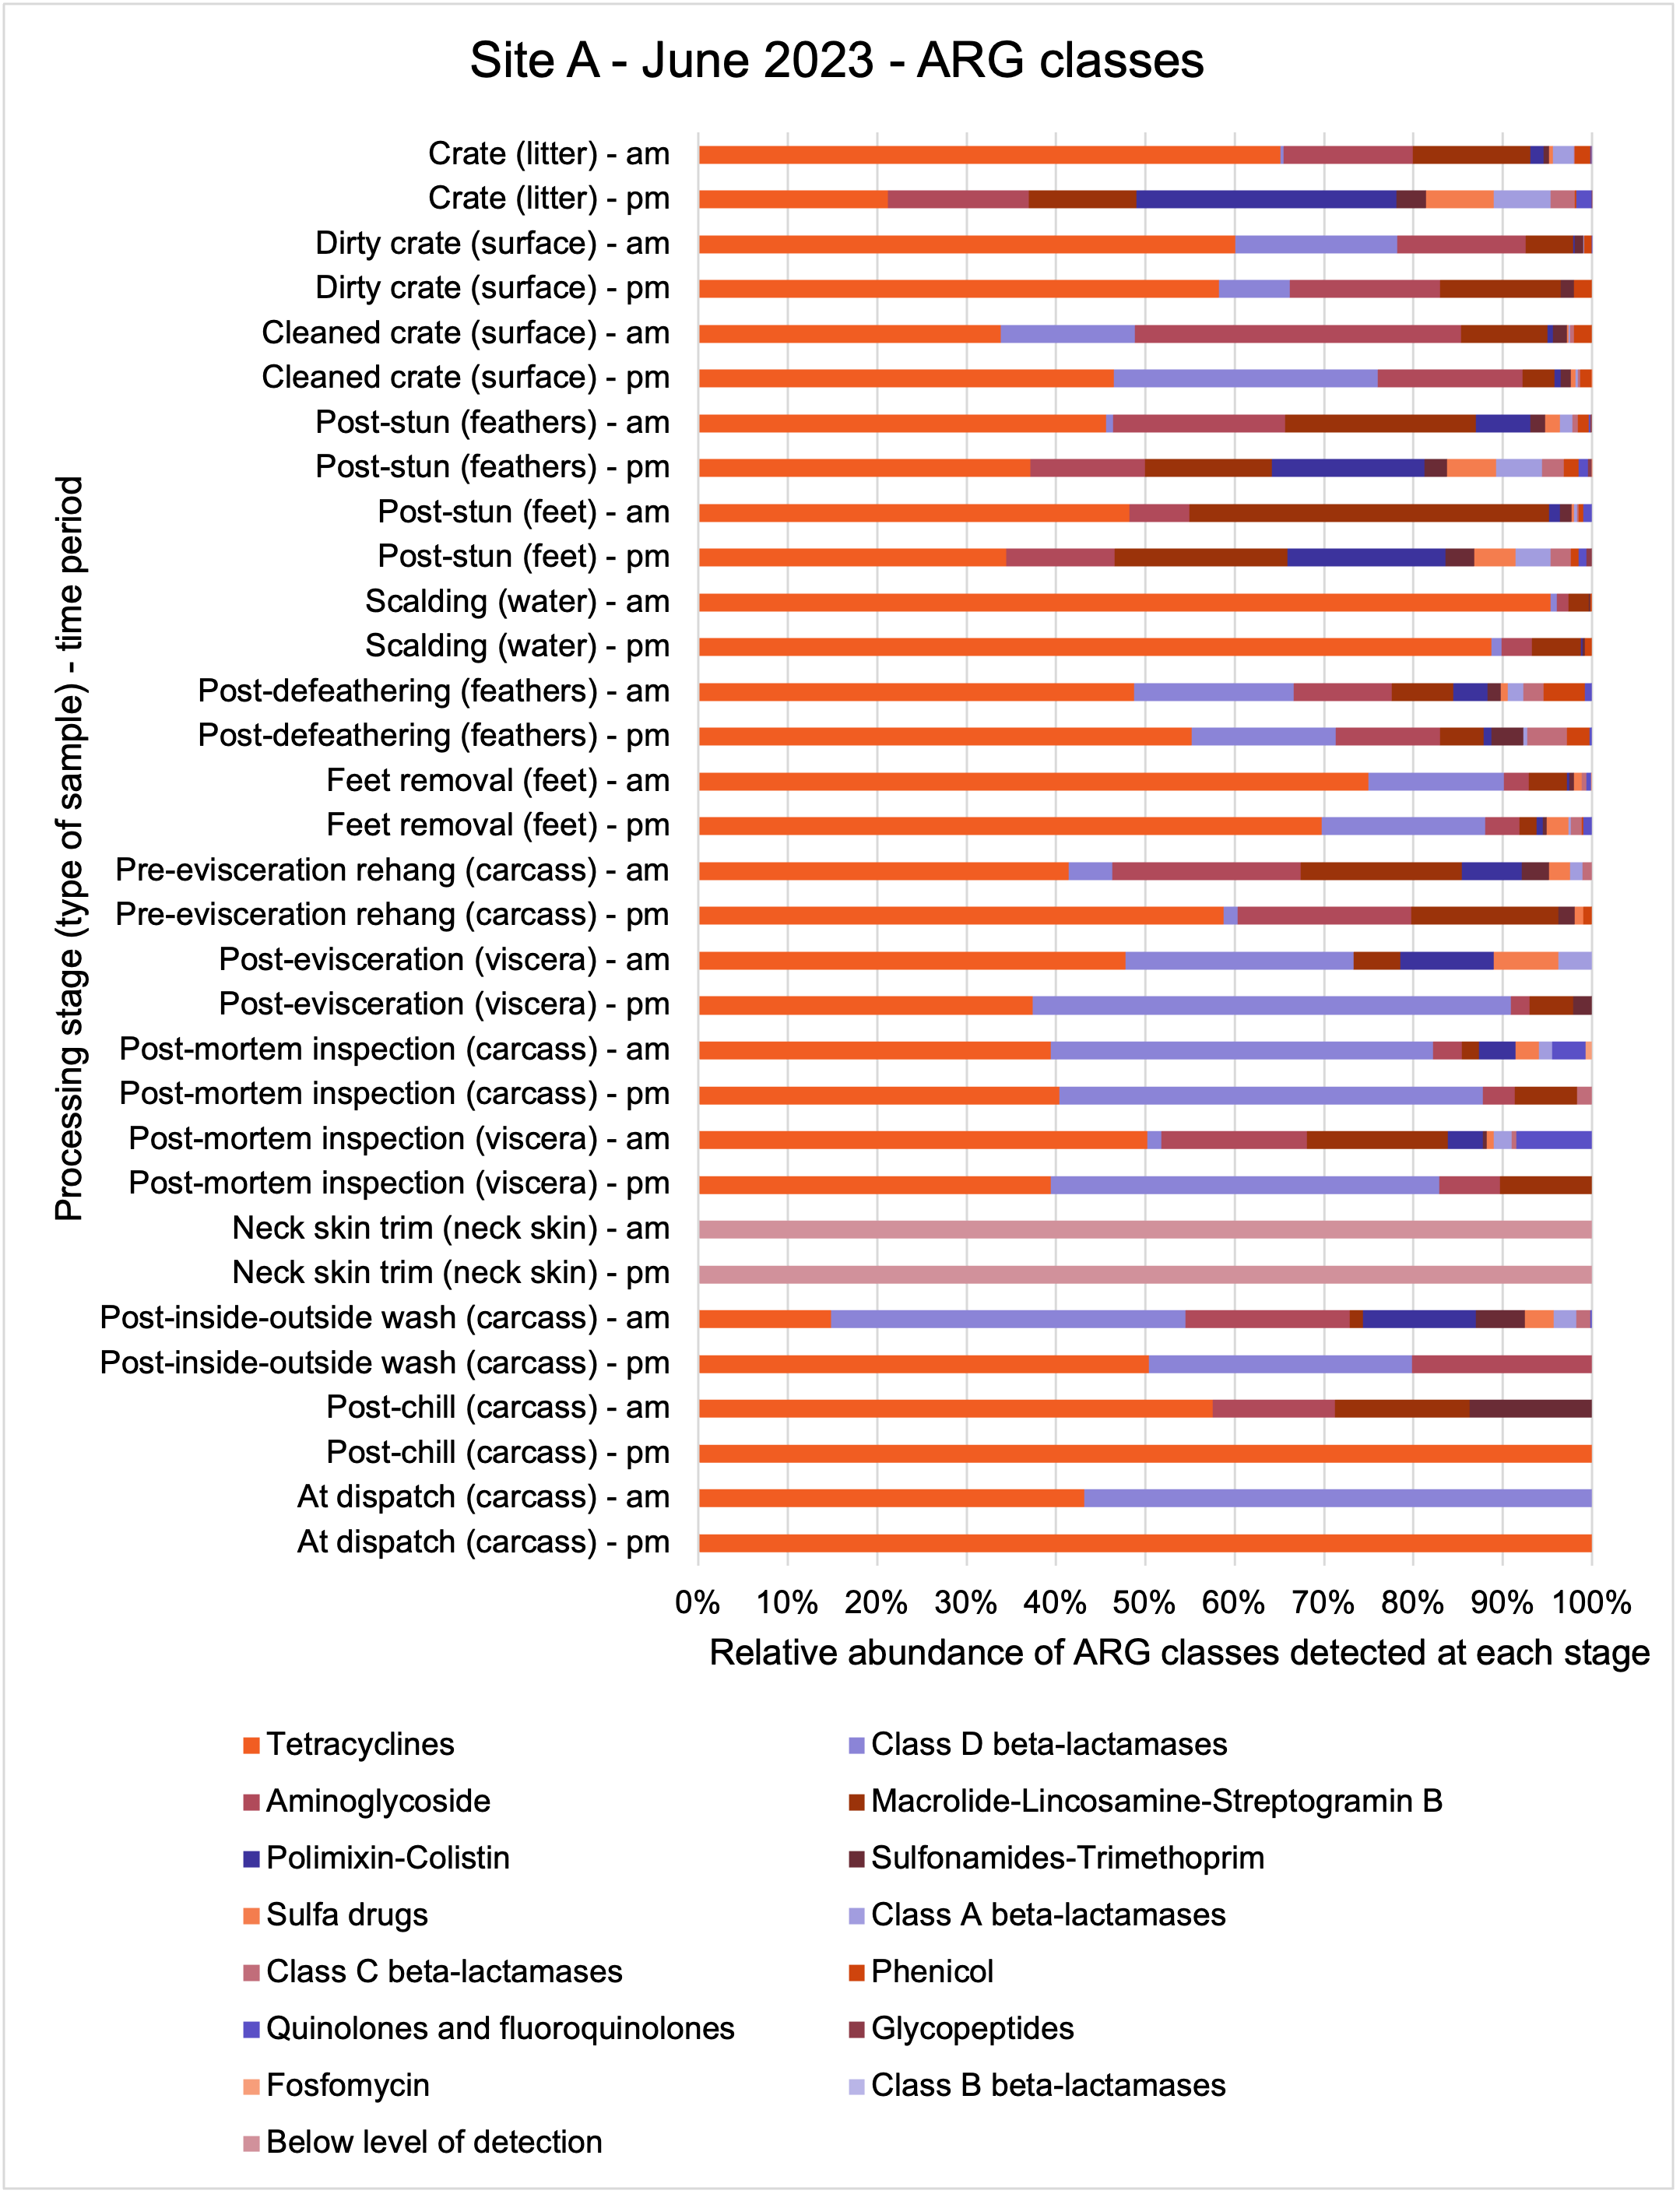
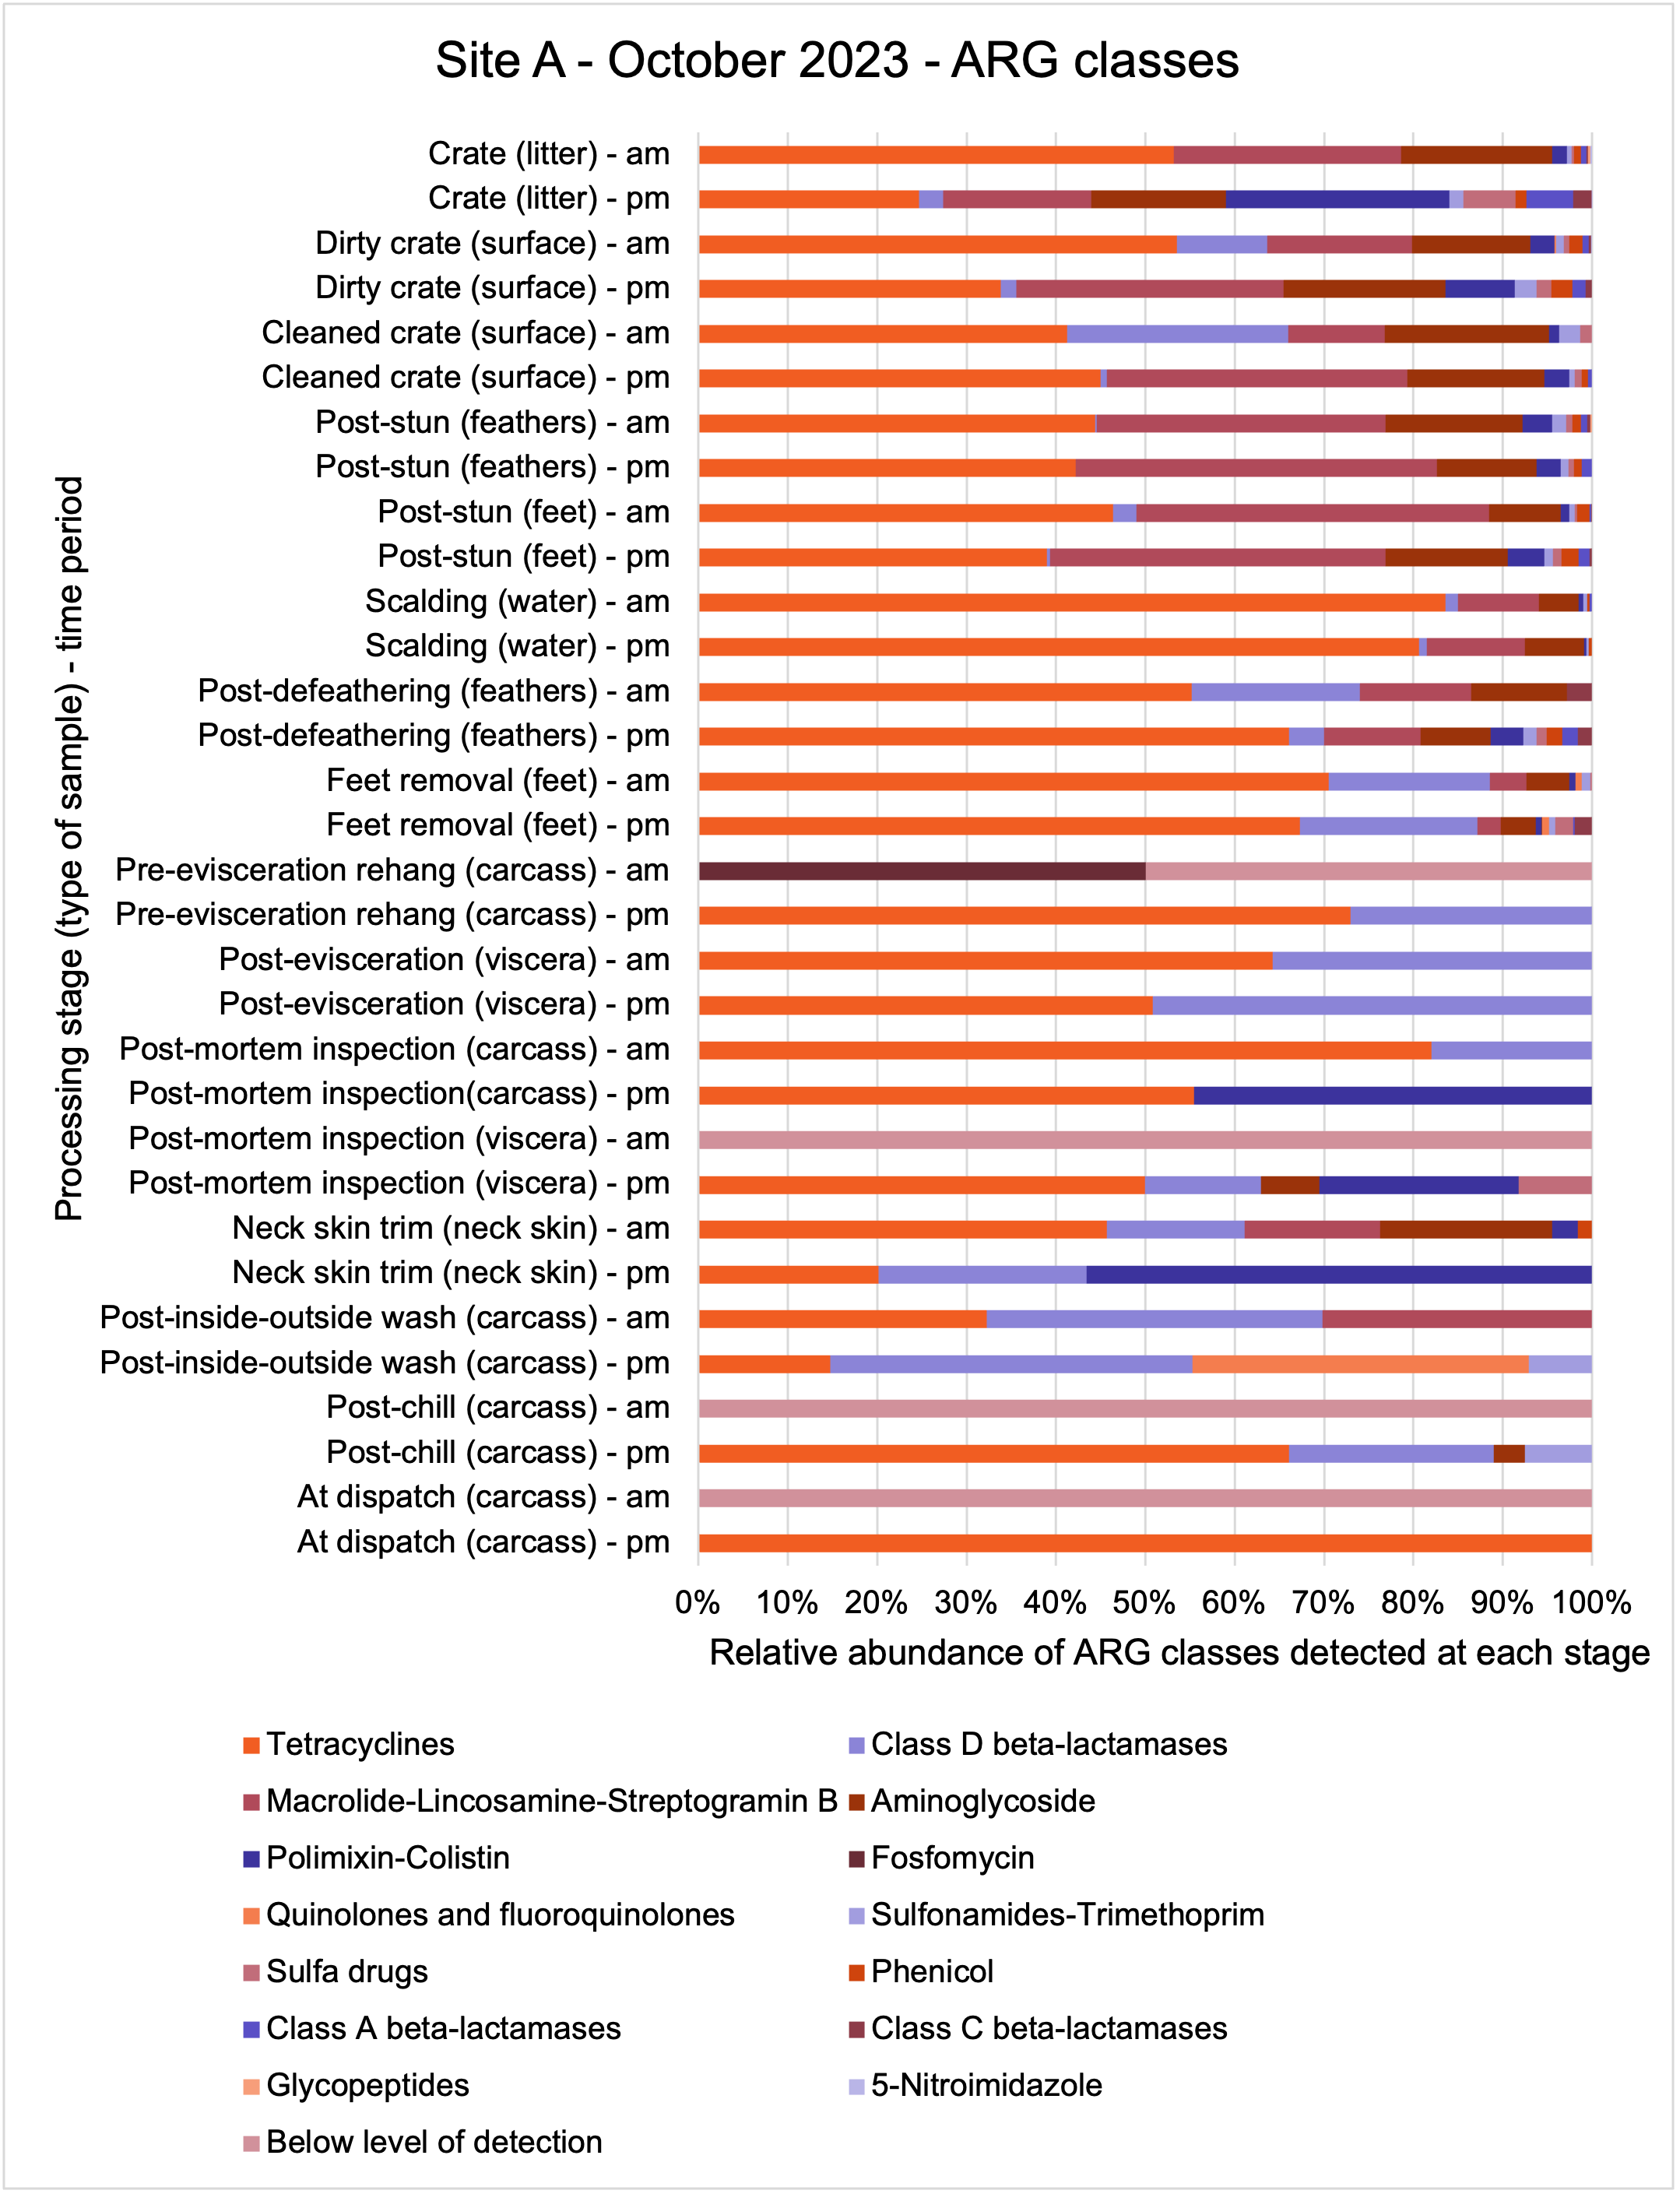
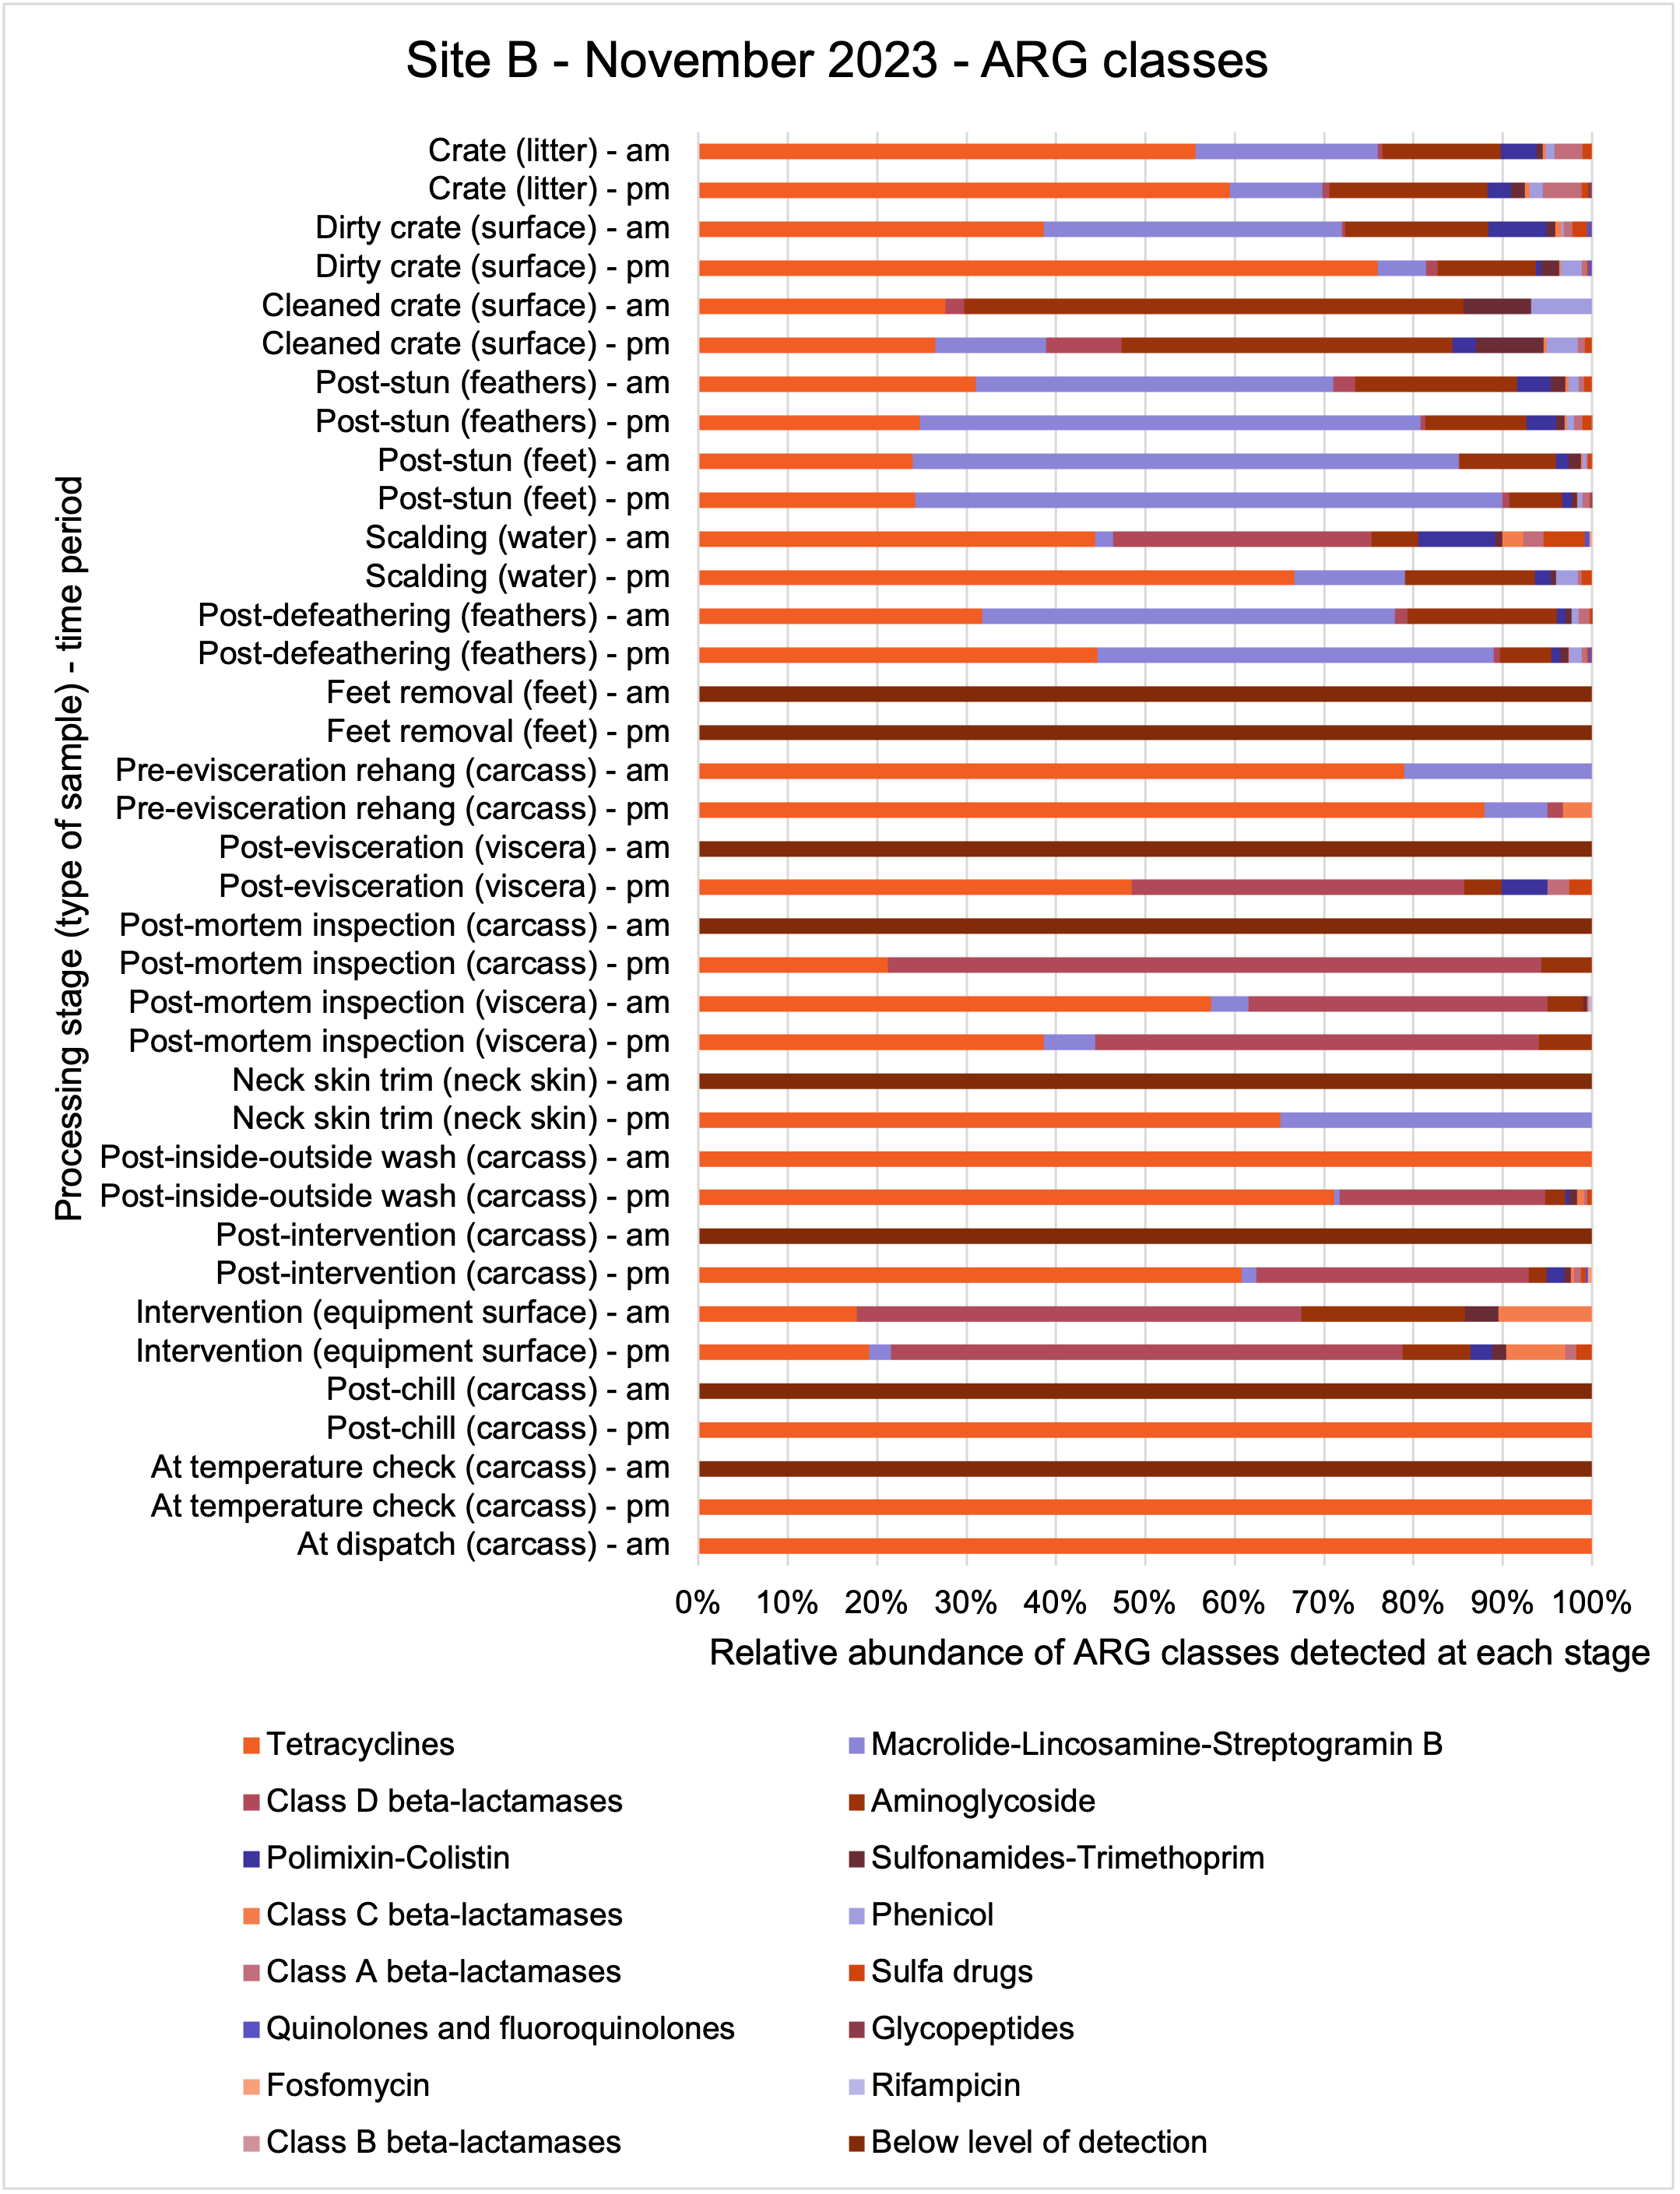
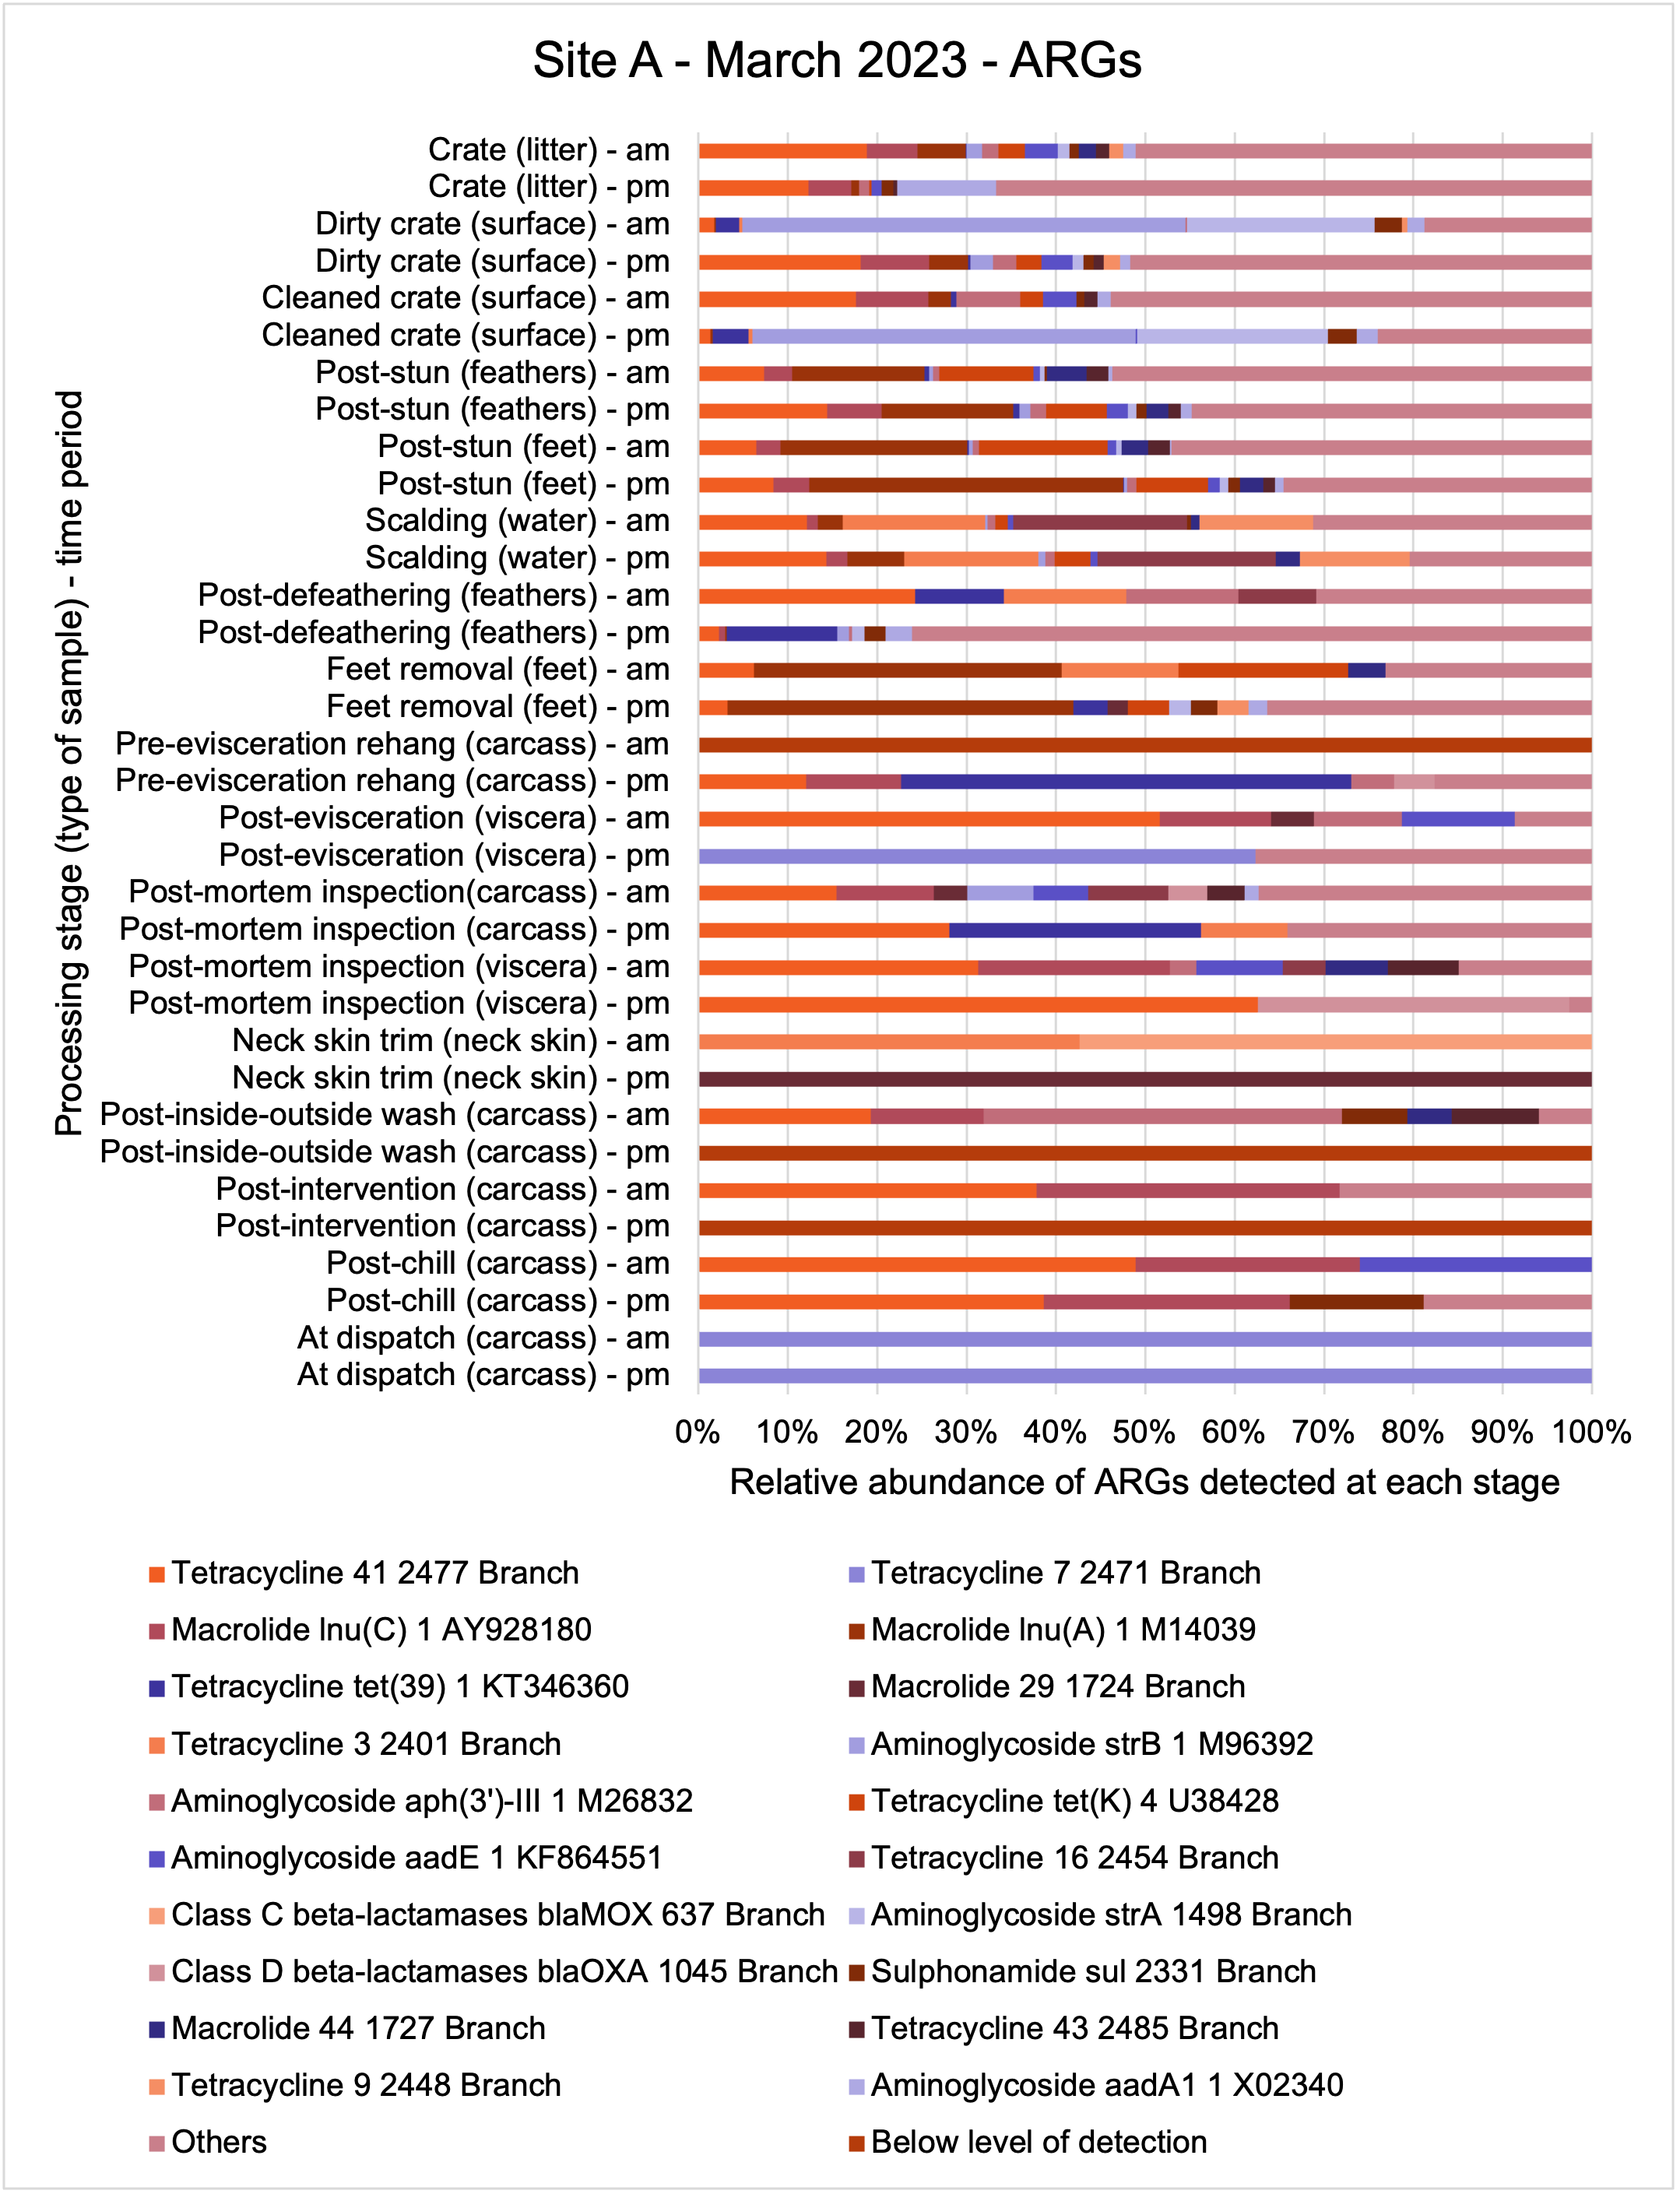
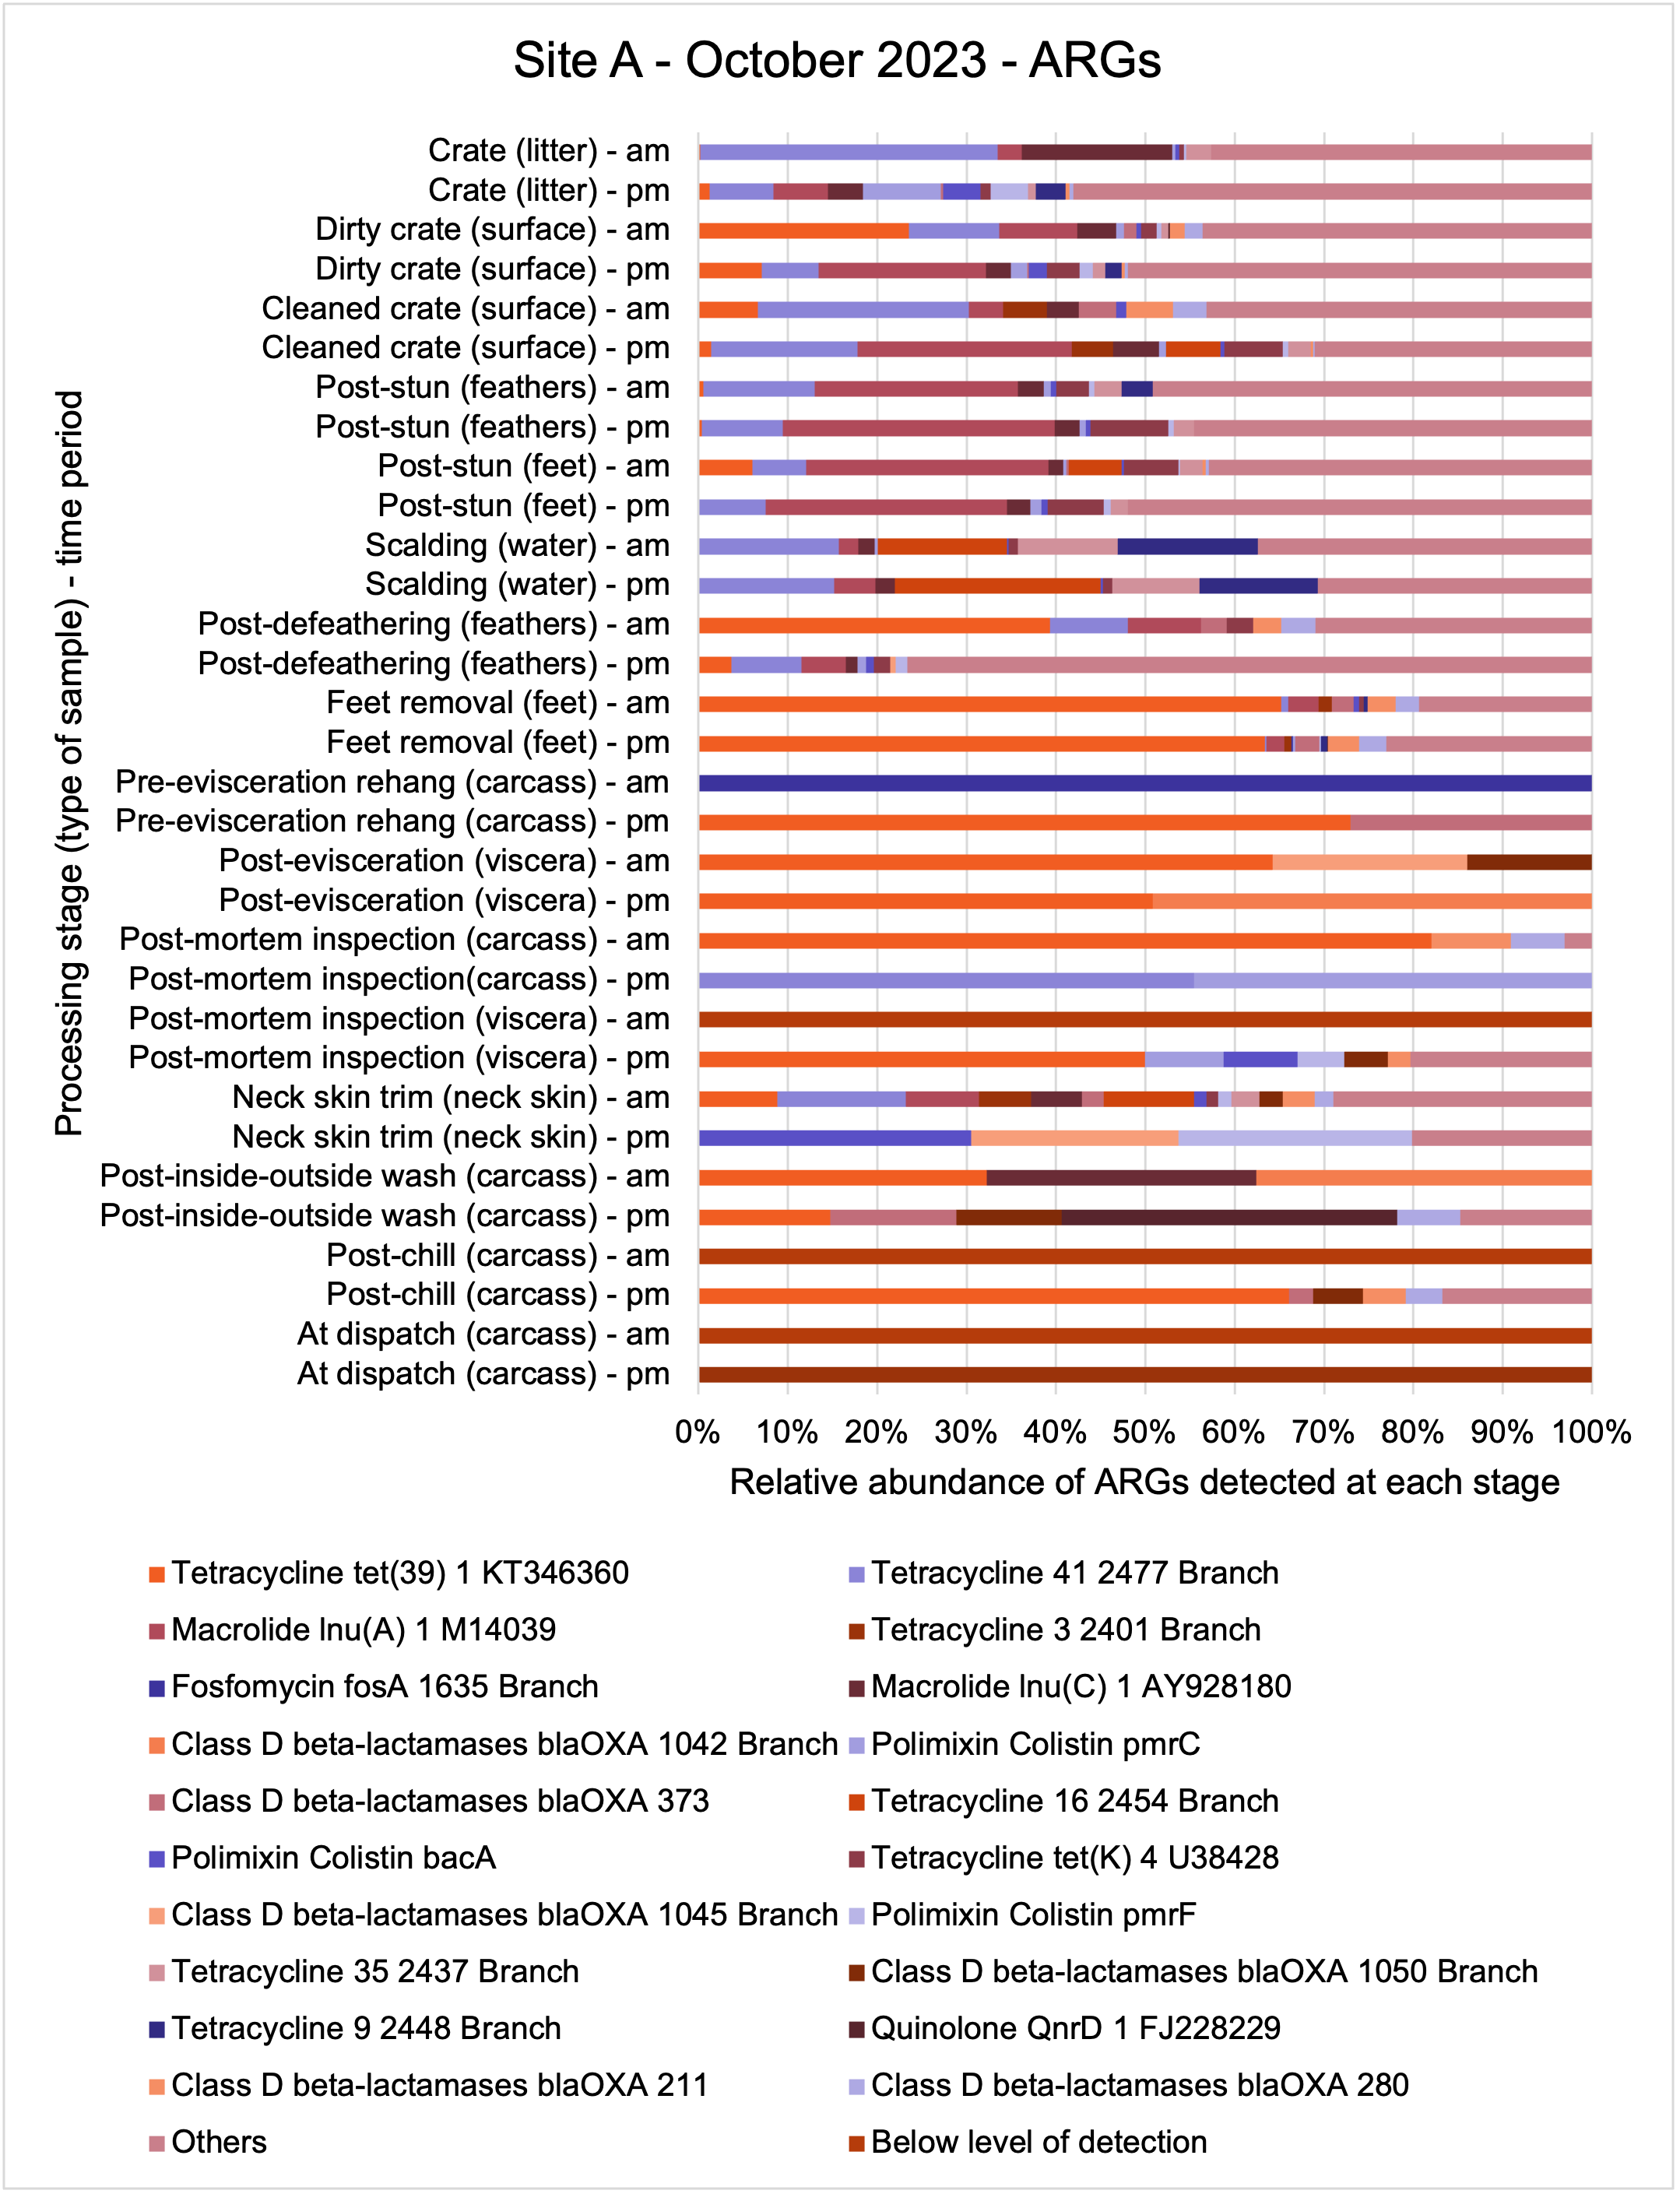
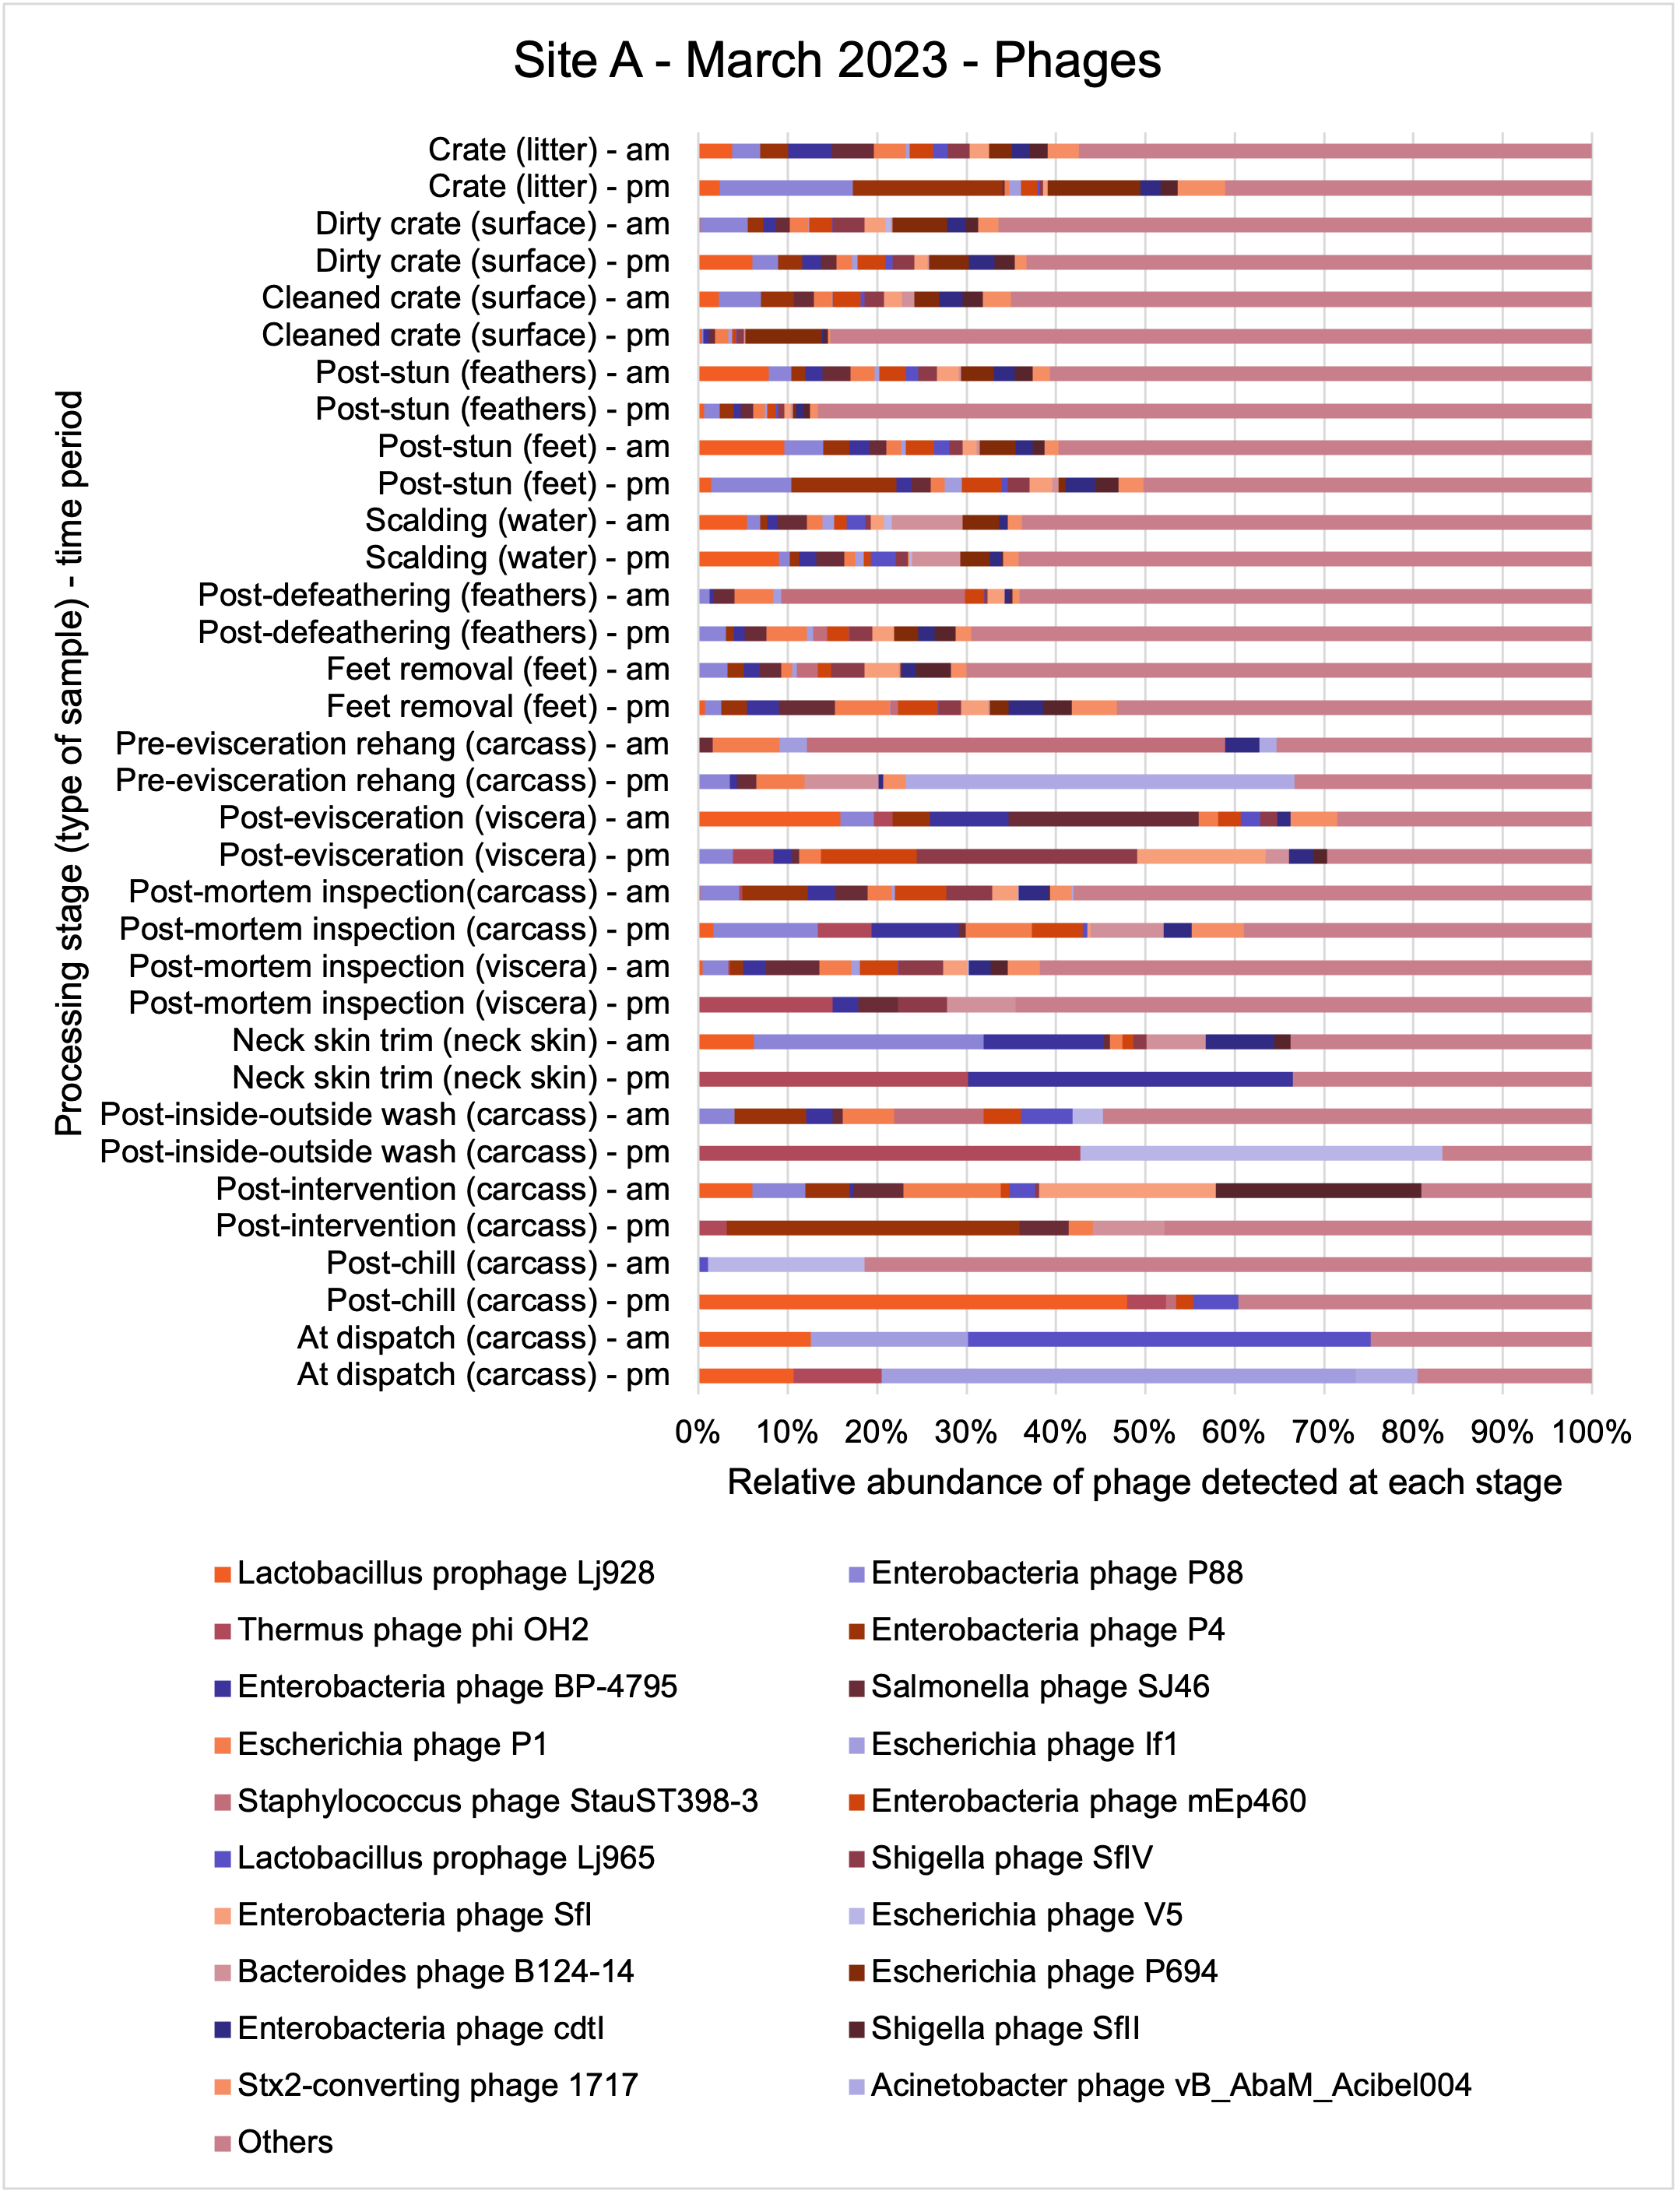
The results from the metagenomics revealed the occurrence of a total of 442 different ARGs which may be involved in resistance to 16 different classes of antimicrobial agents. The most abundant and commonly occurring ARGs in both plants were genes coding for tetracycline resistance. This study also detected the prevalence of phage which could play an important role in the transfer of ARGs within the microbiome or processing environment since they can be associated with the transduction of genes, including ARGs. The overall diversity of bacterial phyla, target bacteria, ARGs, and phages were clearly shown to reduce during processing at both sites. Similar reductions in the diversity of the microbiome through the poultry processing chain have been observed in limited other studies of the poultry processing environment carried out in other countries.
Conclusion and recommendation
The classical approach of traditional culture of the target pathogens combined with powerful genomic analysis allowed us to provide a detailed map of spatial and temporal distributions in the process chain of a working poultry environment. We were able to conclude that the target organisms were readily recovered from the process chain at early stages but following several identified processing stages reduced numbers of Campylobacter spp. and E. coli were recovered. Parallel sampling for genomic analysis demonstrated extensive bacterial diversity from early stages of the process which was concordant with associated ARG diversity. The loss of ARG diversity following specific interventions in the process chain suggests that ARGs along with their host bacteria may also be reduced by the interventions. However, some ARGs may persist because they are carried by particularly resilient bacteria to dispatch. We should consider whether these results can be repeated and are representative of other UK processor operations and to what extent poultry products represent a significant reservoir for AMR/ARGs. Further studies are needed to clarify if the microbiome composition and changes in diversity observed in our study are representative of other UK-wide poultry plants.
This study (in common with others) shows that shotgun metagenomic sequencing of processing environments is an appropriate approach to investigate how microbiome composition and diversity changes during processing and provide insights not provided by traditional microbiological analysis. However, such approaches also result in large data sets which are slow to acquire and must be carefully analysed and interpreted. As a result of metagenomic analysis, this study detected extensive phage presence in most samples. Phages have been associated with the transduction of genes (including ARGs) which could play a role in the transfer of ARGs within the poultry microbiome, but whether this occurs within the poultry processing environment is unknown and requires future work to establish baseline data.
It is vital that future work focuses on elucidating hygiene/contamination processes/interventions in processing chains, and which have the greatest influence on the reduction of target microbes, phages, and ARGs, thus allowing for improved targeted interventions to better manage these microbial populations to benefit environmental and public health.
1. Introduction
For the interpretation of Antimicrobial Resistance (AMR) in this study, the WHO definition will be applied (WHO, 2018): “Antimicrobial resistance is resistance of a microorganism to an antimicrobial drug that was originally effective for treatment of infections caused by it.” AMR is a complex issue driven by a variety of interconnected factors enabling microorganisms to withstand the killing or static effects of antimicrobial agents, such as antibiotics, antifungals, antivirals, disinfectants, preservatives. Microorganisms may be inherently resistant to such agents or can change and adapt to overcome the effects of such agents. Microorganisms can acquire antimicrobial resistance genes (ARGs) through mutation or by obtaining foreign DNA from other microorganisms, with the widespread use of antimicrobial agents particularly driving the selection for AMR.
According to the British Poultry Council (Maxwell, 2020), the UK poultry meat sector has achieved a 76% reduction in total antimicrobial drug use and a 97.3% reduction in the use of critically important antimicrobials (CIA) over the past seven years (2012-2019). Additionally, UK Veterinary Antibiotic Resistance and Sales Surveillance 2022 Report (UK-VARSS, 2023) reported a 57% reduction in overall antimicrobial drug sales for animals and an 81% reduction in sales of high-priority CIAs for all animals in 2022 compared to 2014. Specifically, antimicrobial usage (AMU) in broilers and turkeys decreased by 71% and 84%, respectively, with a 99% reduction in high-priority CIAs for meat poultry in 2022 compared to 2014.
However, the reduction of AMU alone may not be sufficient to control AMR because the environmental persistence and spread of AMR bacteria and ARGs is a major contributory factor (Koutsoumanis et al., 2021). As highlighted in a recent EFSA biohazards panel report (Koutsoumanis et al., 2021), apart from prudent AMU, the most important measures to mitigate AMR applicable for all the food-production sectors investigated, both at pre- and post-harvest, involve the correct implementation of effective well known general management measures (good hygiene practices, biosecurity) to prevent/reduce occurrence and transmission of pathogens and other microorganisms. Identifying activities at food processing stages that cause or prevent the spread of AMR bacteria and ARGs in the different production sectors is an important priority for intervention. Since AMR bacteria are primarily associated with gut microbiota, reducing the likelihood of introduction, spread, and persistence of faecal contamination during meat processing is a high priority.
Contamination and control pathways for AMR bacteria in the chicken food chain include: metaphylactic administration of antimicrobial drugs to poultry, biosecurity in the growing sheds; cross-contamination in growing sheds, contamination or control via feed and water, cross-contamination during thinning, cross-contamination during transport to abattoir, control through washing of transport crates, cross-contamination during abattoir operations (slaughter, bleeding, scalding, defeathering, evisceration, cutting and portioning), potential control/reduction during abattoir operations (such as hard scalding, inside-outside wash, pre-chill interventions, chilling, freezing), packaging, control during chilled and frozen storage, distribution, retail display, consumer storage etc. (Bennani et al., 2020; Hedman et al., 2020). A recent EFSA biohazards panel report (2021), highlighted the role of contaminated process water and workers, through their hands or equipment, as sources of AMR bacteria. In 2020, the Food Standards Agency published a literature review on the impact of secondary processing of meat and meat products, but while that covered secondary processing of poultry (i.e. post primary chilling) it did not cover primary processing operations. The review concluded that there was a lack of studies examining whether persistently colonised processing environments can act as a contamination source for AMR bacteria as most of the literature concerns AMR in retail meats.
Campylobacter spp. are considered as priority pathogens due to their widespread antimicrobial resistance (Halaby et al., 2013). These bacteria are a common cause of foodborne illnesses and are frequently found in poultry and other food-producing animals (Havelaar et al., 2015). The increasing prevalence of antimicrobial resistant Campylobacter strains poses a significant threat to public health and food safety (Qin et al., 2023). Due to the importance of Campylobacter spp. in public health and its rising resistance to antimicrobials, particularly fluoroquinolones, Campylobacter spp. have been recognised as one of the serious antimicrobial-resistant threats of high priority by both WHO and the CDC [US Centers for Disease Control and Prevention] (Tacconelli et al., 2018).
Since E. coli is ubiquitous in the gastrointestinal tract of warm-blooded animals, it has been extensively used to monitor AMR in food animals (including chicken). Over the past few decades, AMR has increased at a faster rate among chicken isolates of E. coli than human clinical isolates (Tadesse et al., 2012). This trend is alarming as it highlights the role of poultry production in the dissemination of AMR (Bhattarai et al., 2024), which can be transmitted to humans through the food chain. E. coli strains in poultry are increasingly resistant to multiple classes of antimicrobial, including those critical for human medicine, such as fluoroquinolones and third-generation cephalosporins (Fenollar-Penadés et al., 2024).
The rise of MDR E. coli and antimicrobial resistant Campylobacter spp. in poultry presents a complex challenge for both animal and human health. This situation highlights the critical importance of comprehensive AMR surveillance and responsible antimicrobial use in agriculture. Also, while overall antimicrobial use has decreased (UK-VARSS, 2023), the persistence and, in some cases, increase of resistant bacteria emphasises the need for continued vigilance and action across the agricultural and public health sectors.
Antimicrobial resistance (AMR) in bacterial pathogens is intensified by the frequent role of mobile genetic elements (MGEs). The transfer of ARGs within and between different species of bacteria is commonly facilitated by MGEs, although the important role of individual plasmids and bacteriophages is not entirely understood.
The detection and identification of lytic or lysogenic bacteriophages (phages) from poultry environments at scale by metagenomic sequencing is an emerging area of interest. To what extent the diversity and epidemiology of phages in poultry processing and the natural environment is important however is yet to be determined. Phages can be present in large numbers especially from contaminating faecal matter and the transfer of ARGs by genes from bacteria to bacteria with specific phage can be demonstrated at least in the laboratory. In ‘real world’ microbial ecology with poultry, multiple compounding factors make it difficult to provide conclusive evidence that transfer of ARGs by phages occurs in this environment.
Although the FSA has been monitoring the prevalence and types of AMR bacteria in retail chicken, there is strong evidence that commensal and pathogenic AMR bacteria can be found on poultry meat. However, what is not known at present, is the role that chicken processing has on the prevalence and spread of AMR bacteria. It is also unclear whether persistently colonised processing environments can act as a contamination source for AMR bacteria, thus showing the importance of environmental monitoring and identification and survey of biofilms. There is a need to evaluate the impact of processing steps used during chicken production and the processing environment on the (molecular) epidemiology and transmission of AMR in chicken meat, to identify probable pathways for transmission, and mitigate the risks of transmission.
1.1. Aims and objectives of this project
The overall aim of this project was to assess the impact that processing has on the presence and transfer of antimicrobial resistant Campylobacter spp. and E. coli and associated ARGs on chicken meat.
The project was carried out in two parts with an initial literature review carried out to aid the project sampling plan/design (see Appendix). A detailed field and laboratory study was then conducted to assess the abundance and potential transmission of antimicrobial resistant Campylobacter spp. and E. coli during the processing of chicken in two similar large scale intensive UK slaughterhouses.
The specific objectives set for the “field” and laboratory study were to determine:
-
The presence and abundance of Campylobacter spp. and E. coli cultured from samples taken at different stages along the chicken processing line at different sampling periods.
-
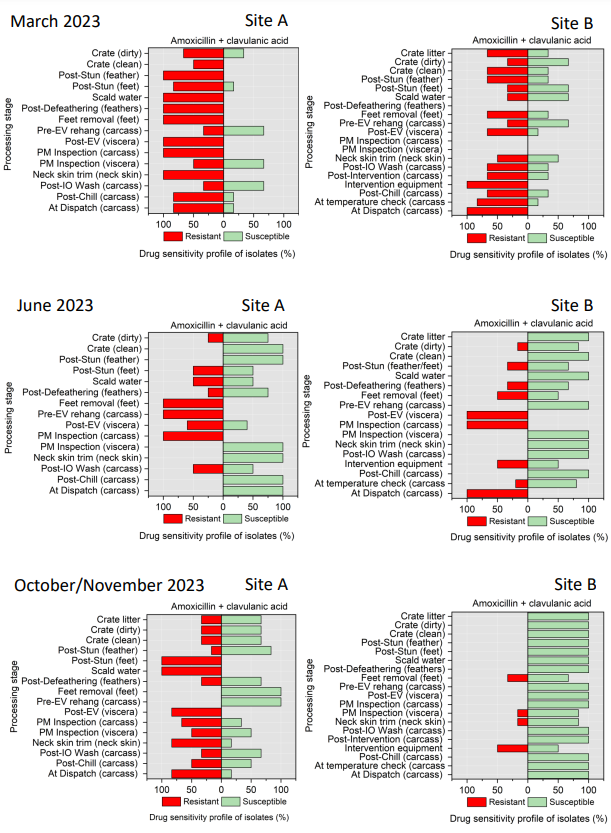
The AMR profiles in Campylobacter spp. and E. coli isolates recovered from samples taken at different stages along the chicken processing line using Antimicrobial Susceptibility Testing (AST).
-
The presence and types of ARGs present in selected individual isolates of E. coli and Campylobacter spp. using WGS.
-
The diversity and abundance of bacteria, ARGs, and bacteriophages (naturally present viruses that target bacteria, commonly called phages) at different stages along the chicken processing line by modern genomic technology (metagenomic sequencing).
2. Materials and Methods
The project was carried out in two parts. Part 1: an initial literature review was carried out to aid the project sampling plan/design (detailed in the Appendix) and Part 2: a field and laboratory study carried out to assess the presence and potential transmission of antimicrobial resistant Campylobacter spp. and E. coli during the processing of chicken in two similar large scale intensive UK slaughterhouses and cutting plants.
2.1. Field and laboratory sampling and analysis
This section details the sample locations and collection procedures at two UK slaughterhouses and cutting plants over three distinct periods. Samples, including swabs, liquids, and neck skin, were collected from various stages of poultry processing. Using traditional microbiological methods, each sample was analysed for the presence, levels and AMR characteristics of Campylobacter spp. and E. coli isolates. WGS was then performed on selected individual isolates to evaluate the presence of ARGs. Additionally, pooled samples from each processing stage were selected and subjected to shotgun metagenomic analysis to enable the assessment of microbial diversity, bacteriophage diversity, and ARG distribution across the different processing stages.
2.1.1. Sampling location and sampling dates
Two slaughterhouses in the UK were selected as sampling locations for this study. One of the plants was located in the East Midland region and the other in the West Midland region of England, thus representing different geographical areas within the UK. Both of the sites were large scale chicken processing plants with similar processing lines but with differences in factory layout, some equipment, and distances between individual processing stages. Both supply major UK retailers with chicken and had similar throughputs and line speeds, though Site A was slightly larger than Site B in terms of throughput and ran at a faster line speed. Table 1 below shows details of the 2 sites visited for sample collection in this project. Each site was visited on 3 occasions in 2023. An initial in-field sampling occurred in March 2023 (16th March for Site A and 14th March 2023 for Site B; referred to as March in this report). Two further sampling visits occurred in the summer and winter months. For the summer collection, samples were collected in June 2023 (21st June 2023 for Site A and 27th June for Site B; referred to as June in this report) and October and November 2023 (18th October for Site A and 21st November for Site B; referred to October and November respectively in this report). At each site on each visit samples were collected in the morning (am) and afternoon (pm) at each different processing stages.
Table 1.Details of the two chicken processing sites visited for sample collection in this project.
| Details |
Site A |
Site B |
| Number of birds processed per day |
400,000 birds/day (Monday – Thursday); 200,000 birds/day (Friday and Saturday) |
320,000 birds - 370,000 birds per day across 2 shifts |
| Approximate line speeds (birds per minute [bpm]) |
217bpm |
175bpm |
| Number of lines |
2 |
2 |
| Chicken source |
Company/contracted Red Tractor Assurance (RTA) farms in the UK |
Company/contracted Red Tractor Assurance (RTA) farms in the UK |
| Number of farms supplying birds on March visit |
6 |
7 |
| Number of farms supplying birds on June visit |
5 |
6 |
| Number of farms supplying birds in October/November visits |
7 |
7 |
| Distance between supplying farms and site on March visits (miles) |
8 to 45 (mean 23) |
25 to 90 (mean 61) |
| Distance between supplying farms and site on June visits (miles) |
8 to 28 (mean 18) |
5 to 113 (mean 82) |
| Distance between supplying farms and site on October/November visits (miles) |
7 to 39 (mean 21) |
9 to 96 (mean 50) |
| Additional details |
Different farms supplied chickens to Site A on each of the visits. But one of the farms that supplied Site A in March also supplied Site B in June. Also, one of the farms that supplied chickens to Site A in June also supplied chickens to Site B in November. |
Two of the farms supplying chickens to Site B in March also supplied chickens to Site B in June. Two different farms that supplied chickens to Site B in March also supplied chickens to Site B in November. None of the farms that supplied chickens to Site B in June supplied chickens to Site B in November. |
2.1.2. Description of chicken processing and sampling stages
At both sites, live birds were transported from the farm in crates, on arrival at the processing plants the birds were gas stunned rendering them unconscious. They were then removed from the crates by hand and suspended by their feet on a moving line, the birds were then euthanised and bled. The crates were cleaned and disinfected before being returned to the farms for use. After slaughter, birds entered a process where their feathers were removed. This began by putting the birds through a bath of hot water, which is designed to help loosen feathers, a processing stage called scalding. Feather removal (a processing stage called defeathering) was then performed by a machine called a “picker,” which includes hundreds of little rubber “fingers” that rotate around to remove the feathers. In Site A the heads were removed after defeathering, while in Site B the heads were removed prior to scalding. After the feathers were removed the feet were removed and the whole carcass inspected, and the carcasses then rehung on a separate moving line. The carcasses were then sent to an “eviscerating” (EV) line which removed the internal organs (viscera) in a series of operations. After the organs were removed, each carcass and the separated viscera were inspected (post-mortem (PM) inspection). After inspection excess neck skin was trimmed from the carcasses before the inside and outside of the carcass is washed in a machine called an “inside-outside (IO) washer”. In both of the plants the carcasses then passed through a thermal intervention process designed to reduce bacteria on the carcass prior to chilling (since different processors may use different interventions, or may use interventions in their plants, details of the exact intervention have been withheld in this report to ensure the anonymity of the plants). The same intervention was used in both of the plants. After the intervention the carcasses were chilled in continuous in-line air chillers to lower their temperature before being packed and dispatched. In Site B carcasses were also sampled at an accessible point between exit from the chiller and final dispatch, where an additional in process temperature check was made.
Due to access (for safety reasons not all processing stages were accessible) and scheduling issues (due to distances between sampling points, line speeds, and the time required to sample at different sampling points) samples could not be collected at the same intended sampling points in the plants on all of the visits. The sampling points where samples were collected at each site on each visit is shown in Table 2 and where, what type of sample, and at what time samples were collected on each visit shown in Table 3. These samples consisted of whole chicken carcass swabs (swabbing and sponging covered whole bird carcass surface area as best as possible), neck skin (excised and weight out for analysis), scalding water samples, crate swab (taken from an ~10cm x 10cm area) and equipment surface swabs (covering an ~30cm x 30cm area).
Table 2.Number of sampling points where samples were collected on each visit.
| Details |
Site A March |
Site B March |
Site A June |
Site B June |
Site A October |
Site B November |
| Number of sampling points |
34 |
33 |
32 |
33 |
32 |
37 |
Table 3.Samples collected on each visit.
| Processing stage (type of sample) - time |
Site A March |
Site B March |
Site A June |
Site B June |
Site A October |
Site B November |
| Crate (litter) - am |
Yes |
Yes |
Yes |
Yes |
Yes |
Yes |
| Crate (litter) - pm |
Yes |
Yes |
Yes |
Yes |
Yes |
Yes |
| Dirty crate (surface) - am |
Yes |
Yes |
Yes |
Yes |
Yes |
Yes |
| Dirty crate (surface) - pm |
Yes |
Yes |
Yes |
Yes |
Yes |
Yes |
| Cleaned crate (surface) - am |
Yes |
Yes |
Yes |
Yes |
Yes |
Yes |
| Cleaned crate (surface) - pm |
Yes |
Yes |
Yes |
Yes |
Yes |
Yes |
| Post-stun (feathers) - am |
Yes |
Yes |
Yes |
Yes |
Yes |
Yes |
| Post-stun (feathers) - pm |
Yes |
Yes |
Yes |
Yes |
Yes |
Yes |
| Post-stun (feet) - am |
Yes |
Yes |
Yes |
Yes |
Yes |
Yes |
| Post-stun (feet) - pm |
Yes |
Yes |
Yes |
Yes |
Yes |
Yes |
| Scalding (water) - am |
Yes |
Yes |
Yes |
Yes |
Yes |
Yes |
| Scalding (water) - pm |
Yes |
Yes |
Yes |
Yes |
Yes |
Yes |
| Post-defeathering (feathers) - am |
Yes |
No |
Yes |
Yes |
Yes |
Yes |
| Post-defeathering (feathers) - pm |
Yes |
No |
Yes |
Yes |
Yes |
Yes |
| Feet removal (feet) - am |
Yes |
Yes |
Yes |
Yes |
Yes |
Yes |
| Feet removal (feet) - pm |
Yes |
No |
Yes |
Yes |
Yes |
Yes |
| Pre-evisceration rehang (carcass) - am |
Yes |
Yes |
Yes |
Yes |
Yes |
Yes |
| Pre-evisceration rehang (carcass) - pm |
Yes |
Yes |
Yes |
Yes |
Yes |
Yes |
| Post-evisceration (viscera) - am |
Yes |
Yes |
Yes |
Yes |
Yes |
Yes |
| Post-evisceration (viscera) - pm |
Yes |
Yes |
Yes |
Yes |
Yes |
Yes |
| Post-mortem inspection (carcass) - am |
Yes |
Yes |
Yes |
Yes |
Yes |
Yes |
| Post-mortem inspection (carcass) - pm |
Yes |
Yes |
Yes |
Yes |
Yes |
Yes |
| Post-mortem inspection (viscera) - am |
Yes |
Yes |
Yes |
Yes |
Yes |
Yes |
| Post-mortem inspection (viscera) - pm |
Yes |
Yes |
Yes |
Yes |
Yes |
Yes |
| Neck skin trim (neck skin) - am |
Yes |
Yes |
Yes |
Yes |
Yes |
Yes |
| Neck skin trim (neck skin) - pm |
Yes |
No |
Yes |
Yes |
Yes |
Yes |
| Post-inside-outside wash (carcass) - am |
Yes |
Yes |
Yes |
No |
Yes |
Yes |
| Post-inside-outside wash (carcass) - pm |
Yes |
Yes |
Yes |
No |
Yes |
Yes |
| Post-intervention (carcass) - am |
Yes |
Yes |
No |
Yes |
No |
Yes |
| Post-intervention (carcass) - pm |
Yes |
Yes |
No |
Yes |
No |
Yes |
| Intervention (equipment surface) - am |
No |
Yes |
No |
Yes |
No |
Yes |
| Intervention (equipment surface) - pm |
No |
Yes |
No |
Yes |
No |
Yes |
| Post-chill (carcass) - am |
Yes |
Yes |
Yes |
Yes |
Yes |
Yes |
| Post-chill (carcass) - pm |
Yes |
Yes |
Yes |
Yes |
Yes |
Yes |
| At temperature check (carcass) - am |
No |
Yes |
No |
Yes |
No |
Yes |
| At temperature check (carcass) - pm |
No |
Yes |
No |
Yes |
No |
Yes |
| At dispatch (carcass) - am |
Yes |
Yes |
Yes |
Yes |
Yes |
Yes |
| At dispatch (carcass) - pm |
Yes |
No |
Yes |
No |
Yes |
No |
2.1.3. Sample collection and transportation
Based on discussions with the project team and the sequencing laboratory (CosmosID, an external laboratory) with which we collaborated on this project, we picked a swabbing/sponge method for sample collection, except for neck skin, which was excised at the factory and deposited in a sampling bag for analysis, and water samples (60 ml), which were directly placed in the sampling tube.
2.2. Isolation, enumeration, and confirmation of Campylobacter spp. and E. coli from samples
For Campylobacter spp., recovery and enumeration was carried out in accordance with ISO 10272-2:2017 (direct method) for the detection and enumeration of Campylobacter spp. in chicken meat (applied with a detection limit of 10 CFU per whole carcass, g, or cm3 of sample tested).
Briefly, to prepare the sample for testing, each sponge was rinsed with 10mL of buffered peptone water (Oxoid, Basingstoke, UK), and 100 μl of the resulting suspension was then subjected to threefold serial dilutions. From each dilution, 0.333ml was inoculated on modified charcoal cefoperazone deoxycholate agar (mCCDA). The plates were incubated for at least 44 hours at 41.5 ± 1°C under microaerobic conditions created with an Oxoid™ CampyGen™ sachet. The presumptive Campylobacter colonies were then further confirmed by inoculating five identical colonies on Columbia blood agar supplemented with defibrinated sheep blood.
For the enumeration, detection, and identification E. coli, 100 μl of each dilution was inoculated on Tryptone Bile X-glucuronide (TBX) agar consisting of chromogen 5-bromo-4-chloro-3-indolyl-beta-D-glucuronide (X-glucuronide). Typical E. coli colonies were counted, and their levels were enumerated with a detection limit of 100 CFU) per whole carcass, g, or cm3 of sample tested.
All presumptive bacterial isolates were further confirmed by a polymerase chain reaction (PCR) analysis. Thereafter, all confirmed bacteria colonies were tested against a broad spectrum of antimicrobial classes. All recovered and confirmed bacteria isolates were retained in storage at ambient temperature for use in further analysis (Antimicrobial Susceptibility Testing (AST) and Whole-Genome Sequencing [WGS]). Confirmed isolates were also placed in glycerol and stored at -80°C for long term storage.
2.3. Antimicrobial Susceptibility Testing (AST) of Campylobacter spp. and E. coli isolates
AST of confirmed Campylobacter spp. and E. coli isolates was carried out against a range of different antimicrobial agents (Table 4 and Table 5 respectively) to determine the resistance profile of the isolates.
Campylobacter spp. isolates were tested against ciprofloxacin, tetracycline, streptomycin, erythromycin, and nalidixic acid (Table 4). Minimal inhibitory concentration (MIC) values for ciprofloxacin (CIP), erythromycin (E), nalidixic acid (NA), streptomycin (S), and tetracycline (TE) were determined by the microdilution method. This panel was chosen in accordance with EUCAST guidelines and recommendations of the European Centre for Disease Prevention and Control (ECDC) (EUCAST, 2023).
All E. coli isolates were tested against amoxicillin + clavulanic acid, ciprofloxacin, ceftriaxone, ceftazidime, cefoxitin, trimethoprim/ sulfamethoxazole, cefotaxime, azithromycin, ampicillin, chloramphenicol, and tetracycline (Table 5) using a disk diffusion method, following guidelines from the Clinical and Laboratory Standards Institute (CLSI, 2024).
Table 4.Antimicrobial agents and breakpoints used for AST of Campylobacter spp. isolates.
| Class |
Family |
Antimicrobial Agent (Concentration) |
Breakpoints (μg/mL) |
| Aminoglycosides |
Aminoglycosides |
Streptomycin – S |
≥8 |
| Macrolides |
Macrolides |
Erythromycin – E (15 µg) |
≥16 |
| Quinolones |
Fluoroquinolones |
Ciprofloxacin – CIP (5 µg) |
≥1 |
| Quinolones |
1st generation quinolones |
Nalidixic acid - NA |
≥32 |
| Tetracycline |
Tetracyclines |
Tetracycline – TE (30 µg) |
≥4 |
Table 5.Antimicrobial agents used for AST of E. coli isolates.
| Class |
Family |
Antimicrobial Agent (Concentration) |
| Beta-lactams |
Aminopenicillin |
Amoxicillin + clavulanic acid - AMC (30 µg) |
| Cephalosporins |
3rd generation cephalosporins |
Cefotaxime - CTX (30 µg) |
| Cephalosporins |
3rd generation cephalosporins |
Ceftriaxone - CRO (30 µg) |
| Cephalosporins |
3rd generation cephalosporins |
Ceftazidime - CAZ (30 µg) |
| Cephalosporins |
2nd generation cephalosporins |
Cefoxitin - FOX (30 µg) |
| Cotrimoxazoles |
Sulfonamides-Trimethoprims |
Trimethoprim/sulfamethoxazole - SXT (25 µg) |
| Macrolides |
Macrolides |
Azithromycin - AZM (15 µg) |
| Penicillins |
Aminopenicillins |
Ampicillin - AMP (2 µg) |
| Phenicols |
Phenicols |
Chloramphenicol - C (30 µg) |
| Quinolones |
Fluoroquinolones |
Ciprofloxacin - CIP (5 µg) |
| Tetracycline |
Tetracycline |
Tetracycline - TE |
2.4. Whole-Genome Sequencing (WGS) of Campylobacter spp. and E. coli isolates
To predict genetic determinants of antibiotic resistance, WGS was conducted on 107 of the isolates that had been characterised using AST. In total 69 E. coli and 38 Campylobacter spp. isolates were selected and sent for WGS.
2.4.1. Campylobacter spp. and E. coli isolates selected along poultry processing stages chosen for further study.
To better understand the ARGs present in Campylobacter spp. and E. coli genomes, isolates that had shown the highest levels of phenotypic AMR (i.e. resistance to the largest number of antimicrobial agents) characterised using AST were selected for WGS. Details of at what stages Campylobacter spp. and E. coli isolates selected for WGS were collected from Site A and Site B are shown in Table 6 and Table 7, respectively.
Table 6.Stages where Campylobacter spp. isolates were selected for WGS analysis.
| Processing stage (type of sample) - time |
Site A Jun |
Site B Jun |
Site A Oct |
Site B Nov |
| Crate (litter) |
Yes*** |
No |
Yes*** |
Yes |
| Dirty crate (surface) |
Yes** |
No |
Yes** |
No |
| Cleaned crate (surface) |
No |
Yes |
No |
No |
| Post-stun (feathers) |
Yes |
Yes |
No |
No |
| Post-stun (feet) |
Yes |
No |
No |
Yes |
| Scalding (water) |
No |
No |
No |
No |
| Post-defeathering (feathers) |
Yes |
Yes |
Yes** |
Yes*** |
| Feet removal (feet) |
No |
No |
No |
No |
| Pre-evisceration rehang (carcass) |
No |
No |
No |
No |
| Post-evisceration (viscera) |
No |
No |
Yes |
No |
| Post-mortem inspection (carcass) |
No |
No |
No |
No |
| Post-mortem inspection (viscera) |
No |
No |
No |
No |
| Neck skin trim (neck skin) |
No |
Yes |
Yes* |
No |
| Post-inside-outside wash (carcass) |
No |
Yes* |
No |
No |
| Post-intervention (carcass) |
No |
No |
No |
No |
| Intervention (equipment surface) |
No |
No |
No |
No |
| Post-chill (carcass) |
No |
Yes* |
No |
No |
| At temperature check (carcass) |
No |
No |
No |
No |
| At dispatch (carcass) |
No |
No |
No |
No |
*Stages where 2 isolates were collected; **Stages where 3 isolates were collected; ***Stages where 4 isolates were collected.
Table 7.Stages where E. coli isolates were selected for WGS analysis.
| Processing stage (type of sample) - time |
Site A Mar |
Site B Mar |
Site A Jun |
Site B Jun |
Site A Oct |
Site B Nov |
| Crate (litter) |
No |
Yes |
Yes* |
Yes |
Yes |
Yes* |
| Dirty crate (surface) |
No |
No |
Yes |
Yes |
Yes |
No |
| Cleaned crate (surface) |
Yes |
Yes* |
Yes |
No |
No |
No |
| Post-stun (feathers) |
Yes |
Yes* |
Yes |
No |
No |
Yes |
| Post-stun (feet) |
No |
No |
Yes |
No |
No |
No |
| Scalding (water) |
No |
Yes |
No |
Yes |
Yes |
Yes |
| Post-defeathering (feathers) |
Yes |
No |
No |
No |
Yes* |
No |
| Feet removal (feet) |
Yes |
No |
Yes |
No |
No |
Yes |
| Pre-evisceration rehang (carcass) |
No |
No |
Yes |
Yes |
Yes |
No |
| Post-evisceration (viscera) |
No |
Yes |
Yes |
Yes |
Yes* |
Yes* |
| Post-mortem inspection (carcass) |
No |
Yes |
Yes* |
No |
No |
No |
| Post-mortem inspection (viscera) |
Yes |
No |
Yes |
No |
No |
No |
| Neck skin trim (neck skin) |
No |
Yes |
Yes |
Yes |
Yes** |
Yes* |
| Post-inside-outside wash (carcass) |
No |
Yes |
Yes |
No |
Yes* |
No |
| Post-intervention (carcass) |
No |
Yes |
No |
No |
No |
Yes |
| Intervention (equipment surface) |
No |
No |
No |
No |
No |
No |
| Post-chill (carcass) |
No |
No |
No |
Yes |
Yes |
Yes* |
| At temperature check (carcass) |
No |
Yes |
No |
No |
No |
No |
| At dispatch (carcass) |
No |
Yes |
Yes |
No |
Yes |
Yes |
*Stages where 2 isolates were collected; **Stages where 3 isolates were collected.
2.4.2. Whole Genome Sequencing (WGS)
DNA extraction was conducted using the Promega Wizard Genomic DNA Extraction Kit (Madison, WI, USA), following the manufacturer’s protocol. Libraries for Illumina reads was prepared with the Illumina Nextera XT kit and libraries were assessed for quality with Qubit (Thermo Fisher, Waltham, MA) prior to WGS.
All the WGS was carried out by CosmosID, an external laboratory. Samples were sequenced on an Illumina NextSeq 550 platform (San Diego, CA, USA), producing paired-end reads at a maximum length of 150 bases. Raw sequence data trimming was performed for adapters and low-quality bases using bbduk and applying standard parameters (phred quality trimq = 22, and minimum length minlen = 36).
De novo assembly was performed in PATRIC v. p3-build-178 via Unicycler version 0.4.8 with minimum contig length cutoff set of 300bp. Quality assessment of assemblies was performed with QUAST version 5.0.2, SamTools version 13, and Pilon version 1.23. Closest reference genomes were identified by Mash/MinHash employing the PATRIC database. Upon submission to GenBank (Bioproject PRJNA674638), assemblies were reannotated using the NCBI Prokaryotic Genome Annotation Pipeline (PGAP) v. 6.2. The Genomic library was prepared using Illumina TruSeq Nano DNA library preparation kit supplied by Illumina Inc. Pair-end sequencing (2 x 150 base pairs) was performed using Illumina NovaSeq 6000. The quality of sequence reads was determined using FastQC Version 0.12.0. Adapter trimming, quality filtering, and per-read quality pruning was performed using fastp software. The sequence reads were merged using PEAR v0.9.6. The filtered paired-end reads were de novo assembled using SPAdes v3.15.3. Genome quality and completeness was evaluated using CheckM v1.0.18. while quality assessment of the assembled sequence was done using QUality ASsessment Tool (QUAST) v5.2.0. Staramr v0.10 was used to examine plasmids, virulence determinants, and ARGs.
The quality of sequence reads was determined using FastQC Version 0.12.0. Adapter trimming, quality filtering, and per-read quality pruning was performed using fastp software. The sequence reads were merged using PEAR v0.9.6. The filtered paired-end reads were de novo assembled using SPAdes v3.15.3. Genome quality and completeness was evaluated using CheckM v1.0.18. while quality assessment of the assembled sequence was done using QUality ASsessment Tool (QUAST) v5.2.0. The identity of the presumptive isolates was confirmed using the MASH algorithm, with average nucleotide identity of our genomes to reference strains ranging from 97% to 99.1%, identifying them as either C. jejuni or E. coli. Staramr v0.10 was used to examine plasmids, virulence determinants, ARGs, and the MLST profile. For E. coli, the Achtman MLST scheme was used.
Shotgun metagenomic sequencing of samples collected across the processing chain on each visit to the two poultry processing sites was carried out to determine the diversity and abundance of bacteria, ARGs, and phages present in samples. In all 201 samples collected from both poultry sites in this project were sent for shotgun metagenomic sequencing.
Samples were processed as follows: The QIAGEN DNeasy PowerFood Pro Kit was used to extract genomic DNA from samples according to the manufacturer’s instructions. The extracted DNA was tested for quality and quantity using a Qubit 4 fluorometer and Thermofisher Scientific’s QubitTM dsDNA HS Assay Kit. DNA was then transported to CosmosID (a commercial external laboratory) for library preparation and sequencing. Briefly, the Nextera XT DNA Library Preparation Kit (Illumina) was used to produce genomic DNA libraries, which were then indexed using the IDT Unique Dual adapters with a total DNA input of 1ng. The genomic DNA was fragmented with a proportionate quantity of Illumina Nextera XT fragmentation enzyme prior to amplification. Following that, adapters were added to each sample, followed by 12 cycles of PCR amplification to create libraries. The DNA libraries were purified with Beckman Coulter Ampure magnetic beads and eluted in QIAGEN EB buffer. The Qubit 4 fluorometer and QubitTM dsDNA HS Assay Kit were used to confirm the quality and quantity of DNA libraries. Afterwards, the libraries were sequenced at 2x150bp on an Illumina NovaSeq 6000 platform.
Bioinformatic analysis was carried out on the CosmosID interface (CosmosID Metagenomics Cloud, CosmosID Inc.,). To quote the CosmosID method document, “The system utilizes a high-performance data-mining k-mer algorithm that rapidly disambiguates millions of short sequences reads into the discrete genomes engendering the particular sequences. The pipeline has two separable comparators: the first consists of a pre-computation phase for reference databases and the second is a per-sample computation. The input to the pre-computation phase are databases of reference genomes, virulence markers and antimicrobial resistance markers that are continuously curated by CosmosID scientists. The output of the pre-computational phase is a phylogeny tree of microbes, together with sets of variable length k-mer fingerprints (biomarkers) uniquely associated with distinct branches and leaves of the tree. The second per-sample computational phase searches the hundreds of millions of short sequence reads, or alternatively contigs from draft de novo assemblies, against the fingerprint sets. This query enables the sensitive yet highly precise detection and taxonomic classification of microbial NGS reads. The resulting statistics are analysed to return the fine-grain taxonomic and relative abundance estimates for the microbial NGS datasets. To exclude false positive identifications the results are filtered using a filtering threshold derived based on internal statistical scores that are determined by analysing a large number of diverse metagenomes. The same approach is applied to enable the sensitive and accurate detection of genetic markers for virulence and for resistance to antibiotics.”
3. Results
All results are presented in this section except for the systematic review. A detailed summary of the literature can be found in the Appendix of this report.
3.1. Field and laboratory sampling and analysis
This section presents the findings from our comprehensive field and laboratory investigations involving sample collection from 2 poultry processing environments and laboratory analysis using traditional and molecular biology techniques.
Site A and Site B were two chicken processing facilities with some notable similarities and differences. Both sites operate two processing lines and source their chickens from Red Tractor Assurance (RTA) farms in the UK. However, Site A has a higher processing capacity, handling up to 400,000 birds per day from Monday to Thursday and 200,000 birds on Friday and Saturday, with faster line speeds of about 217 birds per minute. In contrast, Site B processes 320,000 to 370,000 birds daily across two shifts, with slower line speeds of 175 birds per minute. A total of 17 farms supplied all the chickens processed in Site A during the collection period and a total of 16 farms supplied Site B during the collection period. The number of farms supplying each site varied slightly across different visits, ranging from 5 to 7 for both sites. Site A’s supplying farms were generally closer, with average distances ranging from 18 to 23 miles, while Site B’s farms were farther away, with average distances between 50 and 82 miles. Both sites showed some variation in their supplying farms across different visits, in addition in Site B there were variations in the farms that supply each processing line on each collection day. For Site A October collection all farms that supplied chicken varied completely from farms that supplied March and June samples.
For the laboratory sampling and analysis, we report on:
-
the prevalence and distribution of Campylobacter spp. and E. coli throughout various stages of poultry processing;
-
antimicrobial susceptibility profiles of isolates, including MIC data;
-
the resistance patterns observed in isolates across different processing stages;
-
WGS analysis of individual bacterial isolates, focusing on the identification of ARGs and plasmids,
and finally,
-
shotgun metagenomic analysis to assess genetic diversity among isolates and detect ARGs within the broader microbial community.
3.1.1. Occurrence of Campylobacter spp. and E. coli along the processing chain
In this study a total 376 samples were collected along the processing line in 2 poultry plants on 3 visits to each. In Table 8 and 9, “No”: Indicates that the specific bacterium was not isolated from the sample; “Yes”: Indicates that the specific bacterium was successfully isolated from the sample and “Ns” (Not Sampled): Indicates that no sample was collected or analysed for the specific bacterium at this point or stage.
Of these 376 samples, 65.1% were positive for Campylobacter spp. (Table 8). Generally, Campylobacter spp. were detected at fewer processing stages in both plants as the carcasses progressed along the processing chain, although Campylobacter spp. were still detected in samples at late processing stages.
Table 8.The number of samples collected at different processing points in both plants that were positive for the presence of Campylobacter spp.
| Processing stage |
am (1) |
am (2) |
am (3) |
pm (1) |
pm (2) |
pm (3) |
| Crate (litter) - Site A - June |
Yes |
Yes |
Yes |
Yes |
Yes |
Yes |
| Crate (litter) - Site B - June |
Yes |
Yes |
Yes |
Yes |
Yes |
Yes |
| Crate (litter) - Site A - October |
Yes |
Yes |
Yes |
Yes |
Yes |
Yes |
| Crate (litter) - Site B - November |
Yes |
Yes |
Yes |
Yes |
Yes |
Yes |
| Crate (dirty) - Site A - June |
Yes |
Yes |
Yes |
Yes |
Yes |
Yes |
| Crate (dirty) - Site B - June |
Yes |
Yes |
Yes |
Yes |
Yes |
Yes |
| Crate (dirty) - Site A - October |
Yes |
Yes |
Yes |
Yes |
Yes |
No |
| Crate (dirty) - Site B - November |
No |
Yes |
Yes |
Yes |
Yes |
Yes |
| Crate (clean) - Site A - June |
Yes |
Yes |
Yes |
Yes |
Yes |
Yes |
| Crate (clean) - Site B - June |
Yes |
Yes |
No |
Yes |
Yes |
Yes |
| Crate (clean) - Site A - October |
No |
No |
No |
No |
No |
No |
| Crate (clean) - Site B - November |
No |
No |
No |
No |
No |
No |
| Post-Stun (feathers) - Site A - June |
Yes |
Yes |
Yes |
Yes |
Yes |
Yes |
| Post-Stun (feathers) - Site B - June |
Yes |
Yes |
No |
Yes |
Yes |
No |
| Post-Stun (feathers) - Site A - October |
No |
No |
No |
No |
Yes |
Yes |
| Post-Stun (feathers) - Site B - November |
Yes |
Yes |
Yes |
Ns |
Ns |
Ns |
| Pre-Evisceration rehang (carcass) - Site A - June |
No |
Yes |
No |
Yes |
Yes |
Yes |
| Post-Stun (feet)- Site A - June |
Yes |
Yes |
Yes |
Yes |
Yes |
Yes |
| Post-Stun (feet) - Site A - October |
No |
No |
No |
No |
No |
No |
| Post-Stun (feet) - Site B - November |
Yes |
Yes |
Yes |
No |
Yes |
No |
| Scalding (water)- Site A - June |
Yes |
Yes |
Yes |
Yes |
Yes |
Yes |
| Scalding (water) - Site B - June |
Yes |
Yes |
Yes |
Yes |
Yes |
Yes |
| Scalding (water) - Site A - October |
No |
No |
No |
No |
Yes |
No |
| Scalding (water) - Site B - November |
No |
No |
No |
Yes |
Yes |
Yes |
| Post-Defeathering_Foot removal (feathers)- Site A - June |
Yes |
Yes |
Yes |
Yes |
Yes |
Yes |
| Post-Defeathering_Foot removal (feathers) - Site A - Oct |
Yes |
Yes |
Yes |
No |
No |
Yes |
| Post-Defeathering_Foot removal (feet)- Site A - June |
Yes |
Yes |
Yes |
Yes |
Yes |
Yes |
| Post-Defeathering_Foot removal (feet) - Site B - June |
Yes |
Yes |
Yes |
Yes |
Yes |
Yes |
| Post-Defeathering_Foot removal (feet) - Site A - October |
Yes |
Yes |
No |
No |
No |
No |
| Post-Defeathering_Foot removal (feet) - Site B - Nov |
Yes |
Yes |
Yes |
Yes |
Yes |
Yes |
| Neck skin trim (neck skin)- Site A - June |
Yes |
Yes |
Yes |
Yes |
Yes |
Yes |
| Pre-Evisceration rehang (carcass) - Site B - June |
Yes |
Yes |
Yes |
Yes |
Yes |
Yes |
| Pre-Evisceration rehang (carcass) - Site A - October |
No |
No |
No |
No |
No |
No |
| Pre-Evisceration rehang (carcass) - Site B - Nov |
No |
No |
No |
No |
No |
No |
| Post Mortem (PM) Inspection (carcass) - Site A - June |
Yes |
Yes |
Yes |
Yes |
Yes |
Yes |
| Post-Evisceration (viscera) - Site B - June |
Yes |
Yes |
Yes |
Yes |
Yes |
Yes |
| Post-Evisceration (viscera) - Site A - October |
No |
Yes |
Yes |
No |
No |
No |
| Post-Evisceration (viscera) - Site B - November |
Yes |
Yes |
Yes |
Yes |
Yes |
Yes |
| Post Mortem (PM) Inspection (viscera)- Site A - June |
Yes |
Yes |
Yes |
Yes |
Yes |
Yes |
| Post Mortem (PM) Inspection (carcass) - Site B - June |
Yes |
Yes |
Yes |
Yes |
Yes |
Yes |
| Post Mortem (PM) Inspection (carcass) - Site A - Oct |
No |
No |
No |
No |
No |
No |
| Post Mortem (PM) Inspection (carcass) - Site B - Nov |
Yes |
No |
No |
No |
No |
No |
| Post Inside Outside (IO) wash (carcass) - Site A - June |
Yes |
Yes |
Yes |
Yes |
Yes |
Yes |
| Post Mortem (PM) Inspection (viscera) - Site B - June |
Yes |
Yes |
Yes |
Yes |
Yes |
Yes |
| Post Mortem (PM) Inspection (viscera) - Site A - October |
No |
No |
No |
No |
No |
Yes |
| Post Mortem (PM) Inspection (viscera) - Site B - November |
Yes |
Yes |
Yes |
Yes |
Yes |
Yes |
| Neck skin trim (neck skin) - Site B - June |
Yes |
Yes |
Yes |
Yes |
No |
No |
| Neck skin trim (neck skin) - Site A - October |
Yes |
Yes |
Yes |
Yes |
Yes |
Yes |
| Neck skin trim (neck skin) - Site B - November |
Yes |
Yes |
Yes |
Yes |
Yes |
Yes |
| Post-intervention (equipment) - Site B - June |
Yes |
Yes |
Yes |
Yes |
No |
Yes |
| Inside Outside (IO) wash (carcass) - Site B - June |
Yes |
Yes |
Yes |
Yes |
Yes |
Yes |
| Inside Outside (IO) wash (carcass) - Site A - Oct |
No |
No |
No |
No |
No |
No |
| Inside Outside (IO) wash (carcass) - Site B - Nov |
Yes |
No |
No |
No |
No |
Yes |
| Post-Intervention (carcass) - Site B - June |
Yes |
Yes |
Yes |
Yes |
Yes |
Yes |
| Post-Intervention (carcass) - Site B - November |
No |
No |
No |
No |
No |
No |
| Post-intervention (equipment) - Site B - November |
No |
No |
No |
No |
No |
No |
| Post-Evisceration (viscera)- Site A - June |
Yes |
Yes |
Yes |
Yes |
Yes |
Yes |
| Post-Chill (carcass) - Site A - June |
No |
Yes |
Yes |
No |
Yes |
Yes |
| Post-Chill (carcass) - Site B - June |
Yes |
Yes |
No |
No |
Yes |
No |
| Post-Chill (carcass) - Site A - October |
No |
No |
No |
No |
No |
No |
| Post-Chill (carcass) - Site B - November |
Yes |
No |
No |
No |
No |
No |
| At temperature check (carcass) - Site B - June |
Yes |
Yes |
Yes |
Yes |
No |
Yes |
| At temperature check (carcass) - Site B - Nov |
Yes |
Yes |
Yes |
No |
No |
No |
| At Dispatch (carcass) - Site A - June |
No |
No |
No |
No |
Yes |
No |
| At Dispatch (carcass) - Site B - June |
Yes |
No |
Yes |
Ns |
Ns |
Ns |
| At Dispatch (carcass) - Site A - October |
No |
No |
No |
No |
No |
No |
| At Dispatch (carcass) - Site B - November |
No |
No |
No |
Ns |
Ns |
Ns |
E. coli were ubiquitous in samples collected along the processing chain in both sites on all visits, with E. coli being detected in 95.6% of samples (Table 9).
Table 9.Where samples collected at different processing points in both plants that were positive for the presence of E. coli.
| Processing stage |
am (1) |
am (2) |
am (3) |
pm (1) |
pm (2) |
pm (3) |
| Crate (litter) – Site A – June |
Yes |
Yes |
Yes |
Yes |
Yes |
Yes |
| Crate (litter) – Site B – June |
Yes |
Yes |
Yes |
Yes |
Yes |
Yes |
| Crate (litter) – Site A – October |
Yes |
Yes |
Yes |
Yes |
Yes |
Yes |
| Crate (litter) – Site B – November |
Yes |
Yes |
Yes |
Yes |
Yes |
Yes |
| Crate (dirty) – Site A – June |
Yes |
Yes |
Yes |
Yes |
Yes |
Yes |
| Crate (dirty) – Site B – June |
Yes |
Yes |
Yes |
Yes |
Yes |
Yes |
| Crate (dirty) – Site A – October |
Yes |
Yes |
Yes |
Yes |
Yes |
Yes |
| Crate (dirty) – Site B – November |
Yes |
Yes |
Yes |
Yes |
Yes |
Yes |
| Crate (clean) – Site A – June |
Yes |
Yes |
Yes |
No |
No |
No |
| Crate (clean) – Site B – June |
Yes |
Yes |
Yes |
Yes |
Yes |
Yes |
| Crate (clean) – Site A – October |
No |
No |
No |
Yes |
Yes |
Yes |
| Crate (clean) – Site B – November |
Yes |
Yes |
Yes |
Yes |
Yes |
Yes |
| Post-Stun (bird with feathers) – Site A – June |
Yes |
No |
Yes |
Yes |
Yes |
Yes |
| Post-Stun (bird with feathers) – Site B – June |
Yes |
Yes |
Yes |
Yes |
Yes |
Yes |
| Post-Stun (bird with feathers) - Site A – October |
Yes |
Yes |
Yes |
Yes |
Yes |
Yes |
| Post-Stun (bird with feathers) – Site B – November |
Yes |
Yes |
Yes |
Ns |
Ns |
Ns |
| Post-Stun (feet) – Site A – June |
Yes |
Yes |
Yes |
Yes |
Yes |
Yes |
| Post-Stun (feet) – Site A – October |
Yes |
Yes |
Yes |
Yes |
Yes |
Yes |
| Post-Stun (feet) – Site B – November |
Yes |
Yes |
Yes |
Yes |
Yes |
Yes |
| Scalding (water)- Site A – June |
Yes |
Yes |
Yes |
Yes |
Yes |
Yes |
| Scalding (water) – Site B – June |
Yes |
Yes |
Yes |
Yes |
Yes |
Yes |
| Scalding (water) – Site A – October |
Yes |
Yes |
Yes |
Yes |
Yes |
Yes |
| Scalding (water) – Site B – November |
No |
No |
No |
Yes |
Yes |
Yes |
| Post-Defeathering_Foot removal (feathers) – Site A – June |
Yes |
Yes |
Yes |
Yes |
Yes |
Yes |
| Post-Defeathering_Foot removal (feathers) – Site A – Oct |
Yes |
Yes |
Yes |
Yes |
Yes |
Yes |
| Post-Defeathering_Foot removal (feet)- Site A – June |
Yes |
Yes |
Yes |
Yes |
Yes |
Yes |
| Post-Defeathering_Foot removal (feet) – Site B – June |
Yes |
Yes |
Yes |
Yes |
Yes |
Yes |
| Post-Defeathering_Foot removal (feet) – Site A – Oct |
Yes |
Yes |
Yes |
Yes |
Yes |
Yes |
| Post-Defeathering_Foot removal (feet) – Site B – Nov |
Yes |
Yes |
Yes |
Yes |
Yes |
Yes |
| Pre-Evisceration rehang (carcass) – Site A – June |
Yes |
Yes |
Yes |
Yes |
Yes |
Yes |
| Pre-Evisceration rehang (carcass) – Site B – June |
Yes |
Yes |
Yes |
Yes |
Yes |
Yes |
| Pre-Evisceration rehang (carcass) – Site A – October |
Yes |
Yes |
Yes |
Yes |
Yes |
Yes |
| Pre-Evisceration rehang (carcass) – Site B – November |
Yes |
Yes |
No |
Yes |
Yes |
Yes |
| Post-Evisceration (viscera) – Site A – June |
Yes |
Yes |
Yes |
Yes |
Yes |
Yes |
| Post-Evisceration (viscera) – Site B – June |
Yes |
Yes |
Yes |
Yes |
Yes |
Yes |
| Post-Evisceration (viscera) – Site A – October |
Yes |
Yes |
Yes |
Yes |
Yes |
Yes |
| Post-Evisceration (viscera) – Site B – November |
Yes |
Yes |
Yes |
Yes |
Yes |
Yes |
| Post Mortem (PM) Inspection (carcass) – Site A – June |
Yes |
Yes |
Yes |
Yes |
Yes |
Yes |
| Post Mortem (PM) Inspection (carcass) – Site B – June |
Yes |
Yes |
Yes |
Yes |
Yes |
Yes |
| Post Mortem (PM) Inspection (carcass) – Site A – October |
Yes |
Yes |
Yes |
Yes |
Yes |
Yes |
| Post Mortem (PM) Inspection (carcass) – Site B – Nov |
Yes |
Yes |
Yes |
Yes |
Yes |
Yes |
| Post Mortem (PM) Inspection (viscera) – Site A – June |
Yes |
Yes |
Yes |
Yes |
Yes |
Yes |
| Post Mortem (PM) Inspection (viscera) – Site B – June |
Yes |
Yes |
Yes |
Yes |
Yes |
Yes |
| Post Mortem (PM) Inspection (viscera) – Site A – October |
Yes |
Yes |
Yes |
Yes |
Yes |
Yes |
| Post Mortem (PM) Inspection (viscera) – Site B – Nov |
Yes |
Yes |
Yes |
Yes |
Yes |
Yes |
| Neck skin trim (neck skin) – Site A – June |
Yes |
Yes |
Yes |
Yes |
Yes |
Yes |
| Neck skin trim (neck skin) – Site B – June |
Yes |
Yes |
Yes |
Yes |
Yes |
Yes |
| Neck skin trim (neck skin) – Site A – October |
Yes |
Yes |
Yes |
Yes |
Yes |
Yes |
| Neck skin trim (neck skin) – Site B – November |
Yes |
Yes |
Yes |
Yes |
Yes |
Yes |
| Inside Outside (IO) wash (carcass) – Site A – June |
Yes |
Yes |
Yes |
Yes |
Yes |
Yes |
| Inside Outside (IO) wash (carcass) – Site A – October |
Yes |
Yes |
Yes |
Yes |
Yes |
Yes |
| Inside Outside (IO) wash (carcass) – Site B – November |
Yes |
Yes |
Yes |
Yes |
Yes |
Yes |
| Post-Intervention (carcass) – Site B – June |
Yes |
Yes |
Yes |
Yes |
Yes |
Yes |
| Post-Intervention (carcass) – Site B – November |
Yes |
Yes |
Yes |
Yes |
Yes |
Yes |
| Post-intervention (equipment) – Site B – June |
Yes |
Yes |
Yes |
Yes |
Yes |
Yes |
| Post-intervention (equipment) – Site B – November |
No |
No |
No |
No |
No |
No |
| Post-Chill (carcass) – Site A – June |
Yes |
Yes |
Yes |
Yes |
Yes |
Yes |
| Post-Chill (carcass) – Site B – June |
Yes |
Yes |
Yes |
Yes |
Yes |
Yes |
| Post-Chill (carcass) – Site A – October |
Yes |
Yes |
Yes |
Yes |
Yes |
Yes |
| Post-Chill (carcass) – Site B – November |
Yes |
Yes |
Yes |
Yes |
Yes |
Yes |
| At temperature check (carcass) – Site B – June |
Yes |
Yes |
Yes |
Yes |
Yes |
Yes |
| At temperature check (carcass) – Site B – November |
Yes |
Yes |
Yes |
Ns |
Ns |
Ns |
| At Dispatch (carcass) – Site A – June |
Yes |
Yes |
Yes |
Yes |
Yes |
Yes |
| At Dispatch (carcass) – Site B – June |
Yes |
Yes |
Yes |
Yes |
Yes |
Yes |
| At Dispatch (carcass) – Site A – October |
Yes |
Yes |
Yes |
Yes |
Yes |
Yes |
| At Dispatch (carcass) – Site B – November |
Yes |
Yes |
Yes |
Ns |
Ns |
Ns |
3.1.2. Levels of Campylobacter spp. measured along the processing chain.
Numbers of Campylobacter spp. ranged from 1.00±0.0 to 3.9±0.5 Log10 CFU per sample (Figure 1 to Figure 4). The highest numbers were measured in chicken litter. Samples collected at either site at some processing stages yielded no detectable Campylobacter spp.. Generally, Campylobacter spp. numbers decreased to non-detectable levels as sampling progressed along the processing chain, with fewer Campylobacter spp. detected in samples from later processing stages.
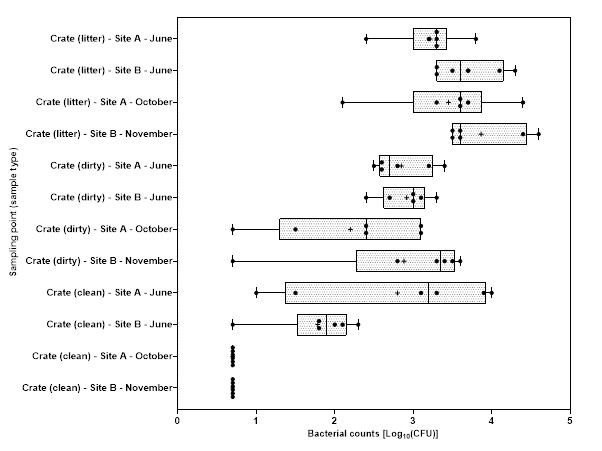
Figure 1.Campylobacter spp. counts on crates samples at sites A and B in June and October or November 2023.

Figure 2.Campylobacter spp. counts on carcass samples collected at sites A and B in June and October or November 2023.

Figure 3.Campylobacter spp. counts on viscera samples collected at sites A and B in June and October or November 2023.

Figure 4.Campylobacter spp. counts obtained from feet, water, feathers, neck skin and equipment swab samples collected at sites A and B in June and October or November 2023.
3.1.3. Levels of E. coli measured along the processing chain
Mean E. coli numbers ranged from 2.0±0.0 to 8.3±0.2 Log10 CFU per sample (Figure 5 to Figure 8). As with Campylobacter spp., the highest number of E. coli were detected in chicken litter. Although E. coli numbers showed a general decrease along the processing chain, unlike Campylobacter spp., E. coli remained detectable in samples taken at later processing stages.

Figure 5.E. coli counts on crates samples at sites A and B in June and October or November 2023.
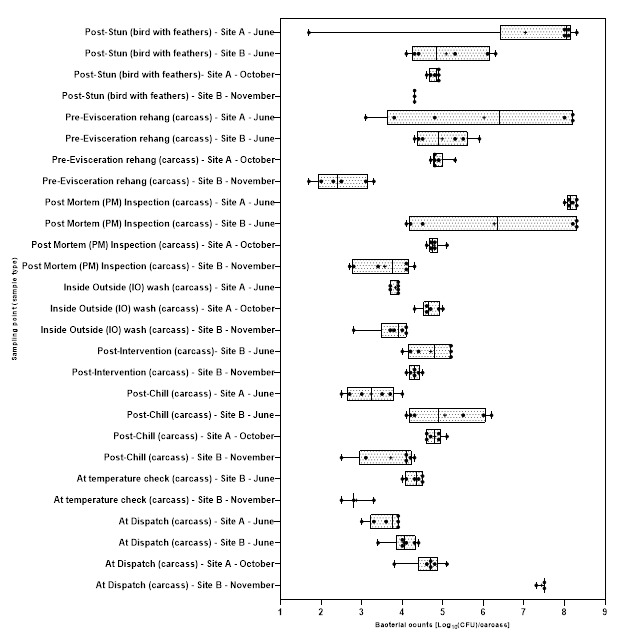
Figure 6.E. coli counts on carcass samples collected at sites A and B in June and October or November 2023.
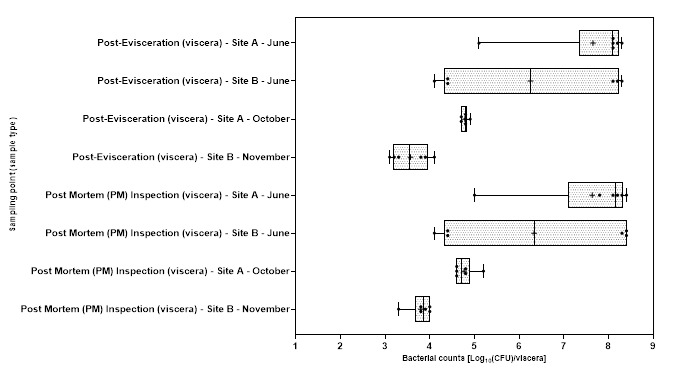
Figure 7.E. coli counts on viscera samples collected at sites A and B in June and October or November 2023.

Figure 8.E. coli counts obtained from feet, water, feather, neck skin and equipment swab samples collected at sites A and B in June and October or November 2023.
3.1.4. Antibiotic Susceptibility Testing (AST) of Campylobacter spp. and E. coli isolates
3.1.5. Campylobacter spp.
All isolates were confirmed to be C. jejuni. The resistance of isolates to each antimicrobial agent tested were variable according to site and collection month. A total of 137 Campylobacter spp. isolates were selected from the two sites and from different processing stage where possible. The summary interpretation of MIC for ciprofloxacin, erythromycin, nalidixic acid, streptomycin and tetracycline and individual MIC results for Campylobacter spp. isolates collected from different sites and different collection periods are shown in Notably, there are substantial differences in percentage resistance rates between sites and time periods for the same antimicrobial agent in some instances.
Table 10 and Figure 9. Also, overall antimicrobial resistance profile of all of the Campylobacter spp. isolates to the 5 antimicrobial agents tested are presented in Table 11.
From the Campylobacter spp. isolates collected from each site during each collection period, AST data reveal variations in percentage resistance among the different antimicrobials and sampling site. The highest percentage of resistance was recorded for tetracycline (72%) in isolates from Site B in November. Resistance to this antimicrobial agent demonstrated the highest variability, with only 32% of isolates from Site A in October being resistant to this agent. Isolates generally showed a lower resistance to streptomycin and nalidixic acid. No isolates from Site A collected in October showed any resistance to erythromycin or nalidixic acid in ( Notably, there are substantial differences in percentage resistance rates between sites and time periods for the same antimicrobial agent in some instances.
Table 10 and Figure 9). Ciprofloxacin resistance showed considerable variability, with resistance rates ranging from 9% (in isolates from Site A in October) to 60% (in isolates from Site B in June).
Overall, a higher percentage of resistance was recorded for tetracycline in all of the isolates. Of the total 137 Campylobacter spp. isolates examined, 53% (72/137) were resistant to tetracycline and 7% (9/13%) were resistant to erythromycin, the lowest resistance recorded overall (Table 11). Notably, there are substantial differences in percentage resistance rates between sites and time periods for the same antimicrobial agent in some instances.
Table 10.Minimum Inhibitory Concentration (MIC) Data - Number of Campylobacter spp. isolates inhibited by different concentrations of antimicrobial agents and their breakpoints for Site A and B in June and October or November 2023.
Antimicrobial agent
(Breakpoint) |
32
(μg/mL) |
16
(μg/mL) |
8
(μg/mL) |
4
(μg/mL) |
2
(μg/mL) |
1
(μg/mL) |
0.5
(μg/mL) |
0.25
(μg/mL) |
0.125
(μg/
mL) |
R |
% |
| Cip (≥1) – Site A - Jun |
0 |
0 |
0 |
0 |
0 |
9 |
1 |
1 |
18 |
9 |
31 |
| Cip (≥1) – Site A - Oct |
0 |
0 |
1 |
0 |
0 |
2 |
6 |
4 |
21 |
3 |
9 |
| Cip (≥1) – Site B - Jun |
0 |
0 |
0 |
0 |
1 |
11 |
2 |
2 |
4 |
12 |
60 |
| Cip (≥1) – Site B - Nov |
0 |
5 |
0 |
4 |
0 |
2 |
19 |
3 |
21 |
11 |
20 |
| E (≥16) – Site A - Jun |
0 |
1 |
2 |
1 |
3 |
6 |
7 |
3 |
6 |
1 |
3 |
| E (≥16) – Site A - Oct |
0 |
0 |
0 |
0 |
0 |
2 |
0 |
1 |
31 |
0 |
0 |
| E (≥16) – Site B - Jun |
4 |
1 |
3 |
1 |
0 |
9 |
1 |
1 |
0 |
5 |
25 |
| E (≥16) – Site B - Nov |
3 |
0 |
0 |
0 |
2 |
2 |
7 |
1 |
39 |
3 |
6 |
| NA (≥32) – Site A - Jun |
4 |
1 |
0 |
3 |
2 |
3 |
6 |
7 |
3 |
4 |
14 |
| NA (≥32) – Site A - Oct |
0 |
4 |
1 |
9 |
0 |
0 |
2 |
1 |
17 |
0 |
0 |
| NA (≥32) – Site B - Jun |
2 |
0 |
4 |
1 |
0 |
2 |
5 |
4 |
2 |
2 |
10 |
| NA (≥32) – Site B - Nov |
11 |
9 |
8 |
12 |
8 |
4 |
0 |
0 |
2 |
11 |
20 |
| S (≥8) – Site A - Jun |
3 |
1 |
1 |
3 |
4 |
5 |
5 |
4 |
3 |
5 |
17 |
| S (≥8) – Site A - Oct |
3 |
0 |
0 |
2 |
0 |
0 |
4 |
0 |
25 |
3 |
9 |
| S (≥8) – Site B - Jun |
0 |
0 |
4 |
10 |
2 |
2 |
1 |
1 |
0 |
4 |
20 |
| S (≥8) – Site B - Nov |
9 |
0 |
0 |
5 |
4 |
5 |
9 |
0 |
22 |
9 |
17 |
| TE (≥4) – Site A - Jun |
9 |
2 |
1 |
3 |
2 |
2 |
6 |
2 |
2 |
15 |
52 |
| TE (≥4) – Site A - Oct |
3 |
6 |
0 |
2 |
0 |
2 |
18 |
1 |
2 |
11 |
32 |
| TE (≥4) – Site B - Jun |
0 |
0 |
2 |
5 |
2 |
4 |
7 |
0 |
0 |
7 |
35 |
| TE (≥4) – Site B - Nov |
23 |
15 |
1 |
0 |
0 |
1 |
9 |
0 |
5 |
39 |
72 |
Ciprofloxacin – CIP; Erythromycin – E; Nalidixic acid – NA; Streptomycin – S; Tetracycline – TE; *R – Resistant; Jun = June: Oct = October; Nov = November

Figure 9.Antimicrobial resistance / susceptibility profile of Campylobacter spp. isolated from Sites A and B in June, and October or November 2023 (where CIP = Ciprofloxacin; E = Erythromycin; NA = Nalidixic acid; S = Streptomycin; TE = Tetracycline).
Table 11.Overall antimicrobial resistance profile of all of the Campylobacter spp. isolates to the 5 antimicrobial agents tested.
| Antimicrobial agent |
Number of resistant isolates |
| Ciprofloxacin |
35/137 (26%) |
| Erythromycin |
9/137 (7%) |
| Nalidixic acid |
17/137 (12%) |
| Streptomycin |
21/137 (15%) |
| Tetracycline |
72/137 (53%) |
MDR (defined as reduced susceptibility to at least three antimicrobial classes) was found in 7% of all of the Campylobacter spp. isolates examined (Table 12). No Campylobacter spp. isolate was resistant to all 5 antimicrobial agents and in total 38 (28%) were fully sensitive to all antimicrobial agents tested.
Table 12.Multi resistance profiles of Campylobacter spp. isolated from Sites A and B in June, and October or November 2023.
| Susceptibility |
Site A Jun |
Site B Jun |
Site A Oct |
Site B Nov |
Total
(%) |
| MDR, resistant to 3 or more classes of antimicrobial |
2/29
(14%) |
4/20
(20%) |
0/34
(0%) |
3/54
(6%) |
9/137 (7%) |
| Resistant to 5 antimicrobial agents |
0/29 (0%) |
0/20 (0%) |
0/34 (0%) |
0/34 (0%) |
0/137
(0%) |
| Resistant to 4 antimicrobial agents |
0/29 (0%) |
2/20 (7%) |
0/34 (0%) |
0/34 (0%) |
2/137
(1%) |
| Resistant to 3 antimicrobial agents |
2/29 (7%) |
2/20 (7%) |
0/34 (0%) |
0/34 (0%) |
12/137
(9%) |
| Resistant to 2 antimicrobial agents |
6/29 (21%) |
4/20 (14%) |
5/34 (18%) |
5/34 (18%) |
25/137
(18%) |
| Resistant to 1 antimicrobial agent |
16/29 (56%) |
8/20 (28%) |
7/34 (25%) |
7/34 (25%) |
60/137
(44%) |
| Susceptible to all 5 antimicrobial agents |
5/29 (18%) |
4/20 (14%) |
22/34 (76%) |
22/34 (76%) |
38/137
(28%) |
The following tables (Due to the lower frequency of Campylobacter spp. isolation and the lack of representative isolates for some processing stages, it is difficult to draw definitive conclusions from the results. However, the pattern of percentage resistance varied between sites and collection periods. As processing progressed, the percentage of resistance did not consistently change but fluctuated across different stages where Campylobacter spp. were isolated. Additionally, isolates from post-intervention stages did not consistently demonstrate any clear change in resistance. Though it should be noted that fewer Campylobacter spp. were isolated from later processing stages than processing stages earlier in the process at all sites, and no Campylobacter spp. isolates were isolated from samples taken at late stage processing stages on some visits, such as in Site A on both the June and October visits where no isolates post-neck skin cutting were detected.
Table 13 – Table 16) show the percentage of resistant and susceptible Campylobacter spp. isolates collected from Site A and Site B in June and October or November 2023 against the 5 antimicrobial agents tested. Each table represents the percentage resistant Campylobacter spp. isolates collected at different site and different collection period; Site A, June Collection (Due to the lower frequency of Campylobacter spp. isolation and the lack of representative isolates for some processing stages, it is difficult to draw definitive conclusions from the results. However, the pattern of percentage resistance varied between sites and collection periods. As processing progressed, the percentage of resistance did not consistently change but fluctuated across different stages where Campylobacter spp. were isolated. Additionally, isolates from post-intervention stages did not consistently demonstrate any clear change in resistance. Though it should be noted that fewer Campylobacter spp. were isolated from later processing stages than processing stages earlier in the process at all sites, and no Campylobacter spp. isolates were isolated from samples taken at late stage processing stages on some visits, such as in Site A on both the June and October visits where no isolates post-neck skin cutting were detected.
Table 13), Site A, October Collection (Table 14), Site B, June Collection (Table 15), Site B, November Collection (Table 16).
Due to the lower frequency of Campylobacter spp. isolation and the lack of representative isolates for some processing stages, it is difficult to draw definitive conclusions from the results. However, the pattern of percentage resistance varied between sites and collection periods. As processing progressed, the percentage of resistance did not consistently change but fluctuated across different stages where Campylobacter spp. were isolated. Additionally, isolates from post-intervention stages did not consistently demonstrate any clear change in resistance. Though it should be noted that fewer Campylobacter spp. were isolated from later processing stages than processing stages earlier in the process at all sites, and no Campylobacter spp. isolates were isolated from samples taken at late stage processing stages on some visits, such as in Site A on both the June and October visits where no isolates post-neck skin cutting were detected.
Table 13.Proportion of resistant Campylobacter spp. isolates isolated from samples collected at different processing stages at Site A on June visit (highlighted cells show where at least one isolate was resistant to a specific antimicrobial agent).
| Processing stage (type of sample) |
Cip |
E |
NA |
S |
TE |
MDR |
| Crate (litter) |
6/6 (100%) |
0/6 (0%) |
0/6 (0%) |
1/6 (17%) |
3/6 (50%) |
0/6 (0%) |
| Crate (dirty) |
0/5 (0%) |
0/5 (0%) |
0/5 (0%) |
1/5 (20%) |
4/5 (80%) |
0/5 (0%) |
| Crate (clean) |
0/1 (0%) |
0/1 (0%) |
1/1 (100%) |
0/1 (0%) |
1/1 (100%) |
0/1 (0%) |
| Post-stun (feathers) |
0/3 (0%) |
0/3 (0%) |
0/3 (0%) |
0/3 (0%) |
2/3 (67%) |
0/3 (0%) |
| Post-stun (feet) |
0/4 (0%) |
0/4 (0%) |
0/4 (0%) |
1/4 (25%) |
2/4 (50%) |
0/4 (0%) |
| Post-defeathering (feathers) |
1/2 (50%) |
1/2 (50%) |
0/2 (0%) |
1/2 (50%) |
0/2 (0%) |
1/2 (50%) |
| Feet removal (feet) |
0/1 (0%) |
0/1 (0%) |
0/1 (0%) |
0/1 (0%) |
1/1 (100%) |
0/1 (0%) |
| Post-evisceration (viscera) |
0/3 (0%) |
0/3 (0%) |
2/3 (67%) |
1/3 (33%) |
2/3 (67%) |
1/3 (33%) |
| Post-mortem inspection (carcass) |
2/3 (67%) |
0/3 (0%) |
0/3 (0%) |
0/3 (0%) |
0/3 (0%) |
0/3 (0%) |
| Neck skin trim (neck skin) |
0/1 (0%) |
0/1 (0%) |
1/1 (100%) |
0/1 (0%) |
0/1 (0%) |
0/1 (0%) |
| All stages |
9/29 (31%) |
1/29 (3%) |
4/29 (14%) |
5/29 (17%) |
15/29 (52%) |
2/29 (7%) |
Table 14.Proportion of resistant Campylobacter spp. isolates isolated from samples collected at different processing stages at Site B on June visit (highlighted cells show where at least one isolate was resistant to a specific antimicrobial agent).
| Processing stage (type of sample) |
Cip |
E |
NA |
S |
TE |
MDR |
| Crate (litter) |
2/2 (100%) |
0/2 (0%) |
0/2 (0%) |
0/2 (0%) |
0/2 (0%) |
0/2 (0%) |
| Crate (dirty) |
0/2 (0%) |
1/2 (50%) |
1/2 (50%) |
1/2 (50%) |
1/2 (50%) |
1/2 (50%) |
| Crate (clean) |
2/2 (100%) |
0/2 (0%) |
0/2 (0%) |
0/2 (0%) |
2/2 (100%) |
0/2 (0%) |
| Post-stun (feathers/feet) |
0/2 (0%) |
0/2 (0%) |
0/2 (0%) |
1/2 (50%) |
0/2 (0%) |
0/2 (0%) |
| Post-defeathering (feathers) |
2/2 (100%) |
1/2 (50%) |
0/2 (0%) |
0/2 (0%) |
1/2 (50%) |
1/2 (50%) |
| Pre-evisceration rehang (carcass) |
0/1 (0%) |
0/1 (0%) |
0/1 (0%) |
0/1 (0%) |
0/1 (0%) |
0/2 (0%) |
| Post-evisceration (viscera) |
2/2 (100%) |
0/2 (0%) |
0/2 (0%) |
1/2 (50%) |
0/2 (0%) |
0/2 (0%) |
| Post-inside-outside wash (carcass) |
1/1 (100%) |
0/1 (0%) |
0/1 (0%) |
0/1 (0%) |
0/1 (0%) |
0/2 (0%) |
| Post-chill (carcass) |
1/2 (50%) |
0/2 (0%) |
0/2 (0%) |
0/2 (0%) |
1/2 (50%) |
0/2 (0%) |
| At temperature check (carcass) |
1/2 (50%) |
1/2 (50%) |
1/2 (50%) |
0/2 (0%) |
1/2 (50%) |
1/2 (50%) |
| At dispatch (carcass) |
1/2 (50%) |
2/2 (100%) |
0/2 (0%) |
1/2 (50%) |
1/2 (50%) |
1/2 (50%) |
| All stages |
12/20 (60%) |
5/20 (25%) |
2/20 (10%) |
4/20 (20%) |
7/20 (35%) |
4/20 (20%) |
Table 15.Proportion of resistant Campylobacter spp. isolates isolated from samples collected at different processing stages at Site A on October visit (highlighted cells show where at least one isolate was resistant to a specific antimicrobial agent).
| Processing stage (type of sample) |
Cip |
E |
NA |
S |
TE |
MDR |
| Crate (litter) |
0/12 (0%) |
0/12 (0%) |
0/12 (0%) |
0/12 (0%) |
0/12 (0%) |
0/12 (0%) |
| Crate (dirty) |
0/3 (0%) |
0/3 (0%) |
0/3 (0%) |
0/3 (0%) |
2/3 (67%) |
0/3 (0%) |
| Post-defeathering (feathers) |
0/3 (0%) |
0/3 (0%) |
0/3 (0%) |
0/3 (0%) |
3/3 (100%) |
0/3 (0%) |
| Feet removal (feet) |
2/7 (29%) |
0/7 (0%) |
0/7 (0%) |
0/7 (0%) |
2/7 (29%) |
0/7 (0%) |
| Post-evisceration (viscera) |
0/2 (0%) |
0/2 (0%) |
0/2 (0%) |
0/2 (0%) |
0/2 (0%) |
0/2 (0%) |
| Neck skin trim (neck skin) |
1/7 (14%) |
0/7 (0%) |
0/7 (0%) |
3/7 (43%) |
4/7 (57%) |
0/7 (0%) |
| All stages |
3/34 (9%) |
0/34 (0%) |
0/34 (0%) |
3/34 (9%) |
11/34 (32%) |
0/34 (0%) |
Table 16.Proportion of resistant Campylobacter spp. isolates isolated from samples collected at different processing stages at Site B on November visit (highlighted cells show where at least one isolate was resistant to a specific antimicrobial agent).
| Processing stage (type of sample) |
Cip |
E |
NA |
S |
TE |
MDR |
| Crate (dirty) |
0/2 (0%) |
0/2 (0%) |
0/2 (0%) |
0/2 (0%) |
2/2 (100%) |
0/2 (0%) |
| Post-stun (feathers) |
0/6 (0%) |
2/6 (33%) |
0/6 (0%) |
5/6 (83%) |
6/6 (100%) |
2/6 (33%) |
| Post-stun (feet) |
5/8 (63%) |
0/8 (0%) |
3/8 (38%) |
0/8 (0%) |
4/8 (50%) |
0/8 (0%) |
| Post-defeathering (feathers) |
3/8 (38%) |
0/8 (0%) |
3/8 (38%) |
1/8 (13%) |
8/8 (100%) |
0/8 (0%) |
| Pre-evisceration rehang (carcass) |
1/6 (17%) |
0/6 (0%) |
1/6 (17%) |
0/6 (0%) |
6/6 (100%) |
0/6 (0%) |
| Post-evisceration (viscera) |
0/4 (0%) |
0/4 (0%) |
0/4 (0%) |
0/4 (0%) |
4/4 (100%) |
0/4 (0%) |
| Post-mortem inspection (carcass) |
1/2 (50%) |
0/2 (0%) |
1/2 (50%) |
0/2 (0%) |
2/2 (100%) |
0/2 (0%) |
| Post-mortem inspection (viscera) |
0/1 (0%) |
0/1 (0%) |
0/1 (0%) |
0/1 (0%) |
1/1 (100%) |
0/1 (0%) |
| Neck skin trim (neck skin) |
1/3 (33%) |
0/3 (0%) |
0/3 (0%) |
0/3 (0%) |
0/3 (0%) |
0/3 (0%) |
| Post-inside-outside wash (carcass) |
0/5 (0%) |
0/5 (0%) |
1/5 (20%) |
2/5 (40%) |
2/5 (40%) |
0/5 (0%) |
| Intervention (equipment surface) |
0/1 (0%) |
0/1 (0%) |
0/1 (0%) |
0/1 (0%) |
1/1 (100%) |
0/1 (0%) |
| Post-chill (carcass) |
0/4 (0%) |
1/4 (25%) |
0/4 (0%) |
1/4 (25%) |
1/4 (25%) |
1/4 (25%) |
| At temperature check (carcass) |
0/4 (0%) |
0/4 (0%) |
2/4 (50%) |
0/4 (0%) |
2/4 (50%) |
0/4 (0%) |
| All stages |
11/54 (20%) |
3/54 (6%) |
11/54 (20%) |
9/54 (17%) |
39/54 (72%) |
3/54 (6%) |
3.1.6. Escherichia coli
E. coli isolates were tested against 11 antimicrobial agents from 8 classes. These were: amoxicillin + clavulanic acid (a beta-lactam), ampicillin (a penicillin), azithromycin (a macrolide), cefotaxime (a cephalosporin), cefoxitin (a cephalosporin), ceftazidime (a cephalosporin), ceftriaxone (a cephalosporin), chloramphenicol (a phenicol), ciprofloxacin (a quinolone), trimethoprim/sulfamethoxazole (a cotrimoxazole), and tetracycline (a tetracycline).
A total of 469 E. coli isolates selected from the two sites and from different processing stages were tested for antimicrobial resistance. The antimicrobial susceptibility profile for E. coli isolates collected from individual sites and collection period are presented in Figure 10 and Figure 11. Also, overall antimicrobial susceptibility profiles for the 469 E. coli isolates are presented in Table 17: Overall resistant and susceptible E. coli isolates.
The proportion of resistance to the 11 antimicrobial agents in E. coli isolates showed varied between sites and between collection period (Figure 10 and Figure 11). The highest level of occurrence of resistance was shown to ampicillin in E. coli isolates from Site A in June (95% resistant) and from Site B in November (86% resistant) (Figure 10). The lowest occurrence of resistance in isolates were to chloramphenicol, ciprofloxacin, and ceftriaxone. The lowest occurrence of resistance was recorded to chloramphenicol in isolates from both sites and all collection periods, except in isolates from Site B in June where the lowest occurrence of resistance found was to azithromycin (2%) and chloramphenicol (10%).
For other antimicrobial drugs and comparing the 2 sites and collection periods (Figure 10 and Figure 11), percentage occurrence of resistance to amoxicillin/clavulanic acid in E. coli isolates at Site B decreased from March (33%) to June (25%), then dropped further in November (5%). Site A showed a different pattern with a higher percentage occurrence of resistance to amoxicillin/clavulanic acid isolates in June and October (both 49%), but lower occurrence of resistance in isolates in March (18%).
The pattern of resistance to azithromycin in E. coli isolates differed between sites. Isolates from Site B showed a lower percentage occurrence of resistance in June (2%) but a higher percentage occurrence of resistance in March (53%). While isolates from Site A showed a consistently higher occurrence of resistance, with a peak in June (45%) and a lower occurrence of resistance in March (37%) and October (21%).
Resistance to ceftazidime in isolates from Site A and Site B were similar for the 3 collection periods. The highest percentage occurrence of resistance was recorded in isolates collected in June at both Site A (55%) and Site B (60%), with lower occurrence in March (24% and 28%) and November (18% and 15%) in isolates from Sites A and B, respectively.
Percentage resistance to ceftriaxone in isolates from Site A ranged between 25% and 71%, with the lowest percentage of resistance in isolates collected in November and the highest in isolates collected in June. Site B showed a different pattern with no isolates collected in November being resistant to ceftriaxone, while 34% and 46% of isolates collected in March and June, respectively, were resistant.
Cefotaxime resistance patterns differed between sites. Isolates from Site B showed the higher percentage resistance in June (50%) with lower percentage resistance in March (36%) and November (1%). The highest percentage resistance (62%) was found in isolates collected from Site A in June. Compared to Site B, Site A still showed a higher resistance in isolates collected in October (26%) compared to that in isolates from Site B collected in November (1%).
More isolates collected from Site A were resistant to cefoxitin compared to isolates from Site B across all time periods. At Site A, resistance peaked in isolates collected in June (55%) and was lowest in isolates from March (12%). Isolates from Site B showed a gradual increase in resistance from March (25%) to June (21%), then a sharp decline in November (1%).
Tetracycline resistance showed a decreasing trend in isolates from Site B from March (64%) to November (39%). In contrast, Site A exhibited fluctuations, with the highest resistance in isolates collected in June (68%) and the lowest in March (50%). Overall, isolates from Site A tended to be more resistant than isolates from Site B, particularly in June and October or November.
The percentage of isolates that were resistant to trimethoprim/sulfamethoxazole collected at Site B decreased from March (72%) to November (25%). Isolates from Site A showed more extreme fluctuations, with a high percentage of resistant isolated collected in June (82%) but lower percentages of resistant isolates in March (46%) and October (42%). The June period stands out with high resistance in isolates collected at both sites.
Overall, antimicrobial susceptibility testing identified that 80% (376/469) and 55% (256/469) of E. coli isolates examined were resistant to ampicillin and tetracycline, respectively. The highest overall resistance recorded in this study (Table 17). Lowest resistance was recorded for chloramphenicol, 13% (62/469) (Table 17).

Figure 10.Antimicrobial susceptibility profile of E. coli isolated from Sites A and B in March, June, and October or November 2023 (where AMC = Amoxicillin + clavulanic acid; AMP = Ampicillin; AZM = Azithromycin; C = Chloramphenicol; CAZ = Ceftazidime; CIP = Ciprofloxacin)
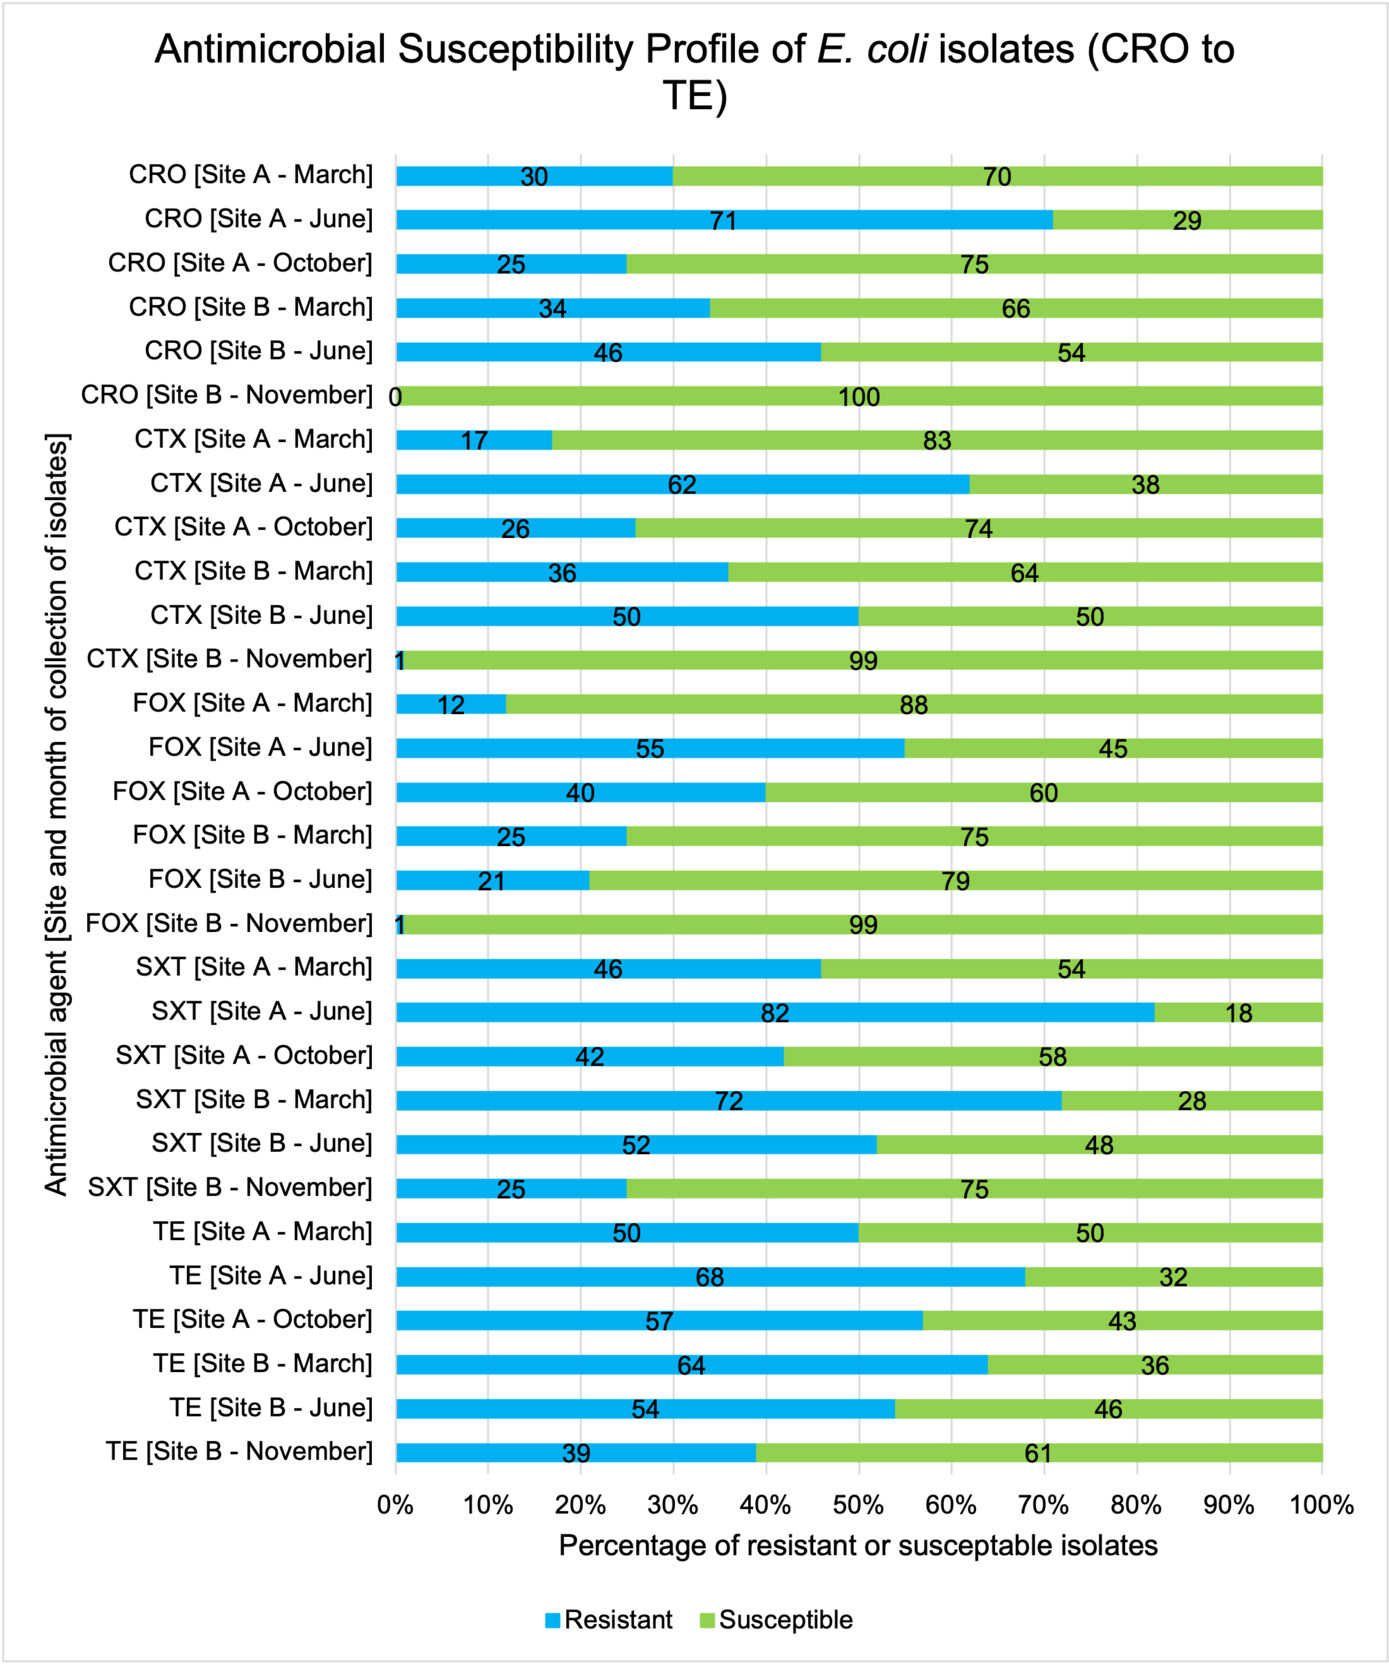
Figure 11.Antimicrobial susceptibility profile of E. coli isolated from Sites A and B in March, June, and October or November 2023 (where CRO = Ceftriaxone; CTX = Cefotaxime; FOX = Cefoxitin; SXT = Trimethoprim/sulfamethoxazole; TE = Tetracycline)
Table 17.Overall resistant and susceptible E. coli isolates.
| Antimicrobial agent |
Overall Resistant
(%) |
Overall Susceptible
(%) |
| Amoxicillin + clavulanic acid - AMC |
134/469
(29%) |
335/469
(71%) |
| Ampicillin - AMP |
376/469
(80%) |
93/469
(20%) |
| Azithromycin - AZM |
134/469
(29%) |
335/469
(71%) |
| Cefotaxime - CTX |
136/469
(33%) |
333/469
(67%) |
| Cefoxitin – FOX |
115/469
(25%) |
354/469
(75%) |
| Ceftazidime – CAZ |
145/469
(31%) |
324/469
(69%) |
| Ceftriaxone - CRO |
153/469
(33%) |
316/469
(67%) |
| Chloramphenicol - C |
62/469
(13%) |
407/469
(87%) |
| Ciprofloxacin - CIP |
152/469
(32%) |
317/469
(68%) |
| Trimethoprim/sulfamethoxazole - SXT |
242/469
(52%) |
227/469
(48%) |
| Tetracycline - TE |
256/469
(55%) |
213/469
(45%) |
MDR (defined as reduced susceptibility to at least three antimicrobial classes) was found in 60% of E. coli isolates examined (Table 18), 3% (14/469) of the isolates were resistant to all 11 agents and a total of 25/469 (5%) were fully sensitive to all antimicrobials tested.
Table 18.Antimicrobial agent resistance profile of E. coli isolates (tested against 11 antimicrobial agents).
| Susceptibility |
Site A March (%) |
Site B March (%) |
Site A June (%) |
Site B June (%) |
Site A
Oct (%) |
Site B Nov (%) |
Total (%) |
| MDR, resistant to 3 or more classes of antimicrobial agent |
65/118 (55%) |
47/64 (73%) |
68/78 (87%) |
32/48 (67%) |
50/77 (65%) |
21/84 (25%) |
224/469 (60%) |
| Susceptible to all 11 antimicrobial agents |
6/25 (24%) |
2/25 (8%) |
2/25 (8%) |
2/25 (8%) |
5/25 (20%) |
8/25 (32%) |
25/469 (5%) |
| Reduced susceptibility to 1 antimicrobial agent |
15/66 (23%) |
6/66 (9%) |
2/66 (3%) |
3/66 (5%) |
8/66 (12%) |
32/66 (48%) |
66/469 (14%) |
| Reduced susceptibility to 2 antimicrobial agents |
26/83 (31%) |
9/83 (11%) |
4/83 (5%) |
8/83 (10%) |
13/83 (16%) |
23/83 (28%) |
83/469 (18%) |
| Reduced susceptibility to 3 antimicrobial agents |
20/73 (27%) |
9/73 (12%) |
8/73 (11%) |
10/73 (14%) |
11/73 (15%) |
15/73 (21%) |
73/469 (16%) |
| Reduced susceptibility to 4 antimicrobial agents |
15/46 (33%) |
13/46 (28%) |
1/46 (2%) |
3/46 (7%) |
10/46 (22%) |
4/46 (9%) |
46/469 (10%) |
| Reduced susceptibility to 5 antimicrobial agents |
11/46 (24%) |
4/46 (9%) |
10/46 (22%) |
7/46 (15%) |
12/46 (26%) |
2/46 (4%) |
46/469 (10%) |
| Reduced susceptibility to 6 antimicrobial agents |
13/33 (39%) |
5/33 (15%) |
6/33 (18%) |
3/33 (9%) |
6/33 (18%) |
0/33 (0%) |
33/469 (7%) |
| Reduced susceptibility to 7 antimicrobial agents |
8/26 (31%) |
2/26 (8%) |
8/26 (31%) |
4/26 (15%) |
4/26 (15%) |
0/26 (0%) |
26/469 (6%) |
| Reduced susceptibility to 8 antimicrobial agents |
1/25 (4%) |
2/25 (8%) |
12/25 (48%) |
6/25 (24%) |
4/25 (16%) |
0/25 (0%) |
25/469 (5%) |
| Reduced susceptibility to 9 antimicrobial agents |
2/14 (14%) |
1/14 (7%) |
7/14 (50%) |
1/14 (7%) |
3/14 (21%) |
0/14 (0%) |
14/469 (3%) |
| Reduced susceptibility to 10 antimicrobial agents |
1/18 (6%) |
6/18 (33%) |
10/18 (56%) |
0/18 (0%) |
1/18 (6%) |
0/18 (0%) |
18/469 (4%) |
| Reduced susceptibility to 11 antimicrobial agents |
0/14 (0%) |
5/14 (36%) |
8/14 (57%) |
1/14 (7%) |
0/14 (0%) |
0/14 (0%) |
14/469 (3%) |
The following set of back-to-back histograms (Figure 12-Figure 22) show the percentage of resistant and susceptible E. coli isolates collected from Site A and Site B in March, June, and October or November 2023. These isolates were tested against 11 different antibiotics: amoxicillin + clavulanic acid (Figure 12), ampicillin (Figure 13), azithromycin (Figure 14), cefotaxime (Figure 15), cefoxitin (Figure 16), ceftazidime (Figure 17), ceftriaxone (Figure 18), chloramphenicol (Figure 19), ciprofloxacin (Figure 20), tetracycline (Figure 21), and trimethoprim/sulfamethoxazole (Figure 22). Each histogram pair represents the percentage resistant and susceptible E. coli isolates at various stages of the poultry processing chain, from crate litter to dispatch.
Overall, the pattern resistance in isolates varied between sites and collection periods. Isolates from different sites showed reduced resistance to specific antimicrobial agents, including cefotaxime (Figure 15), cefoxitin (Figure 16), ceftriaxone (Figure 18), chloramphenicol (Figure 19) and ciprofloxacin (Figure 20), particularly in isolates collected in November at Site B and in June at Site A for ceftazidime (Figure 17). As processing progressed, the percentage of resistant isolates fluctuated across different stages, independent of the processing sequence. Additionally, post-intervention stages did not consistently demonstrate any change in the percentage of resistant isolates.

Figure 12.Antimicrobial susceptibility profile of E. coli isolated from Site A and Site B: Processing stage comparison for amoxicillin + clavulanic acid.

Figure 13.Antimicrobial susceptibility profile of E. coli isolated from Site A and Site B: Processing stage comparison for ampicillin.
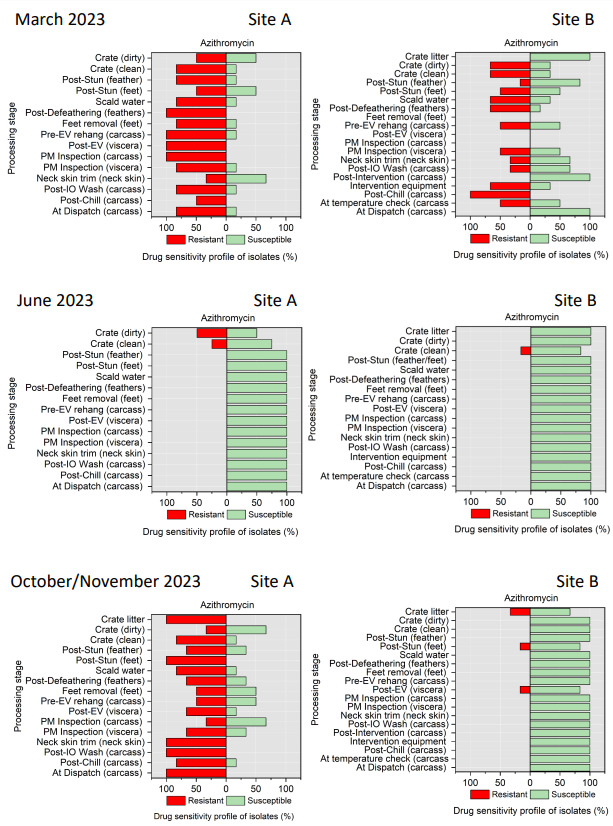
Figure 14.Antimicrobial susceptibility profile of E. coli isolated from Site A and Site B: Processing stage comparison for azithromycin.
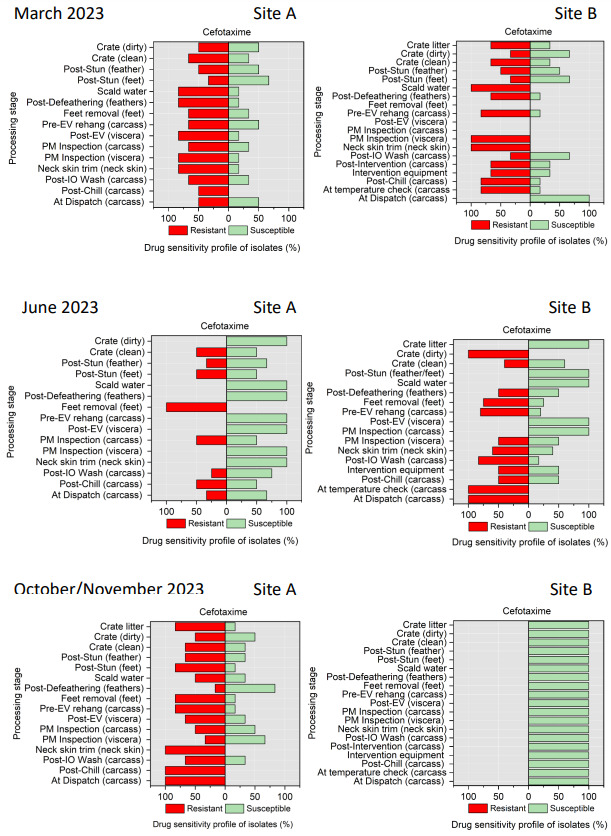
Figure 15.Antimicrobial susceptibility profile of E. coli isolated from Site A and Site B: Processing stage comparison for cefotaxime.

Figure 16.Antimicrobial susceptibility profile of E. coli isolated from Site A and Site B: Processing stage comparison for cefoxitin.

Figure 17.Antimicrobial susceptibility profile of E. coli isolated from Site A and Site B: Processing stage comparison for ceftazidime.

Figure 18.Antimicrobial susceptibility profile of E. coli isolated from Site A and Site B: Processing stage comparison for ceftriaxone.

Figure 19.Antimicrobial susceptibility profile of E. coli isolated from Site A and Site B: Processing stage comparison for chloramphenicol.

Figure 20.Antimicrobial susceptibility profile of E. coli isolated from Site A and Site B: Processing stage comparison for ciprofloxacin.

Figure 21.Antimicrobial susceptibility profile of E. coli isolated from Site A and Site B: Processing stage comparison for tetracycline.
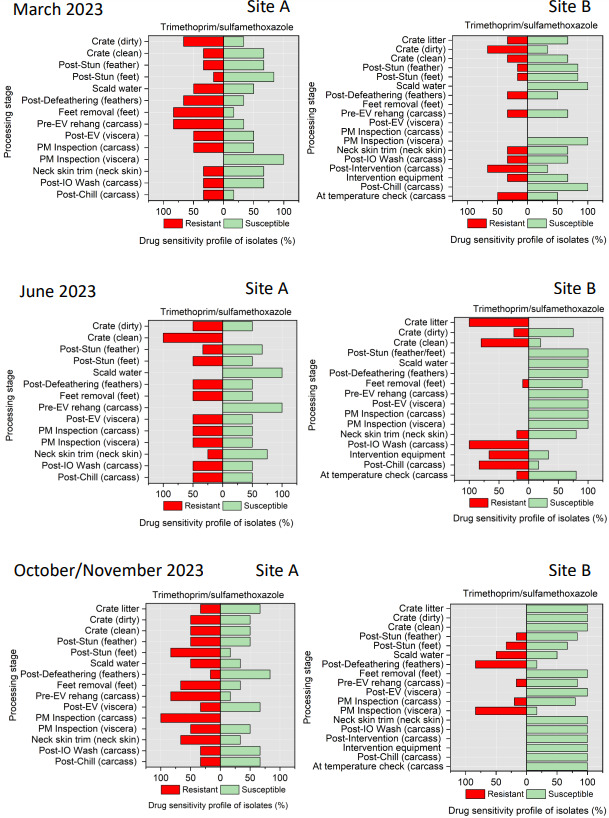
Figure 22.Antimicrobial susceptibility profile of E. coli isolated from Site A and Site B: Processing stage comparison for trimethoprim/sulfamethoxazole.
3.1.7. Whole Genome Sequencing (WGS) of Campylobacter and E. coli isolates
To predict genetic determinants of AMR, WGS was conducted on 107 isolates, 38 Campylobacter spp. isolates and 69 E. coli isolates. The isolates represented those that showed resistance to the highest number of antimicrobial agents using AST at different sampling points across the processing chain. The quality of the assembled bacterial genomes was verified using software called QUAST. The genome length of the Campylobacter spp. isolates ranged from 1.7 to 1.8 million base pairs with 28 to 70 contigs, while the E. coli isolates ranged from 4.6 to 5.7 million base pairs with 6 to 847 contigs. The identity of the isolates was confirmed using the MASH algorithm, with average nucleotide identity of our genomes to reference strains ranging from 97% to 99.1%, identifying them as C. jejuni and E. coli.
Overall, there was greater variability in sequence type (ST) in E. coli isolates characterized from each sampling point at both sites and throughout the sampling period compared to C. jejuni isolates. A total of five and 40 different C. jejuni and E. coli STs were identified with 3 and 36 assigned to recognised STs, respectively. The ST profiles of one C. jejuni strain and three E. coli strains were unclassified at the time of drafting this report. However, these sequences will be submitted to PubMLST (for C. jejuni) and Enterobase (for E. coli) for sequence type allocation. Additionally, the sequencing output for one E. coli isolate was insufficient for ST or resistance genotyping.
The phenotypic susceptibility profiles, AMR-related genes, plasmids, point mutations detected and ST outputs for all sequenced C. jejuni isolates are presented in Table 19 to Table 22.
A total of four distinct C. jejuni STs were identified in both sample sites throughout the sampling period. These STs include ST 21, ST 262, ST 5136, and ST 6175. However, ST 6175 was the most prevalent being detected at various sampling points in both sample sites regardless of the sampling period. Each of the sequence types exhibited at least one of the following: the blaOXA-61 gene (associated with ampicillin resistance) or the tetracycline resistance determinants tet(O) or tet(O/32/O). In addition, the ResFinder algorithm predicted that all the STs had the point mutation ACA -> ATA (T -> I) on the house keeping gene gyrA (T86I). A mutation predicted to confer resistance to ciprofloxacin and nalidixic acid.
Overall, the genotypic resistance determinant predicted by the ResFinder algorithm for ciprofloxacin, nalidixic acid and tetracycline matched the observed phenotypes. However, reduced susceptibility to erythromycin and streptomycin was observed in several isolates subject to AST but no corresponding resistance determinant gene was predicted for this observation.
The phenotypic susceptibility profiles, AMR-related genes, plasmids, point mutations detected and MLST outputs for all sequenced E. coli isolates are presented in Table 23 to Table 28.
Across all samples obtained from both sites at all timepoints, the following E. coli STs were observed: 10, 48, 57, 68, 69, 93, 101, 111, 117, 155, 162, 215, 224, 517, 522, 641, 770, 877, 1011, 1049, 1084, 1140, 1196, 1201, 1485, 1564, 1611, 1665, 1721, 1841, 2491, 3249, 6422, 6448, 9120, and 12034.
Four E. coli STs: ST 10, ST 155, ST 641, and ST 1611 were characterised from Site A in March. These STs were associated with 20 resistance-related genes, with blaTEM-1C being the most prevalent. Additionally, 12 plasmids were detected, with Col156 being the dominant type (as shown in Table 23).
In June, seven STs were detected at Site A: ST 10, ST 68, ST 69, ST 117, ST 224, ST 1084 and ST 6448. These STs carried 30 resistance-related genes, with blaTEM-1B as the prevailing gene. Also,17 plasmids were identified, with Inc1-l(Alpha) being the most common (as shown in Table 25).
In October there were nine STs at Site A (ST 10, ST 48, ST 101, ST 155, ST 1196, ST 1201, ST 1841, ST 2491, ST 6448) with 22 resistance-related genes, where tet(A) was the most prevalent and 9 plasmids, with P0111 being the most prevalent were found (Table 27).
In Site B, during March sampling period, 12 E. coli STs (ST 69, ST 155, ST 215, ST 517, ST 1140, ST 1485, ST 1564, ST 1665, ST 1721, ST 6422, and ST 12034) were detected, along with 17 resistance-related genes, with blaTEM-1B being the most prevalent, and 16 plasmids, with IncFIB being the most prevalent (Table 24).
In June eight STs were identified at Site B: ST 10, ST 57, ST 93, ST 522, ST 1011, ST 1049, ST 1140, and an ST 17270. These STs carried 23 resistance-related genes, with sul(2) being the most abundant. Seventeen plasmids were observed, with P0111 as the prevailing type (as shown in Table 26).
In November 11 STs (ST 10, ST 69, ST 111, ST 162, ST 877, ST 1841, ST 3249, ST 6422, ST 6448, ST 9120 and an unidentified sequence type) were found at Site B, along with 22 resistance-related genes, with tet(A) being the most prevalent, and 9 plasmids, with P0111 being the most prevalent (Table 28).
In general, the genotype predictions for resistance to beta-lactams, cotrimoxazole, quinolones, and tetracyclines were consistent with the phenotypic profile, however, there were some inconsistencies with other drug classes. Specifically, the ResFinder tool failed to detect resistance genes in isolates that displayed phenotypic resistance to cephalosporins. A similar pattern was observed for macrolides in the majority of the sequence types. Conversely, resistance genes were detected in several isolates that were not phenotypically resistant.
Table 19.Antimicrobial determinant genes, antimicrobial resistance phenotypes, and plasmids detected in C. jejuni isolated from samples taken from Site A in June 2023.
| Processing stage (type of sample) (isolate code) |
Sequence Type |
Genotype |
Predicted Phenotype |
Plasmids |
| Crate (litter) (04c) |
ST 6175 |
blaOXA-61, gyrA (T86I), tet(O) |
ampicillin, ciprofloxacin, nalidixic acid, tetracycline |
None detected |
| Crate (litter) (26c) |
ST 21 |
blaOXA-61 |
ampicillin |
None detected |
| Crate (litter) (29c) |
ST 6175 |
blaOXA-61, gyrA (T86I), tet(O) |
ampicillin, ciprofloxacin, nalidixic acid, tetracycline |
None detected |
| Crate (litter) (8c) |
ST 6175 |
blaOXA-61, gyrA (T86I), tet(O) |
ampicillin, ciprofloxacin, nalidixic acid, tetracycline |
None detected |
| Crate (dirty) (01c) |
ST 21 |
blaOXA-61 |
ampicillin |
None detected |
| Crate (dirty) (22c) |
ST 6175 |
blaOXA-61, gyrA (T86I), tet(O) |
ampicillin, ciprofloxacin, nalidixic acid, tetracycline |
None detected |
| Crate (dirty) (53c) |
ST 21 |
blaOXA-61 |
ampicillin |
None detected |
| Post-stun (feathers) (9c) |
ST 21 |
blaOXA-61 |
ampicillin |
None detected |
| Post-stun (feet) (42c) |
ST 6175 |
blaOXA-61, gyrA (T86I), tet(O) |
ampicillin, ciprofloxacin, nalidixic acid, tetracycline |
None detected |
| Post-defeathering (feathers) (10c) |
ST 5136 |
blaOXA-61, gyrA (T86I), tet(O/32/O) |
ampicillin, ciprofloxacin, nalidixic acid, tetracycline |
None detected |
Table 20.Antimicrobial determinant genes, antimicrobial resistance phenotypes, and plasmids detected in C. jejuni isolated from samples taken from Site B in June 2023.
| Processing stage (type of sample) (isolate code) |
Sequence Type |
Genotype |
Predicted Phenotype |
Plasmid |
| Crate (clean) (17c) |
ST 21 |
blaOXA-61 |
ampicillin |
None detected |
| Post-stun (feathers) (15c) |
ST 6175 |
blaOXA-61, gyrA (T86I), tet(O) |
ampicillin, ciprofloxacin, nalidixic acid, tetracycline |
None detected |
| Post-defeathering (feathers) (37c) |
ST 5136 |
blaOXA-61, gyrA (T86I), tet(O/32/O) |
ampicillin, ciprofloxacin, nalidixic acid, tetracycline |
None detected |
| Post-evisceration (viscera) (27c) |
ST 5136 |
blaOXA-61, gyrA (T86I), tet(O/32/O) |
ampicillin, ciprofloxacin, nalidixic acid, tetracycline |
None detected |
| Neck skin trim (neck skin) (14c) |
ST 5136 |
blaOXA-61, gyrA (T86I), tet(O/32/O) |
ampicillin, ciprofloxacin, nalidixic acid, tetracycline |
None detected |
| Post-inside-outside wash (Carcass) (13c) |
ST 5136 |
blaOXA-61, gyrA (T86I), tet(O/32/O) |
ampicillin, ciprofloxacin, nalidixic acid, tetracycline |
None detected |
| Post-inside-outside wash (carcass) (39c) |
ST 6175 |
blaOXA-61, gyrA (T86I), tet(O) |
ampicillin, ciprofloxacin, nalidixic acid, tetracycline |
None detected |
| Post-chill (carcass) (30c) |
ST 6175 |
blaOXA-61, gyrA (T86I), tet(O) |
ampicillin, ciprofloxacin, nalidixic acid, tetracycline |
None detected |
| 16.Post-chill (carcass) (32c) |
ST 6175 |
blaOXA-61, gyrA (T86I), tet(O) |
ampicillin, ciprofloxacin, nalidixic acid, tetracycline |
None detected |
Table 21.Antimicrobial determinant genes, antimicrobial resistance phenotypes, and plasmids detected in C. jejuni isolated from samples taken from Site A in October 2023.
| Processing stage (type of sample) (isolate code) |
Sequence Type |
Genotype |
Predicted Phenotype |
Plasmid |
| Crate (litter) (23c) |
ST 6175 |
blaOXA-61, gyrA (T86I), tet(O) |
ampicillin, ciprofloxacin, nalidixic acid, tetracycline |
None detected |
| Crate (litter) (24c) |
ST 6175 |
blaOXA-61, gyrA (T86I), tet(O) |
ampicillin, ciprofloxacin, nalidixic acid, tetracycline |
None detected |
| Crate (litter) (25c) |
ST 6175 |
blaOXA-61, gyrA (T86I), tet(O) |
ampicillin, ciprofloxacin, nalidixic acid, tetracycline |
None detected |
| Crate (litter) (6c) |
ST 6175 |
blaOXA-193, tet(O) |
ampicillin, tetracycline |
None detected |
| Crate (dirty) (5c) |
ST 6175 |
blaOXA-61, gyrA (T86I), tet(O) |
ampicillin, ciprofloxacin, nalidixic acid, tetracycline |
None detected |
| Crate (dirty) (16c) |
ST 6175 |
blaOXA-61, gyrA (T86I), tet(O) |
ampicillin, ciprofloxacin, nalidixic acid, tetracycline |
None detected |
| Crate (dirty) (20c) |
ST 6175 |
blaOXA-61, gyrA (T86I), tet(O) |
ampicillin, ciprofloxacin, nalidixic acid, tetracycline |
None detected |
| Post-defeathering (feathers) (19c) |
ST 5136 |
blaOXA-61, gyrA (T86I), tet(O/32/O) |
ampicillin, ciprofloxacin, nalidixic acid, tetracycline |
None detected |
| Post-defeathering (feathers) (40c) |
ST 5136 |
blaOXA-61, gyrA (T86I), tet(O/32/O) |
ampicillin, ciprofloxacin, nalidixic acid, tetracycline |
None detected |
| Post-defeathering (feathers) (7c) |
ST 5136 |
blaOXA-61, gyrA (T86I), tet(O/32/O) |
ampicillin, ciprofloxacin, nalidixic acid, tetracycline |
None detected |
| Post-evisceration (viscera) (41c) |
ST 6175 |
blaOXA-61, gyrA (T86I), tet(O) |
ampicillin, ciprofloxacin, nalidixic acid, tetracycline |
None detected |
| Neck skin trim (neck skin) (31c) |
ST 6175 |
blaOXA-61, gyrA (T86I), tet(O) |
ampicillin, ciprofloxacin, nalidixic acid, tetracycline |
None detected |
| Neck skin trim (neck skin) (6c) |
ST 6175 |
blaOXA-61, gyrA (T86I), tet(O) |
ampicillin, ciprofloxacin, nalidixic acid, tetracycline |
None detected |
Table 22.Antimicrobial determinant genes, antimicrobial resistance phenotypes, and plasmids detected in C. jejuni isolated from samples taken from Site B in November 2023.
| Processing stage (type of sample) (isolate code) |
Sequence Type |
Genotype |
Predicted Phenotype |
Plasmid |
| Crate litter (18c) |
ST 6175 |
blaOXA-61, gyrA (T86I), tet(O) |
ampicillin, ciprofloxacin, nalidixic acid, tetracycline |
None detected |
| Post-stun (feet) (3c) |
ST 21 |
blaOXA-61 |
ampicillin |
None detected |
| Post-defeathering (feathers) |
ST 6175 |
blaOXA-61, tet(O) |
ampicillin, tetracycline |
None detected |
| Post-defeathering (feathers) (16c) |
ST 6175 |
tet(O) |
tetracycline |
None detected |
| Post-defeathering (feathers) (1c) |
ST 262 |
blaOXA-61 |
ampicillin |
None detected |
| Post-defeathering (feathers) (8c) |
ST 5136 |
blaOXA-61, tet(O/32/O) |
ampicillin, tetracycline |
None detected |
Table 23.Antimicrobial determinant genes, antimicrobial resistance phenotypes, and plasmids detected in E. coli isolated from samples taken from Site A in March 2023.
| Processing stage (type of sample) |
Sequence Type |
Genotype |
Predicted Phenotype |
Plasmid |
| Crate (clean) |
155 |
None |
Susceptible |
IncFIB(K), p0111 |
| Post-stun (feathers) |
641 |
aadA10, blaTEM-1B, dfrA14, gyrA (S83L), qacE, sul1 |
streptomycin, ampicillin, trimethoprim, ciprofloxacin I/R, nalidixic acid, unknown[qacE_1_X68232], sulfisoxazole |
Col156 |
| Post-defeathering (feathers) |
1611 |
None |
Susceptible |
Col156 |
| Feet removal (feet) |
- |
aadA1, aph(3'')-Ib, aph(6)-Id, blaTEM-1B, dfrA1, floR, gyrA (D87N), gyrA (S83L), parC (S80I), qacE, sitABCD, sul1, sul2, tet(A) |
streptomycin, kanamycin, ampicillin, trimethoprim, chloramphenicol, ciprofloxacin I/R, nalidixic acid, unknown[qacE_1_X68232], unknown[sitABCD_1_AY598030], sulfisoxazole, tetracycline |
Col156, ColpVC, IncFIB(AP001918), IncFIB(H89-PhagePlasmid), IncFII, IncY |
| Post-mortem inspection (viscera) |
10 |
None |
Susceptible |
ColE10, IncX1 |
Table 24.Antimicrobial determinant genes, antimicrobial resistance phenotypes, and plasmids detected in E. coli isolated from samples taken from Site B in March 2023.
| Processing stage (type of sample) (isolate code) |
Sequence Type |
Genotype |
Predicted Phenotype |
Plasmid |
| Crate (litter) |
69 |
aac(3)-VIa, ant(3'')-Ia, qacE, sul1, sul2 |
gentamicin, spectinomycin, unknown[qacE_1_X68232], sulfisoxazole |
IncFII(pEH01) |
| Crate (clean) |
12034 |
blaTEM-1B, dfrA1, sul2 |
ampicillin, trimethoprim, sulfisoxazole |
Col156, IncI1-I(Alpha) |
| Crate (clean) |
155 |
None |
Susceptible |
IncFIA(HI1), IncFIB(K), p0111 |
| Post-stun (feathers) |
- |
None |
Susceptible |
None |
| Post-stun (feathers) |
517 |
None |
Susceptible |
Col156 |
| Scalding (water) |
1721 |
qacH |
unknown[qacH_1_FJ172381] |
IncN, IncP6, IncX1, IncY |
| Post-evisceration (viscera) |
1485 |
sitABCD |
unknown[sitABCD_1_AY598030] |
Col156, IncFIA, IncFIB(AP001918) |
| Post-mortem inspection (carcass) |
215 |
aph(3'')-Ib, aph(6)-Id |
streptomycin, kanamycin |
IncN, IncY |
| Neck skin trim (neck skin) |
1564 |
aac(3)-IV, ant(3'')-Ia, aph(4)-Ia, blaTEM-1B, dfrA1, sitABCD, sul2, tet(A) |
gentamicin, tobramycin, spectinomycin, hygromycin, ampicillin, trimethoprim, unknown[sitABCD_1_AY598030], sulfisoxazole, tetracycline |
ColpVC, IncFIB(AP001918), IncI1-I(Alpha), p0111 |
| Post-inside-outside wash (carcass) |
6422 |
None |
Susceptible |
IncI2(Delta) |
| Post-intervention (carcass) |
155 |
gyrA (S83A), sitABCD, tet(A) |
ciprofloxacin I/R, nalidixic acid, unknown[sitABCD_1_AY598030], tetracycline |
IncFIB(AP001918), IncFII(pSE11), IncX4, p0111 |
| At temperature check (carcass) |
1665 |
blaTEM-1B, sitABCD |
ampicillin, unknown[sitABCD_1_AY598030] |
ColpVC, IncFIA, IncFIB(AP001918) |
| At dispatch (carcass) |
1140 |
blaTEM-220, qnrS1, tet(A) |
ampicillin, ciprofloxacin I/R, tetracycline |
IncI1-I(Alpha), IncX4 |
Table 25.Antimicrobial determinant genes, antimicrobial resistance phenotypes, and plasmids detected in E. coli isolated from samples taken from Site A in June 2023.
| Processing stage |
Sequence Type |
Genotype |
Predicted Phenotype |
Plasmid |
| Crate (litter) |
6448 |
aadA5, aph(3'')-Ib, aph(6)-Id, blaCTX-M-55, dfrA17, floR, gyrA (D87N), gyrA (S83L), parC (S80I), tet(A) |
streptomycin, kanamycin, ampicillin, ceftriaxone, trimethoprim, chloramphenicol, ciprofloxacin I/R, nalidixic acid, tetracycline |
p0111 |
| Crate (litter) |
10 |
ant(3'')-Ia, blaTEM-1B, qacE, sitABCD, sul1, tet(A) |
spectinomycin, ampicillin, unknown[qacE_1_X68232], unknown[sitABCD_1_AY598030], sulfisoxazole, tetracycline |
IncFIB(AP001918), IncFII, IncI1-I(Alpha), IncI2 |
| Crate (dirty) |
1011 |
aac(3)-IId, aac(3)-VIa, ant(3'')-Ia, aph(3'')-Ib, aph(6)-Id, blaTEM-1B, dfrA1, parC (S80I), qacE, sitABCD, sul1, sul2, tet(A) |
gentamicin, spectinomycin, streptomycin, kanamycin, ampicillin, trimethoprim, ciprofloxacin I/R, nalidixic acid, unknown[qacE_1_X68232], unknown[sitABCD_1_AY598030], sulfisoxazole, tetracycline |
IncFIB(AP001918), IncI1-I(Alpha), IncI2, IncQ1 |
| Crate (clean) |
68 |
blaTEM-1B, sul2 |
ampicillin, sulfisoxazole |
Col156, Col156, ColpVC, IncI1-I(Alpha) |
| Post-stun (feathers) |
10 |
blaTEM-1B, sitABCD, tet(A) |
ampicillin, unknown[sitABCD_1_AY598030], tetracycline |
IncFIB(AP001918), IncFII, IncI1-I(Alpha), IncI2 |
| Post-stun (feet) |
224 |
blaCMY-2, blaCMY-48, blaCTX-M-194, dfrA16, formA, gyrA (D87N), gyrA (S83L), parC (S80I), qacE, qnrB2, sul1 |
ampicillin, amoxicillin/clavulanic acid, cefoxitin, ceftriaxone, trimethoprim, unknown[formA_1_X73835], ciprofloxacin I/R, nalidixic acid, unknown[qacE_1_X68232], sulfisoxazole |
IncFIA, IncHI1A(NDM-CIT), IncHI1B(pNDM-CIT), IncI2(Delta), IncN2, IncY, p0111, pKPC-CAV1321 |
| Feet removal (feet) |
10 |
aadA1, blaOXA-1, catA1, tet(B) |
streptomycin, ampicillin, chloramphenicol, tetracycline |
Col156, IncI1-I(Alpha), IncX4 |
| Pre-evisceration rehang (carcass) |
10 |
aadA1, blaTEM-1B, dfrA1, sitABCD, sul2 |
streptomycin, ampicillin, trimethoprim, unknown[sitABCD_1_AY598030], sulfisoxazole |
ColpVC, IncFIB(AP001918), IncI1-I(Alpha), p0111 |
| Post-evisceration (viscera) |
69 |
blaTEM-1B, parE (I355T), sitABCD |
ampicillin, unknown[parE (I355T)], unknown[sitABCD_1_AY598030] |
IncFIA, IncFIB(AP001918), p0111 |
| Post-mortem inspection (carcass) |
117 |
aadA1, blaTEM-1B, dfrA1, sul2 |
streptomycin, ampicillin, trimethoprim, sulfisoxazole |
IncFIA, IncFIB(AP001918), IncI1-I(Alpha), p0111 |
| Post-mortem inspection (carcass) |
1084 |
blaTEM-1C, sitABCD |
ampicillin, unknown[sitABCD_1_AY598030] |
IncFIB(AP001918), IncFII |
| Post-mortem inspection (viscera) |
117 |
aadA1, blaTEM-1B, dfrA1, sul2 |
streptomycin, ampicillin, trimethoprim, sulfisoxazole |
IncFIA, IncFIB(AP001918), IncI1-I(Alpha), p0111 |
| Neck skin trim (neck skin) |
224 |
blaCMY-2, gyrA (D87N), gyrA (S83L), parC (S80I) |
ampicillin, amoxicillin/clavulanic acid, cefoxitin, ceftriaxone, ciprofloxacin I/R, nalidixic acid |
p0111 |
| Post-inside-outside wash (carcass) |
117 |
aadA1, blaTEM-1B, dfrA1, formA, sitABCD, sul2 |
streptomycin, ampicillin, trimethoprim, unknown[formA_1_X73835], unknown[sitABCD_1_AY598030], sulfisoxazole |
ColpVC, ColpVC, ColpVC, IncFIA, IncFIB(AP001918), IncI1-I(Alpha), IncX1 |
| At dispatch (carcass) |
69 |
aac(3)-IId, blaTEM-1B, dfrA1, sitABCD |
gentamicin, ampicillin, trimethoprim, unknown[sitABCD_1_AY598030] |
IncFIB(AP001918), IncFIC(FII), IncI1-I(Alpha), IncX4 |
Table 26.Antimicrobial determinant genes, antimicrobial resistance phenotypes, and plasmids detected in E. coli isolated from samples taken from Site B in June 2023.
| Processing stage |
Sequence Type |
Genotype |
Predicted Phenotype |
Plasmid |
| Crate (litter) |
10 |
blaTEM-1B, dfrA1, gyrA (S83L), sul2, tet(A) |
ampicillin, trimethoprim, ciprofloxacin I/R, nalidixic acid, sulfisoxazole, tetracycline |
IncFII(29), IncI1-I(Alpha), p0111 |
| Crate (dirty) |
1140 |
blaTEM-1B, sul2 |
ampicillin, sulfisoxazole |
IncX1, p0111 |
| Scald water |
1049 |
aadA22, blaTEM-220, dfrA1, lnu(F), sul2 |
streptomycin, ampicillin, trimethoprim, lincomycin, sulfisoxazole |
IncFIB(AP001918), IncFIC(FII), IncI1-I(Alpha), IncI2, IncX4, p0111 |
| Pre-evisceration inspection (carcass) |
522 |
blaTEM-1B, dfrA1, sul2 |
ampicillin, trimethoprim, sulfisoxazole |
IncI1-I(Alpha), p0111 |
| Post-evisceration (viscera) |
57 |
aadA17, lnu(F), sitABCD, tet(A) |
streptomycin, lincomycin, unknown[sitABCD_1_AY598030], tetracycline |
IncFIB(AP001918), IncI1-I(Alpha), IncI2(Delta), IncX1 |
| Neck skin trim (neck skin) |
93 |
None |
Susceptible |
None |
| Post-chill (carcass) |
- |
None |
Susceptible |
None |
Table 27.Antimicrobial determinant genes, antimicrobial resistance phenotypes, and plasmids detected in E. coli isolated from samples taken from Site A in October 2023.
| Processing stage |
Sequence Type |
Genotype |
Predicted Phenotype |
Plasmid |
| Crate (litter) |
1841 |
sitABCD |
unknown[sitABCD_1_AY598030] |
ColpVC, IncFIA, IncFIB(AP001918) |
| Crate (dirty) |
6448 |
aadA5, aph(3'')-Ib, aph(6)-Id, blaCTX-M-55, dfrA17, floR, gyrA (D87N), gyrA (S83L), parC (S80I), tet(A) |
streptomycin, kanamycin, ampicillin, ceftriaxone, trimethoprim, chloramphenicol, ciprofloxacin I/R, nalidixic acid, tetracycline |
p0111 |
| Scalding (water) |
101 |
aadA1, blaTEM-1B, dfrA1, sul2 |
streptomycin, ampicillin, trimethoprim, sulfisoxazole |
IncFIA, IncI1-I(Alpha) |
| Post-defeathering (feathers) |
155 |
blaTEM-1B, dfrA1, gyrA (S83A), sul2, tet(A) |
ampicillin, trimethoprim, ciprofloxacin I/R, nalidixic acid, sulfisoxazole, tetracycline |
ColpVC, IncFIB(pLF82-PhagePlasmid), IncI1-I(Alpha), p0111 |
| Post-defeathering (feathers) |
10 |
blaTEM-1B, dfrA1, gyrA (S83L), sul2, tet(A) |
ampicillin, trimethoprim, ciprofloxacin I/R, nalidixic acid, sulfisoxazole, tetracycline |
ColpVC, ColpVC, IncI1-I(Alpha), p0111 |
| Pre-evisceration rehang (carcass) |
1196 |
blaCTX-M-15, blaTEM-1B, gyrA (D87N), gyrA (S83L), mph(A), parC (S80I), tet(A) |
ampicillin, ceftriaxone, ciprofloxacin I/R, nalidixic acid, erythromycin, azithromycin, tetracycline |
IncFIA, IncI2(Delta), IncR |
| Post-evisceration (viscera) |
6448 |
aadA5, aph(3'')-Ib, aph(6)-Id, blaCTX-M-55, dfrA17, floR, gyrA (D87N), gyrA (S83L), parC (S80I), tet(A) |
streptomycin, kanamycin, ampicillin, ceftriaxone, trimethoprim, chloramphenicol, ciprofloxacin I/R, nalidixic acid, tetracycline |
p0111 |
| Post-evisceration (viscera) |
770 |
blaTEM-1B |
ampicillin |
IncFIB(AP001918), p0111 |
| Neck skin trim (neck skin) |
6448 |
aadA5, aph(3'')-Ib, aph(6)-Id, blaCTX-M-55, dfrA17, floR, gyrA (D87N), gyrA (S83L), parC (S80I), sul2, tet(A) |
streptomycin, kanamycin, ampicillin, ceftriaxone, trimethoprim, chloramphenicol, ciprofloxacin I/R, nalidixic acid, sulfisoxazole, tetracycline |
p0111 |
| Neck skin trim (neck skin) |
6448 |
aadA5, aph(3'')-Ib, aph(6)-Id, blaCTX-M-55, dfrA17, floR, gyrA (D87N), gyrA (S83L), parC (S80I), tet(A) |
streptomycin, kanamycin, ampicillin, ceftriaxone, trimethoprim, chloramphenicol, ciprofloxacin I/R, nalidixic acid, tetracycline |
p0111 |
| Neck skin trim (neck skin) |
6448 |
aadA5, aph(3'')-Ib, aph(6)-Id, blaCTX-M-55, dfrA17, floR, gyrA (D87N), gyrA (S83L), parC (S80I), tet(A) |
streptomycin, kanamycin, ampicillin, ceftriaxone, trimethoprim, chloramphenicol, ciprofloxacin I/R, nalidixic acid, tetracycline |
p0111 |
| Post-inside-outside wash (carcass) |
48 |
ant(3'')-Ia, aph(3'')-Ib, aph(6)-Id, blaTEM-220, dfrA15, gyrA (D87N), gyrA (S83L), parC (S80I), sul3, tet(A) |
spectinomycin, streptomycin, kanamycin, ampicillin, trimethoprim, ciprofloxacin I/R, nalidixic acid, sulfisoxazole, tetracycline |
IncX1, p0111 |
| Post-chill (carcass) |
1201 |
None |
Susceptible |
IncI2(Delta), p0111 |
| At dispatch (carcass) |
2491 |
blaTEM-1B, dfrA1, sul2, tet(A) |
ampicillin, trimethoprim, sulfisoxazole, tetracycline |
IncI1-I(Alpha), p0111 |
Table 28.Antimicrobial determinant genes, antimicrobial resistance phenotypes, and plasmids detected in E. coli isolated from samples taken from Site B in November 2023.
| Processing stage |
Sequence Type |
Genotype |
Predicted Phenotype |
Plasmid |
| Crate (litter) |
1841 |
sitABCD |
unknown[sitABCD_1_AY598030] |
ColpVC, IncFIA, IncFIB(AP001918) |
| Crate (litter) |
6448 |
aadA5, aph(3'')-Ib, aph(6)-Id, blaCTX-M-55, dfrA17, floR, gyrA (D87N), gyrA (S83L), parC (S80I), tet(A) |
streptomycin, kanamycin, ampicillin, ceftriaxone, trimethoprim, chloramphenicol, ciprofloxacin I/R, nalidixic acid, tetracycline |
p0111 |
| Post-stun (feathers) |
9120 |
sitABCD |
unknown[sitABCD_1_AY598030] |
IncFIB(AP001918) |
| Scalding (water) |
111 |
None |
Susceptible |
IncFII(pHN7A8), IncX4 |
| Feet removal (feet) |
877 |
None |
Susceptible |
Col156, IncX1 |
| Post-evisceration (viscera) |
6448 |
aadA5, aph(3'')-Ib, aph(6)-Id, blaCTX-M-55, dfrA17, floR, gyrA (D87N), gyrA (S83L), parC (S80I), tet(A) |
streptomycin, kanamycin, ampicillin, ceftriaxone, trimethoprim, chloramphenicol, ciprofloxacin I/R, nalidixic acid, tetracycline |
p0111 |
| Post-evisceration (viscera) |
69 |
aph(3'')-Ib, aph(6)-Id, blaTEM-1B, dfrA14, sul2, tet(A) |
streptomycin, kanamycin, ampicillin, trimethoprim, sulfisoxazole, tetracycline |
IncFIA, IncFIB(AP001918) |
| Neck skin trim (neck skin) |
162 |
blaTEM-220, sitABCD, tet(A) |
ampicillin, unknown[sitABCD_1_AY598030], tetracycline |
IncFIB(AP001918) |
| Neck skin trim (neck skin) |
10 |
None |
Susceptible |
IncFIA(HI1), IncI1-I(Alpha), IncY |
| Post-intervention (carcass) |
3249 |
None |
Susceptible |
None |
| Intervention equipment |
3249 |
None |
Susceptible |
None |
| Post-chill (carcass) |
6448 |
aadA5, aph(3'')-Ib, aph(6)-Id, blaCTX-M-55, dfrA17, floR, gyrA (D87N), gyrA (S83L), parC (S80I), tet(A) |
streptomycin, kanamycin, ampicillin, ceftriaxone, trimethoprim, chloramphenicol, ciprofloxacin I/R, nalidixic acid, tetracycline |
p0111 |
| Post-chill (carcass) |
6422 |
None |
Susceptible |
None |
| At dispatch (carcass) |
- |
blaTEM-1B, dfrA1, gyrA (S83A), sul2, tet(A) |
ampicillin, trimethoprim, ciprofloxacin I/R, nalidixic acid, sulfisoxazole, tetracycline |
ColpVC, IncFIB(pLF82-PhagePlasmid), IncI1-I(Alpha), p0111 |
The terminology used to describe bacteria, ARG classes, ARGs, and phage in this report is that of the Sequence and analysis provider CosmosID, the external laboratory that carried out the shotgun metagenomic analysis. In the terminology of Cosmos an ARG “Branch” is a designation for a higher-level node which represents shared homology among a group of specific gene sequences. This indicates that the sequences generated for that samples were not able to resolve to a specific ARG allele.
It should be noted that metagenomic sequencing detects DNA from both dead and alive organisms and further testing is required to establish whether any of the organisms, genes, and/or phage detected are viable and contributing to the microbial ecology or risk (Feye et al., 2020). In addition, this data is not quantitative, relative abundance describes the contribution/proportion of a given taxon/feature to the total microbial community detected within a sample (CosmosID, 2023; Feye et al., 2020).
The results presented are “filtered” sequence data supplied by CosmosID. The Cosmos filtering process is a proprietary stage of data processing, where a framework is applied that has been developed using hundreds of samples of known composition, in order to balance sensitivity and specificity. This framework is then used to predict which assignments are highly likely to be correct (Filtered) vs those which are possibly present but may be inaccurate or spurious (Total).
3.1.8.1. Bacteria
In total, 14 and 17 phyla were detected in Sites A and B, respectively. Proteobacteria, Firmicutes, Actinobacteria, and Bacteroidetes accounted for the majority of detected phyla in all samples. A total of 1407 different bacterial species (including classifiable and unclassifiable species [i.e., where the genus but not the specific species could be identified]) were detected using shotgun metagenomic analysis in all of the 201 samples collected from the poultry sites in this project. There was a greater diversity of bacterial species (including classifiable and unclassifiable species) detected over the sampling period at Site B compared to Site A, 1220 vs 940, respectively. Of these species, 439 and 510 occurred in Sites A and B on all sampling periods, respectively, with 334 different species being detected in samples taken from both sites on all occasions.
The relative abundance of the dominant bacterial species (including classifiable and unclassifiable species) detected in samples collected on each of the visits to Site A are presented in Figure 23, Figure 24, and Figure 25, and from Site B in Figure 26, Figure 27, and Figure 28, respectively. The overall most abundant classifiable bacterial species detected at Site A were: Bifidobacterium pullorum, Acinetobacter johnsonii, and Acinetobacter lwoffii (in order). E. coli was the seventh most abundant classifiable bacterial species overall. A. johnsonii, A. lwoffii and Acinetobacter gandensis (in order) were the overall most abundant classifiable bacterial species at Site B. E. coli was the eighth most abundant classifiable bacterial species overall. The most abundant species at Site A, B. pullorum, was the sixth most abundant at Site B.

Figure 23.Relative abundance of the 20 most abundant bacterial species detected using shotgun metagenomic analysis in samples taken along the process chain at Site A on a visit in March 2023 (legend lists bacterial species in order of overall abundance, left to right; * = unclassifiable species).

Figure 24.Relative abundance of the 20 most abundant bacterial species detected using shotgun metagenomic analysis in samples taken along the process chain at Site A on a visit in June 2023 (legend lists bacterial species in order of overall abundance, left to right; * = unclassifiable species).

Figure 25.Relative abundance of the 20 most abundant bacterial species detected using shotgun metagenomic analysis in samples taken along the process chain at Site A on a visit in October 2023 (legend lists bacterial species in order of overall abundance, left to right; * = unclassifiable species).

Figure 26.Relative abundance of the 20 most abundant bacterial species detected using shotgun metagenomic analysis in samples taken along the process chain at Site B on a visit in March 2023 (legend lists bacterial species in order of overall abundance, left to right; * = unclassifiable species).

Figure 27.Relative abundance of the 20 most abundant bacterial species detected using shotgun metagenomic analysis in samples taken along the process chain at Site B on a visit in June 2023 (legend lists bacterial species in order of overall abundance, left to right; * = unclassifiable species).
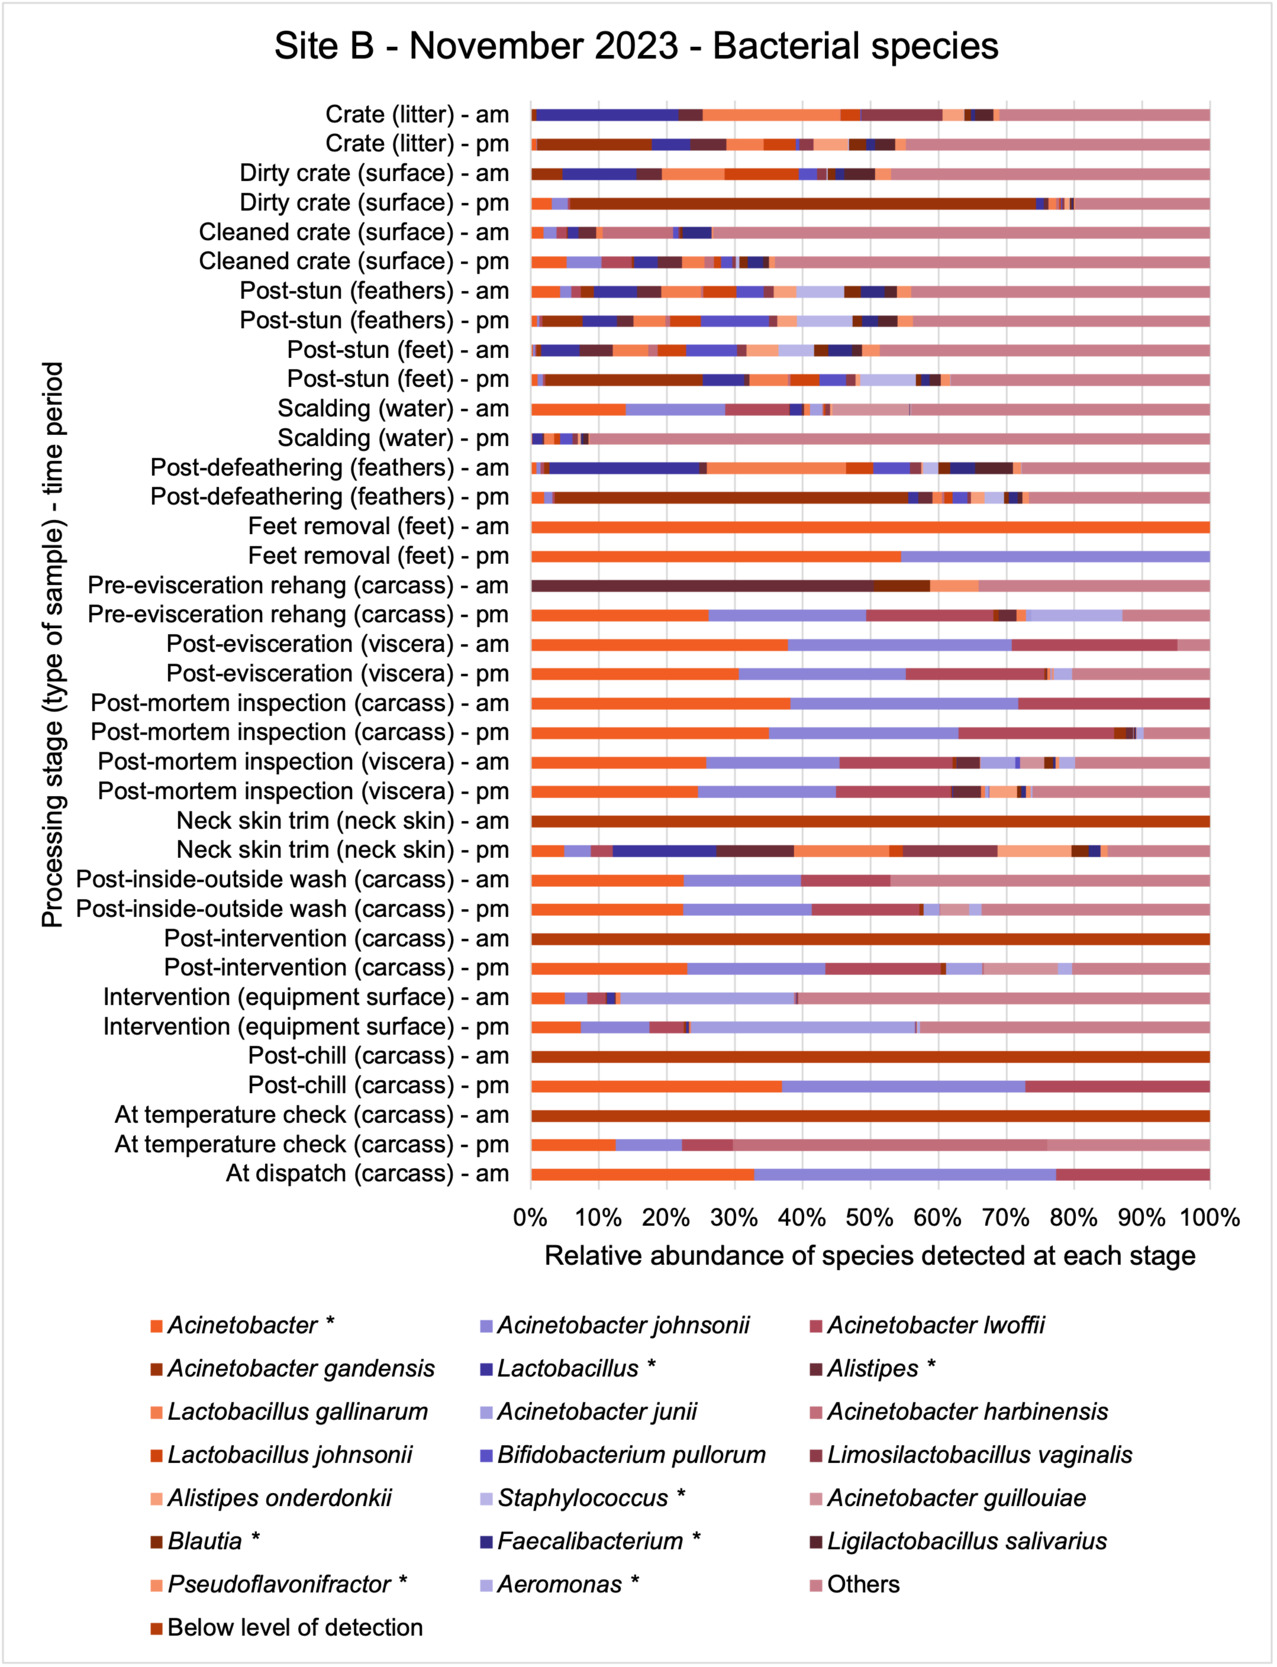
Figure 28.Relative abundance of the 20 most abundant bacterial species detected using shotgun metagenomic analysis in samples taken along the process chain at Site B on a visit in November 2023 (legend lists bacterial species in order of overall abundance, left to right; * = unclassifiable species).
A summary of the number of different species detected on the different sampling periods is shown in Table 29. Although further sampling is required to statistically establish seasonal trends, there did appear to be a seasonal trend in both sites, with a lower diversity (number) of different bacterial species being present in samples taken in October/November, than in March. With the highest diversity measured in samples in both sites collected in June. While a large range of different species of bacteria were detected, many of these bacteria species were only detected in samples collected at only one sampling point along the processing chain.
Table 29.Number of different bacteria species (including classifiable and unclassifiable species) detected using shotgun metagenomic analysis in samples taken on visits in March, June, and October or November 2023 at the two poultry processing sites.
| Details |
Site A
March |
Site B
March |
Site A
June |
Site B
June |
Site A
October |
Site B
November |
| Number of different bacterial species detected on each site visit |
691 |
814 |
729 |
909 |
620 |
778 |
| Number of different bacterial species detected at only one sampling point on each site visit |
251 |
282 |
189 |
236 |
202 |
295 |
| Number of different bacterial species detected at more than 10 sampling points on each site visit |
68 |
94 |
108 |
151 |
75 |
114 |
Generally, the diversity of bacterial species detected in the samples collected from the sites appeared to reduce through the processing chain in each site on all of the sampling occasions (Figure 29 and Table 30). A greater number of different bacterial species were detected in samples taken before evisceration than in samples taken after evisceration in both sites on all occasions. The number of bacterial species detected at both sites in samples taken after the thermal intervention process stage (which is specifically designed to reduce microbial contamination) used at both sites was particularly low but began dropping after defeathering. However, samples taken in June in Site B did not show as big a drop in bacterial diversity during processing (Figure 29Figure ) and there were more bacterial species present in samples taken after the pre-chilling thermal intervention process stage in samples collected in June than detected in samples collected from this Site (Site B) in March or November. It is not clear why this was the case and further sampling is required to establish whether there is a seasonal pattern or whether this was a one-off occurrence due to something that specifically occurred during processing in this plant on the day in June that samples were collected.

Figure 29.Diversity of different bacterial species (including classifiable and unclassifiable species) detected using shotgun metagenomic analysis in samples taken at different processing stages on visits in March, June, and October or November 2023 to the two sites.
Table 30.Number of different bacterial species (including classifiable and unclassifiable species) detected using shotgun metagenomic analysis in samples taken at different processing stages on visits in March, June, and October or November 2023 to the two sites (NS represent sampling points where no samples were taken on visit).
| Processing stage (type of sample) - time |
Site A
March |
Site B
March |
Site A
June |
Site B
June |
Site A
Oct |
Site B
Nov |
| Crate (litter) - am |
158 |
133 |
251 |
200 |
162 |
174 |
| Crate (litter) - pm |
153 |
144 |
155 |
171 |
285 |
170 |
| Dirty crate (surface) - am |
239 |
183 |
246 |
377 |
367 |
146 |
| Dirty crate (surface) - pm |
190 |
203 |
169 |
206 |
214 |
268 |
| Cleaned crate (surface) - am |
168 |
147 |
223 |
204 |
71 |
98 |
| Cleaned crate (surface) - pm |
194 |
142 |
337 |
156 |
109 |
283 |
| Post-stun (feathers/feet) - am |
NS |
NS |
NS |
109 |
NS |
NS |
| Post-stun (feathers/feet) - pm |
NS |
NS |
NS |
84 |
NS |
NS |
| Post-stun (feathers) - am |
197 |
227 |
236 |
NS |
131 |
159 |
| Post-stun (feathers) - pm |
249 |
208 |
214 |
NS |
137 |
216 |
| Post-stun (feet) - am |
152 |
207 |
149 |
NS |
176 |
163 |
| Post-stun (feet) - pm |
167 |
377 |
180 |
NS |
125 |
194 |
| Scalding (water) - am |
134 |
148 |
152 |
188 |
128 |
200 |
| Scalding (water) - pm |
130 |
145 |
152 |
221 |
146 |
195 |
| Post-defeathering (feathers) - am |
49 |
NS |
134 |
142 |
53 |
157 |
| Post-defeathering (feathers) - pm |
225 |
NS |
149 |
134 |
168 |
209 |
| Feet removal (feet) - am |
35 |
35 |
108 |
170 |
84 |
1 |
| Feet removal (feet) - pm |
57 |
NS |
170 |
154 |
140 |
2 |
| Pre-evisceration rehang (carcass) - am |
2 |
123 |
92 |
205 |
2 |
7 |
| Pre-evisceration rehang (carcass) - pm |
11 |
82 |
77 |
142 |
5 |
20 |
| Post-evisceration (viscera) - am |
26 |
31 |
32 |
60 |
5 |
4 |
| Post-evisceration (viscera) - pm |
14 |
5 |
27 |
48 |
9 |
43 |
| Post-mortem inspection (carcass) - am |
35 |
152 |
40 |
155 |
10 |
3 |
| Post-mortem inspection (carcass) - pm |
32 |
33 |
38 |
138 |
1 |
41 |
| Post-mortem inspection (viscera) - am |
43 |
105 |
71 |
88 |
0 |
93 |
| Post-mortem inspection (viscera) - pm |
15 |
0 |
39 |
135 |
9 |
45 |
| Neck skin trim (neck skin) - am |
1 |
NS |
0 |
25 |
70 |
0 |
| Neck skin trim (neck skin) - pm |
2 |
11 |
0 |
43 |
7 |
23 |
| Post-inside-outside wash (carcass) - am |
43 |
130 |
146 |
NS |
1 |
17 |
| Post-inside-outside wash (carcass) - pm |
4 |
112 |
12 |
NS |
9 |
92 |
| Post-Intervention (carcass) - am |
14 |
30 |
NS |
155 |
NS |
0 |
| Post-Intervention (carcass) - pm |
2 |
36 |
NS |
177 |
NS |
80 |
| Intervention (equipment surface) - am |
NS |
115 |
NS |
176 |
NS |
109 |
| Intervention (equipment surface) - pm |
NS |
71 |
NS |
138 |
NS |
203 |
| Post-chill (carcass) - am |
13 |
13 |
29 |
146 |
2 |
0 |
| Post-chill (carcass) - pm |
15 |
7 |
7 |
111 |
15 |
3 |
| At temperature check (carcass) - am |
NS |
32 |
NS |
149 |
NS |
0 |
| At temperature check (carcass) - pm |
NS |
2 |
NS |
99 |
NS |
9 |
| At dispatch (carcass) - am |
4 |
1 |
13 |
39 |
0 |
3 |
| At dispatch (carcass) - pm |
2 |
NS |
4 |
NS |
0 |
NS |
Only 51 of the 1407 bacteria species (including classifiable and unclassifiable species) were detected at more than 10 sampling points along the processing chain at each site in each month (March, June, and October or November 2023) and were also present in samples taken at post-intervention stages in the sites on at least one occasion (such cells are highlighted in Table 31 below). Of these species A. johnsonii, B. pullorum, and E. coli were the most commonly occurring classifiable bacterial species in samples taken at both sites on all occasions.
Table 31.Proportion of sampling points where different bacteria species (including classifiable and unclassified species) were detected using shotgun metagenomic analysis in samples taken at more than 10 sampling points in March, June, and October or November 2023 at the two sites and also found to be present in samples taken at post-intervention stages on at least one occasion (highlighted cells = also present in post-intervention samples).
| Bacterial species (including classifiable and * unclassifiable species) |
Site A
March |
Site B
March |
Site A
June |
Site B
June |
Site A
Oct |
Site B
Nov |
| Acinetobacter * |
20/34
(59%) |
26/33
(79%) |
25/32
(79%) |
31/33
(94%) |
26/32
(82%) |
32/37
(87%) |
| A. johnsonii |
15/34 (45%) |
24/33 (73%) |
24/32 (75%) |
31/33 (94%) |
23/32 (72%) |
30/37 (81%) |
| B. pullorum |
32/34 (95%) |
19/33 (58%) |
29/32 (91%) |
21/33 (64%) |
17/32 (54%) |
17/37 (45%) |
|
Lactobacillus * |
28/34 (83%) |
22/33 (67%) |
26/32 (82%) |
19/33 (58%) |
18/32 (57%) |
19/37 (51%) |
| Alistipes * |
27/34 (80%) |
21/33 (64%) |
25/32 (79%) |
18/33 (55%) |
14/32 (44%) |
23/37 (62%) |
| E. coli |
15/34 (45%) |
21/33 (64%) |
21/32 (66%) |
30/33 (91%) |
19/32 (60%) |
21/37 (56%) |
| A. lwoffii |
11/34 (33%) |
20/33 (61%) |
21/32 (66%) |
26/33 (79%) |
21/32 (66%) |
27/37 (72%) |
| Lactobacillus gallinarum |
19/34 (56%) |
22/33 (67%) |
25/32 (79%) |
18/33 (55%) |
17/32 (54%) |
21/37 (56%) |
| A. gandensis |
11/34 (33%) |
18/33 (55%) |
17/32 (54%) |
29/33 (88%) |
14/32 (44%) |
22/37 (59%) |
|
Blautia * |
19/34 (56%) |
16/33 (49%) |
22/32 (69%) |
18/33 (55%) |
14/32 (44%) |
20/37 (54%) |
|
Faecalibacterium * |
19/34 (56%) |
18/33 (55%) |
21/32 (66%) |
17/33 (52%) |
15/32 (47%) |
19/37 (51%) |
|
Pseudoflavonifractor * |
18/34 (53%) |
16/33 (49%) |
20/32 (63%) |
18/33 (55%) |
14/32 (44%) |
21/37 (56%) |
| Lactobacillus johnsonii |
24/34 (71%) |
14/33 (43%) |
21/32 (66%) |
13/33 (40%) |
14/32 (44%) |
15/37 (40%) |
|
Lachnoclostridium * |
17/34 (50%) |
14/33 (43%) |
21/32 (66%) |
17/33 (52%) |
14/32 (44%) |
17/37 (45%) |
|
Flavonifractor * |
17/34 (50%) |
15/33 (46%) |
18/32 (57%) |
15/33 (46%) |
14/32 (44%) |
20/37 (54%) |
| Limosilactobacillus vaginalis |
19/34 (56%) |
16/33 (49%) |
19/32 (60%) |
13/33 (40%) |
14/32 (44%) |
17/37 (45%) |
| Streptococcus alactolyticus |
20/34 (59%) |
14/33 (43%) |
19/32 (60%) |
15/33 (46%) |
17/32 (54%) |
13/37 (35%) |
|
Anaeromassilibacillus * |
17/34 (50%) |
15/33 (46%) |
19/32 (60%) |
16/33 (49%) |
14/32 (44%) |
15/37 (40%) |
|
Corynebacterium * |
18/34 (53%) |
15/33 (46%) |
17/32 (54%) |
14/33 (43%) |
17/32 (54%) |
13/37 (35%) |
|
Eubacterium * |
15/34 (45%) |
16/33 (49%) |
17/32 (54%) |
15/33 (46%) |
14/32 (44%) |
16/37 (43%) |
| Limosilactobacillus reuteri |
20/34 (59%) |
15/33 (46%) |
18/32 (57%) |
12/33 (37%) |
14/32 (44%) |
14/37 (37%) |
| Merdimonas faecis |
15/34 (45%) |
13/33 (40%) |
18/32 (57%) |
16/33 (49%) |
14/32 (44%) |
16/37 (43%) |
|
Staphylococcus * |
15/34 (45%) |
15/33 (46%) |
16/32 (50%) |
16/33 (49%) |
17/32 (54%) |
13/37 (35%) |
| Bifidobacterium pseudolongum |
18/34 (53%) |
13/33 (40%) |
15/32 (47%) |
17/33 (52%) |
13/32 (41%) |
15/37 (40%) |
| Lactobacillus crispatus |
20/34 (59%) |
13/33 (40%) |
18/32 (57%) |
13/33 (40%) |
14/32 (44%) |
13/37 (35%) |
|
Drancourtella * |
15/34 (45%) |
14/33 (43%) |
16/32 (50%) |
14/33 (43%) |
14/32 (44%) |
15/37 (40%) |
| Ligilactobacillus salivarius |
16/34 (48%) |
15/33 (46%) |
14/32 (44%) |
12/33 (37%) |
14/32 (44%) |
13/37 (35%) |
| Rubneribacter badeniensis |
14/34 (42%) |
13/33 (40%) |
15/32 (47%) |
14/33 (43%) |
13/32 (41%) |
13/37 (35%) |
| Subdoligranulum variabile |
14/34 (42%) |
13/33 (40%) |
17/32 (54%) |
13/33 (40%) |
12/32 (38%) |
13/37 (35%) |
|
Gordonibacter * |
13/34 (39%) |
13/33 (40%) |
15/32 (47%) |
14/33 (43%) |
13/32 (41%) |
13/37 (35%) |
| Corynebacterium ammoniagenes |
13/34 (39%) |
12/33 (37%) |
14/32 (44%) |
14/33 (43%) |
13/32 (41%) |
13/37 (35%) |
|
Ruminococcus * |
11/34 (33%) |
13/33 (40%) |
15/32 (47%) |
13/33 (40%) |
14/32 (44%) |
13/37 (35%) |
| Lachnoclostridium phocaeense |
11/34 (33%) |
13/33 (40%) |
15/32 (47%) |
12/33 (37%) |
13/32 (41%) |
14/37 (37%) |
| Mammaliicoccus lentus |
14/34 (42%) |
11/33 (34%) |
13/32 (41%) |
13/33 (40%) |
15/32 (47%) |
12/37 (32%) |
|
Bacteroides * |
11/34 (33%) |
11/33 (34%) |
17/32 (54%) |
14/33 (43%) |
10/32 (32%) |
14/37 (37%) |
|
Brachybacterium * |
12/34 (36%) |
11/33 (34%) |
12/32 (38%) |
14/33 (43%) |
14/32 (44%) |
13/37 (35%) |
| Corynebacterium casei |
14/34 (42%) |
12/33 (37%) |
11/32 (35%) |
13/33 (40%) |
13/32 (41%) |
13/37 (35%) |
| Staphylococcus aureus |
13/34 (39%) |
11/33 (34%) |
14/32 (44%) |
12/33 (37%) |
14/32 (44%) |
12/37 (32%) |
| Fournierella massiliensis |
12/34 (36%) |
13/33 (40%) |
15/32 (47%) |
12/33 (37%) |
11/32 (35%) |
12/37 (32%) |
| Weissella thailandensis |
12/34 (36%) |
12/33 (37%) |
11/32 (35%) |
13/33 (40%) |
14/32 (44%) |
13/37 (35%) |
| Staphylococcus cohnii |
13/34 (39%) |
11/33 (34%) |
11/32 (35%) |
13/33 (40%) |
15/32 (47%) |
11/37 (29%) |
| Brevibacterium linens |
12/34 (36%) |
11/33 (34%) |
12/32 (38%) |
13/33 (40%) |
12/32 (38%) |
13/37 (35%) |
|
Clostridium * |
11/34 (33%) |
13/33 (40%) |
15/32 (47%) |
10/33 (31%) |
12/32 (38%) |
12/37 (32%) |
| Limosilactobacillus oris |
14/34 (42%) |
11/33 (34%) |
11/32 (35%) |
10/33 (31%) |
14/32 (44%) |
13/37 (35%) |
| Weissella jogaejeotgali |
12/34 (36%) |
12/33 (37%) |
11/32 (35%) |
12/33 (37%) |
13/32 (41%) |
13/37 (35%) |
| Corynebacterium urealyticum |
13/34 (39%) |
12/33 (37%) |
11/32 (35%) |
11/33 (34%) |
13/32 (41%) |
12/37 (32%) |
| Enterococcus hirae |
10/34 (30%) |
13/33 (40%) |
12/32 (38%) |
12/33 (37%) |
13/32 (41%) |
12/37 (32%) |
| Staphylococcus arlettae |
13/34 (39%) |
12/33 (37%) |
11/32 (35%) |
13/33 (40%) |
12/32 (38%) |
11/37 (29%) |
| Brachybacterium paraconglomeratum |
12/34 (36%) |
10/33 (31%) |
11/32 (35%) |
13/33 (40%) |
11/32 (35%) |
13/37 (35%) |
| Brachybacterium faecium |
12/34 (36%) |
10/33 (31%) |
11/32 (35%) |
12/33 (37%) |
11/32 (35%) |
12/37 (32%) |
| Angelakisella massiliensis |
10/34 (30%) |
10/33 (31%) |
12/32 (38%) |
10/33 (31%) |
10/32 (32%) |
13/37 (35%) |
3.1.8.2. Antimicrobial Resistance Genes (ARGs)
Shotgun metagenomic analysis revealed the occurrence of a total of 442 different ARGs which may be involved in resistance to 16 different classes of antimicrobial (hereafter referred to as ARG classes) in all the 201 samples collected along the processing chain in the poultry sites sampled. The detected classes were: Tetracyclines, Aminoglycoside, Macrolide-Lincosamine-Streptogramin B, Class D beta-lactamases, Sulfonamides-Trimethoprim, Polymixin-Colistin, Sulfa drugs, Class C beta-lactamases, Class A beta-lactamases, Phenicol, Quinolones and fluoroquinolones, Glycopeptides, Fosfomycin, 5-Nitroimidazole, Class B beta-lactamases, and Rifampicin.
The relative abundance of the ARG classes detected in samples collected on each of the visits at Site A are presented in Figure 30, Figure 31, and Figure 32; and at Site B in Figure 33, Figure 34, and Figure 35 respectively. The overall most abundant ARG classes detected at Site A were: Tetracyclines, Macrolide-Lincosamine-Streptogramin B, Aminoglycosides, and Class D beta-lactamases (in order). These were also the most abundant classes detected at Site B, but differed in order, with Class D beta-lactamases being the second most abundant and Macrolide-Lincosamine-Streptogramin B being the fourth.

Figure 30.Relative abundance of ARG classes detected using shotgun metagenomic analysis in samples taken along the process chain at Site A in a visit in March 2023 (legend ARG classes in order of overall abundance, left to right).

Figure 31.Relative abundance of ARG classes detected using shotgun metagenomic analysis in samples taken along the process chain at Site A in a visit in June 2023 (legend lists ARG classes in order of overall abundance, left to right).

Figure 32.Relative abundance of ARG classes detected using shotgun metagenomic analysis in samples taken along the process chain at Site A in a visit in October 2023 (legend lists ARG classes in order of overall abundance, left to right).

Figure 33.Relative abundance of ARG classes detected using shotgun metagenomic analysis in samples taken along the process chain at Site B in a visit in March 2023 (legend lists ARG classes in order of overall abundance, left to right).

Figure 34.Relative abundance of ARG classes detected using shotgun metagenomic analysis in samples taken along the process chain at Site B in a visit in June 2023 (legend lists ARG classes in order of overall abundance, left to right).

Figure 35.Relative abundance of ARG classes detected using shotgun metagenomic analysis in samples taken along the process chain at Site B in November 2023 (legend lists ARG classes in order of overall abundance, left to right).
A summary of the number of different ARG classes detected on the different sampling periods is shown in Table 32. As with the bacterial species, generally the diversity of ARG classes detected in the samples collected from the sites appeared to reduce through the processing chain in each site on all of the sampling occasions, particularly post evisceration (Figure 36 and Table 33). The exception was Site B in June, where a high diversity of different ARG classes were still detected at post evisceration sampling points.
Table 32.Number of different ARG classes detected using shotgun metagenomic analysis in samples taken in visits in March, June, and October or November 2023 at the two poultry processing sites.
| Details |
Site A
March |
Site B
March |
Site A
June |
Site B
June |
Site A
Oct |
Site B
Nov |
| Number of different ARG classes detected on each visit |
14 |
14 |
14 |
15 |
14 |
15 |
| Number of different ARG classes detected at only one sampling point on each visit |
1 |
1 |
1 |
0 |
0 |
1 |
| Number of different ARG classes detected at more than 10 sampling points on each visit |
9 |
10 |
11 |
10 |
9 |
10 |

Figure 36.Diversity of different ARG classes detected using shotgun metagenomic analysis in samples taken at different processing stages in visits in March, June, and October or November 2023 to the two sites.
Table 33.Number of different ARG classes detected using shotgun metagenomic analysis in samples taken at different processing stages in visits in March, June, and October or November 2023 to the two sites (NS represent sampling points where no samples were taken on visit).
| Processing stage (type of sample) - time |
Site A
March |
Site B
March |
Site A
June |
Site B
June |
Site A
Oct |
Site B
Nov |
| Crate (litter) - am |
11 |
11 |
13 |
12 |
11 |
10 |
| Crate (litter) - pm |
11 |
10 |
11 |
12 |
12 |
11 |
| Dirty crate (surface) - am |
8 |
12 |
9 |
12 |
12 |
12 |
| Dirty crate (surface) - pm |
11 |
12 |
6 |
12 |
10 |
11 |
| Cleaned crate (surface) - am |
13 |
10 |
10 |
10 |
7 |
5 |
| Cleaned crate (surface) - pm |
6 |
12 |
11 |
9 |
9 |
10 |
| Post-stun (feathers/feet) - am |
NS |
NS |
NS |
11 |
NS |
NS |
| Post-stun (feathers/feet) - pm |
NS |
NS |
NS |
9 |
NS |
NS |
| Post-stun (feathers) - am |
12 |
10 |
12 |
NS |
11 |
10 |
| Post-stun (feathers) - pm |
12 |
12 |
12 |
NS |
8 |
12 |
| Post-stun (feet) - am |
11 |
8 |
11 |
NS |
10 |
11 |
| Post-stun (feet) - pm |
12 |
7 |
11 |
NS |
10 |
12 |
| Scalding (water) - am |
7 |
8 |
7 |
11 |
8 |
11 |
| Scalding (water) - pm |
5 |
9 |
7 |
11 |
7 |
8 |
| Post-defeathering (feathers) - am |
5 |
NS |
11 |
10 |
5 |
10 |
| Post-defeathering (feathers) - pm |
11 |
NS |
10 |
12 |
10 |
12 |
| Feet removal (feet) - am |
6 |
8 |
10 |
11 |
8 |
0 |
| Feet removal (feet) - pm |
6 |
NS |
11 |
13 |
11 |
0 |
| Pre-evisceration rehang (carcass) - am |
0 |
9 |
9 |
11 |
1 |
2 |
| Pre-evisceration rehang (carcass) - pm |
5 |
6 |
7 |
8 |
2 |
4 |
| Post-evisceration (viscera) - am |
3 |
5 |
6 |
8 |
2 |
0 |
| Post-evisceration (viscera) - pm |
3 |
1 |
5 |
10 |
2 |
6 |
| Post-mortem inspection (carcass) - am |
7 |
9 |
9 |
10 |
2 |
0 |
| Post-mortem inspection (carcass) - pm |
4 |
6 |
5 |
10 |
2 |
3 |
| Post-mortem inspection (viscera) - am |
4 |
11 |
10 |
11 |
0 |
7 |
| Post-mortem inspection (viscera) - pm |
2 |
0 |
4 |
12 |
5 |
4 |
| Neck skin trim (neck skin) - am |
2 |
NS |
0 |
1 |
6 |
0 |
| Neck skin trim (neck skin) - pm |
1 |
8 |
0 |
3 |
3 |
2 |
| Post-inside-outside wash (carcass) - am |
4 |
8 |
10 |
NS |
3 |
1 |
| Post-inside-outside wash (carcass) - pm |
0 |
9 |
3 |
NS |
4 |
9 |
| Post-Intervention (carcass) - am |
2 |
4 |
NS |
11 |
NS |
0 |
| Post-Intervention (carcass) - pm |
0 |
5 |
NS |
12 |
NS |
11 |
| Intervention (equipment surface) - am |
NS |
4 |
NS |
7 |
NS |
5 |
| Intervention (equipment surface) - pm |
NS |
4 |
NS |
5 |
NS |
9 |
| Post-chill (carcass) - am |
3 |
2 |
4 |
10 |
0 |
0 |
| Post-chill (carcass) - pm |
4 |
0 |
1 |
10 |
4 |
1 |
| At temperature check (carcass) - am |
NS |
2 |
NS |
9 |
NS |
0 |
| At temperature check (carcass) - pm |
NS |
1 |
NS |
10 |
NS |
1 |
| At dispatch (carcass) - am |
1 |
0 |
2 |
5 |
0 |
1 |
| At dispatch (carcass) - pm |
1 |
NS |
1 |
NS |
1 |
NS |
Overall, genes in classes for Tetracyclines, Aminoglycoside, Macrolide-Lincosamine-Streptogramin B, Class D beta-lactamases, Sulfonamides-Trimethoprim, Polimixin-Colistin, Sulfa drugs, Class C beta-lactamases, Class A beta-lactamases, and Phenicol were the most detected in the samples taken throughout processing at both of the sites on all visits. Genes in these classes were detected in samples taken at more than 10 different sampling points along the processing chain in both site A and B on each of sampling periods (Table 34). In contrast, genes in classes for Fosfomycin, 5-Nitroimidazole, Class B beta-lactamases, and Rifampicin were detected in very few samples taken from these sites. For example, Rifampicin class genes were only detected in one sample (viscera sampled at post-mortem inspection) from Site B in November.
Table 34.Proportion of sampling points where an ARG class was detected using shotgun metagenomic analysis in samples taken during processing in Sites A and B on visits in March, June, and October or November 2023 (highlighted cells = ARG class detected in post-intervention samples).
| ARG class |
Site A March |
Site A June |
Site A Oct |
Site B March |
Site B June |
Site B Nov |
| Tetracyclines |
30/34 (89%) |
29/33 (88%) |
30/32 (94%) |
32/33 (97%) |
28/32 (88%) |
29/37 (79%) |
| Aminoglycoside |
24/34 (71%) |
26/33 (79%) |
26/32 (82%) |
31/33 (94%) |
19/32 (60%) |
22/37 (60%) |
| Macrolide-Lincosamine-Streptogramin B |
26/34 (77%) |
21/33 (64%) |
26/32 (82%) |
28/33 (85%) |
18/32 (57%) |
21/37 (57%) |
| Class D beta-lactamases |
16/34 (48%) |
22/33 (67%) |
24/32 (75%) |
30/33 (91%) |
24/32 (75%) |
22/37 (60%) |
| Sulfonamides-Trimethoprim |
16/34 (48%) |
20/33 (61%) |
22/32 (69%) |
30/33 (91%) |
17/32 (54%) |
19/37 (52%) |
| Polimixin-Colistin |
14/34 (42%) |
21/33 (64%) |
20/32 (63%) |
29/33 (88%) |
19/32 (60%) |
17/37 (46%) |
| Sulfa drugs |
11/34 (33%) |
18/33 (55%) |
17/32 (54%) |
27/33 (82%) |
14/32 (44%) |
17/37 (46%) |
| Class C beta-lactamases |
10/34 (30%) |
19/33 (58%) |
16/32 (50%) |
30/33 (91%) |
10/32 (32%) |
17/37 (46%) |
| Class A beta-lactamases |
12/34 (36%) |
17/33 (52%) |
17/32 (54%) |
26/33 (79%) |
12/32 (38%) |
17/37 (46%) |
| Phenicol |
15/34 (45%) |
15/33 (46%) |
16/32 (50%) |
21/33 (64%) |
13/32 (41%) |
13/37 (36%) |
| Quinolones and fluoroquinolones |
8/34 (24%) |
3/33 (10%) |
14/32 (44%) |
8/33 (25%) |
4/32 (13%) |
6/37 (17%) |
| Glycopeptides |
7/34 (21%) |
8/33 (25%) |
5/32 (16%) |
7/33 (22%) |
3/32 (10%) |
6/37 (17%) |
| Fosfomycin |
0/34 (0%) |
1/33 (4%) |
4/32 (13%) |
10/33 (31%) |
2/32 (7%) |
2/37 (6%) |
| 5-Nitroimidazole |
1/34 (3%) |
0/33 (0%) |
0/32 (0%) |
7/33 (22%) |
3/32 (10%) |
0/37 (0%) |
| Class B beta-lactamases |
3/34 (9%) |
3/33 (10%) |
1/32 (4%) |
2/33 (7%) |
0/32 (0%) |
2/37 (6%) |
| Rifampicin |
0/34 (0%) |
0/33 (0%) |
0/32 (0%) |
0/33 (0%) |
0/32 (0%) |
1/37 (3%) |
The relative abundance of the ARGs detected in samples collected on visits in March, June, and October to Site A are presented in Figure 37, Figure 38, and Figure 39 respectively; and in visits in March, June, and November to Site B in Figure 40, Figure 41, and Figure 42. The overall most abundant ARGs detected at both Site A and B were: Tetracycline tet(39) 1 KT346360, Tetracycline 41 2477 Branch, and Macrolide lnu(A) 1 M14039 (in order).

Figure 37.Relative abundance of the 20 most abundant ARGs detected using shotgun metagenomic analysis in samples taken along the process chain at Site A in a visit in March 2023 (legend lists ARGs in order of overall abundance, left to right).

Figure 38.Relative abundance of the 20 most abundant ARGs detected using shotgun metagenomic analysis in samples taken along the process chain at Site A in a visit in June 2023 (legend lists ARGs in order of overall abundance, left to right).
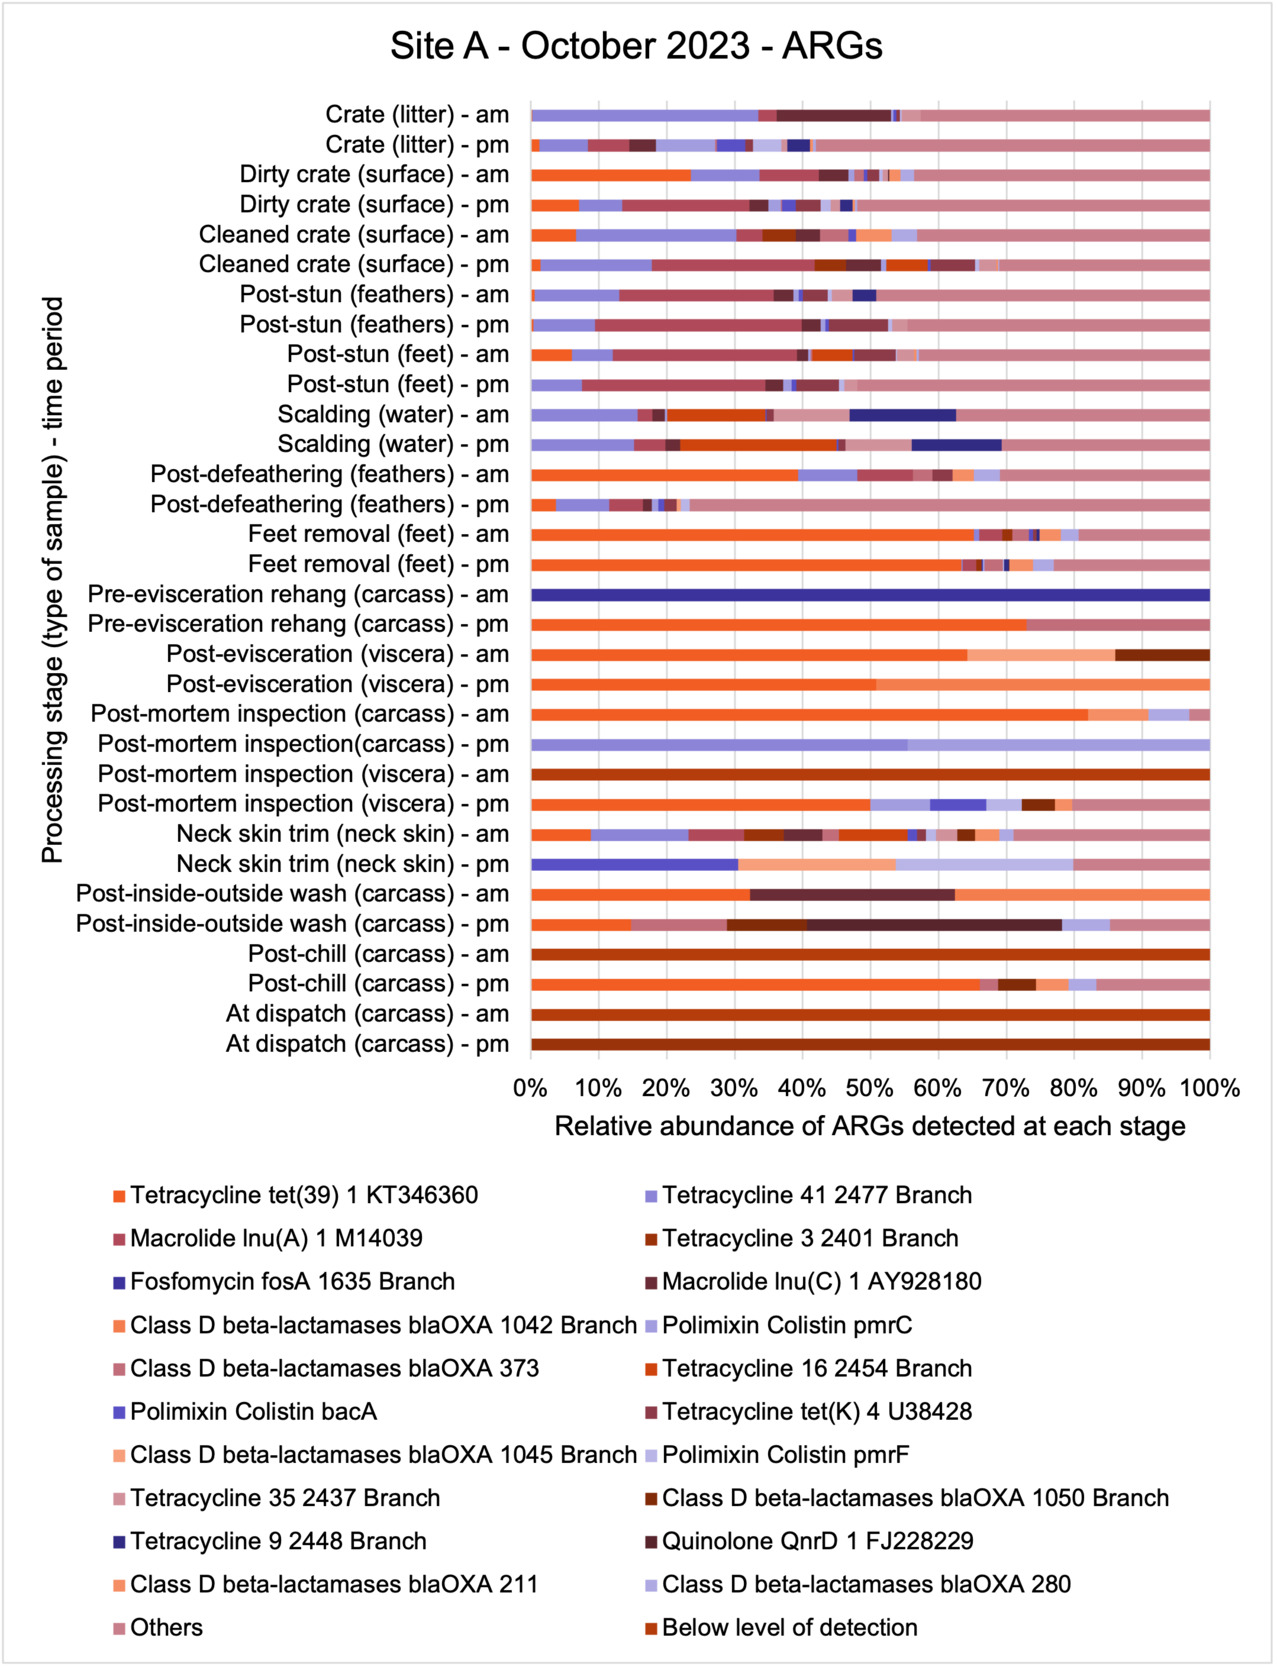
Figure 39.Relative abundance of the 20 most abundant ARGs detected using shotgun metagenomic analysis in samples taken along the process chain at Site A in a visit in October 2023 (legend lists ARGs in order of overall abundance, left to right).

Figure 40.Relative abundance of the 20 most abundant ARGs detected using shotgun metagenomic analysis in samples taken along the process chain at Site B in a visit in March 2023 (legend lists ARGs in order of overall abundance, left to right).
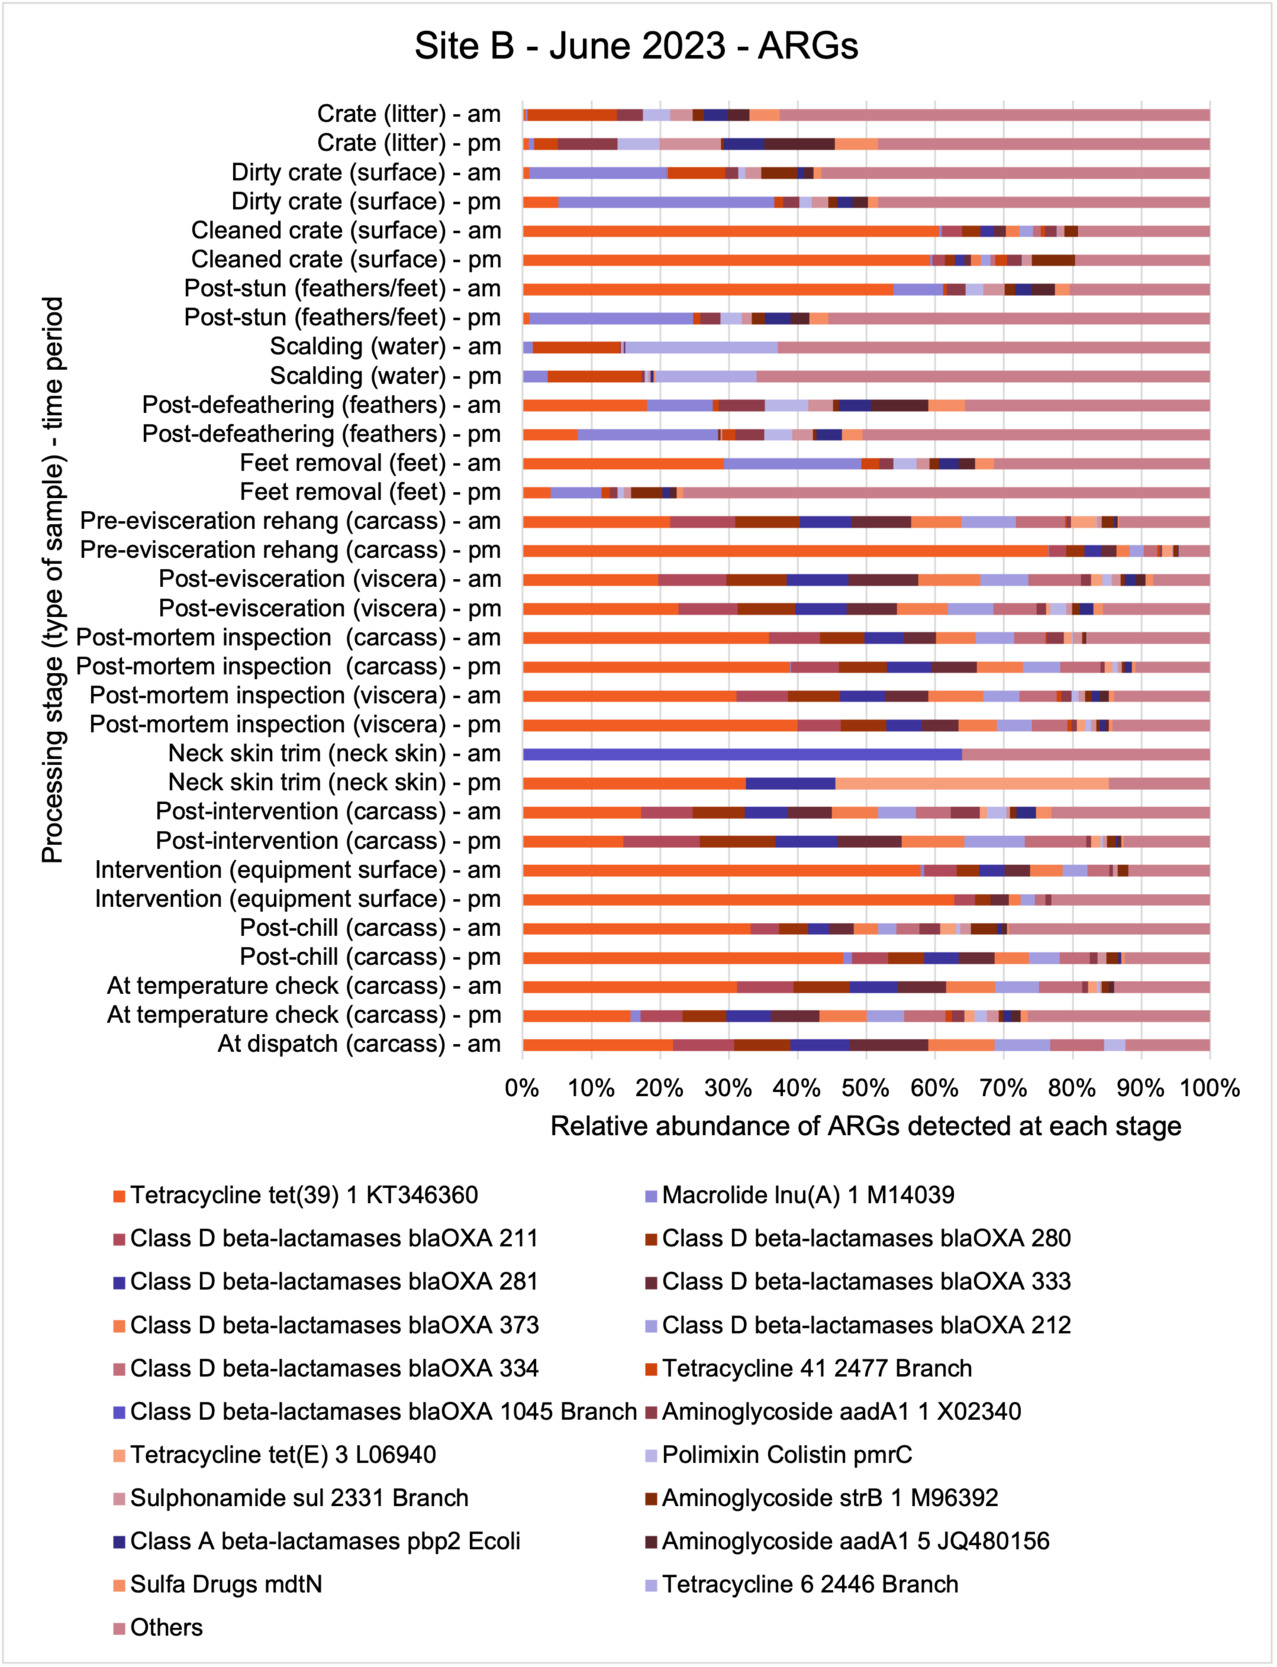
Figure 41.Relative abundance of the 20 most abundant ARGs detected using shotgun metagenomic analysis in samples taken along the process chain at Site B in June 2023 (legend lists ARGs in order of overall abundance, left to right).

Figure 42.Relative abundance of the 20 most abundant ARGs detected using shotgun metagenomic analysis in samples taken along the process chain at Site B in November 2023 (legend lists ARGs in order of overall abundance, left to right).
Of the 442 different ARGs detected in total, there was a slightly greater diversity of ARGs detected over the sampling period at Site B compared to Site A, 354 vs 343, respectively. Of these ARGs, 140 occurred in Site A on all visits and 144 occurred in Site B on all visits, with 103 different ARGs being detected in samples taken from both sites on all visits (Table 35).
A summary of the number of different ARGs detected at the different sampling periods is shown in Figure 39. Although further sampling is required to statistically establish seasonal trends, as with bacterial diversity there did appear to be a seasonal trend in both sites, with a lower diversity (number) of different ARGs being present in samples in both site A and B taken in October/November and March in comparison to those in June 2023.
Table 35.Number of different ARGs detected by shotgun metagenomic analysis in samples taken in visits in March, June, and October or November 2023 at the two sites (A and B).
| Details |
Site A
March |
Site B
March |
Site A
June |
Site B
June |
Site A
Oct |
Site B
Nov |
| Number of different ARGs detected on each visit |
227 |
209 |
267 |
280 |
208 |
230 |
| Number of different ARGs detected at only one sampling point on each visit |
84 |
70 |
101 |
87 |
80 |
86 |
| Number of different ARGs detected at more than 10 sampling points on each visit |
26 |
36 |
34 |
46 |
33 |
37 |
As with the bacterial species, generally the diversity of ARGs detected in the samples collected from the sites appeared to reduce through the processing chain in each site on all of the sampling occasions, particularly post evisceration (Figure 43 and Table 36). The exception was Site B in June, where a high diversity of different ARGs were still detected at post evisceration sampling points.

Figure 43.Diversity of different ARGs detected using shotgun metagenomic analysis in samples taken at the different processing stages during visits in March, June, and October or November 2023 to the two sites (A and B).
Table 36.Number of different ARGs detected using shotgun metagenomic analysis in samples taken in March, June and October or November at the two sites (A and B) at different processing stages (NS represent sampling points where no samples were taken on visit).
| Sampling point |
Site A March |
Site B March |
Site A June |
Site B June |
Site A Oct |
Site B Nov |
| Crate (litter) - am |
68 |
61 |
85 |
66 |
61 |
52 |
| Crate (litter) - pm |
70 |
72 |
58 |
72 |
84 |
51 |
| Dirty crate (surface) - am |
32 |
74 |
55 |
96 |
87 |
58 |
| Dirty crate (surface) - pm |
72 |
69 |
49 |
76 |
77 |
80 |
| Cleaned crate (surface) - am |
84 |
62 |
56 |
50 |
24 |
16 |
| Cleaned crate (surface) - pm |
34 |
55 |
90 |
42 |
46 |
72 |
| Post-stun (feathers/feet) - am |
NS |
NS |
NS |
48 |
NS |
NS |
| Post-stun (feathers/feet) - pm |
NS |
NS |
NS |
48 |
NS |
NS |
| Post-stun (feathers) - am |
90 |
66 |
80 |
NS |
61 |
68 |
| Post-stun (feathers) - pm |
90 |
78 |
92 |
NS |
62 |
89 |
| Post-stun (feet) - am |
77 |
43 |
57 |
NS |
83 |
58 |
| Post-stun (feet) - pm |
83 |
51 |
69 |
NS |
65 |
80 |
| Scalding (water) - am |
39 |
50 |
37 |
47 |
35 |
70 |
| Scalding (water) - pm |
35 |
42 |
38 |
60 |
40 |
50 |
| Post-defeathering (feathers) - am |
9 |
NS |
54 |
61 |
16 |
68 |
| Post-defeathering (feathers) - pm |
77 |
NS |
58 |
69 |
49 |
87 |
| Feet removal (feet) - am |
15 |
19 |
41 |
65 |
32 |
0 |
| Feet removal (feet) - pm |
22 |
NS |
72 |
70 |
56 |
0 |
| Pre-evisceration rehang (carcass) - am |
0 |
39 |
33 |
63 |
1 |
3 |
| Pre-evisceration rehang (carcass) - pm |
8 |
23 |
22 |
38 |
2 |
7 |
| Post-evisceration (viscera) - am |
6 |
11 |
11 |
25 |
3 |
0 |
| Post-evisceration (viscera) - pm |
3 |
1 |
16 |
28 |
2 |
19 |
| Post-mortem inspection (carcass) - am |
21 |
44 |
23 |
42 |
4 |
0 |
| Post-mortem inspection (carcass) - pm |
8 |
22 |
19 |
49 |
2 |
12 |
| Post-mortem inspection (viscera) - am |
11 |
40 |
41 |
42 |
0 |
32 |
| Post-mortem inspection (viscera) - pm |
3 |
0 |
17 |
59 |
9 |
20 |
| Neck skin trim (neck skin) - am |
2 |
NS |
0 |
2 |
28 |
0 |
| Neck skin trim (neck skin) - pm |
1 |
13 |
0 |
4 |
4 |
5 |
| Post-inside-outside wash (carcass) - am |
7 |
32 |
37 |
NS |
3 |
1 |
| Post-inside-outside wash (carcass) - pm |
0 |
38 |
3 |
NS |
7 |
25 |
| Post-Intervention (carcass) - am |
3 |
9 |
NS |
39 |
NS |
0 |
| Post-Intervention (carcass) - pm |
0 |
10 |
NS |
51 |
NS |
30 |
| Intervention (equipment surface) - am |
NS |
15 |
NS |
22 |
NS |
15 |
| Intervention (equipment surface) - pm |
NS |
12 |
NS |
17 |
NS |
34 |
| Post-chill (carcass) - am |
3 |
2 |
5 |
42 |
0 |
0 |
| Post-chill (carcass) - pm |
4 |
0 |
1 |
33 |
9 |
1 |
| At temperature check (carcass) - am |
NS |
9 |
NS |
43 |
NS |
0 |
| At temperature check (carcass) - pm |
NS |
1 |
NS |
43 |
NS |
1 |
| At dispatch (carcass) - am |
1 |
0 |
2 |
14 |
0 |
1 |
| At dispatch (carcass) - pm |
1 |
NS |
1 |
|
1 |
NS |
While a total of 442 different ARGs were detected in all of the samples, only 14 different ARGs were detected at more than 10 sampling points along the processing chain at each site on each month and were also present in samples taken at post-intervention stages in the sites on at least one occasion (Table 37). The most commonly occurring ARGs were for Tetracycline.
Table 37.Proportion of sampling points where ARGs were detected using shotgun metagenomic analysis in samples taken at more than 10 sampling points in March, June, October or November at the two sites and also found to be present in samples taken at post-intervention stages on at least one occasion (highlighted cells = also present in post-intervention samples).
| ARG |
Site A March |
Site B March |
Site A June |
Site B June |
Site A Oct |
Site B Nov |
| Tetracycline tet(39) 1 KT346360 |
14/34 (42%) |
23/33 (70%) |
23/32 (72%) |
30/33 (91%) |
22/32 (69%) |
29/37 (79%) |
| Tetracycline 41 2477 Branch |
26/34 (77%) |
21/33 (64%) |
27/32 (85%) |
20/33 (61%) |
18/32 (57%) |
22/37 (60%) |
| Sulphonamide sul 2331 Branch |
14/34 (42%) |
20/33 (61%) |
21/32 (66%) |
29/33 (88%) |
17/32 (54%) |
18/37 (49%) |
| Aminoglycoside aadA1 1 X02340 |
13/34 (39%) |
17/33 (52%) |
19/32 (60%) |
30/33 (91%) |
14/32 (44%) |
20/37 (55%) |
| Macrolide lnu(C) 1 AY928180 |
19/34 (56%) |
16/33 (49%) |
23/32 (72%) |
19/33 (58%) |
15/32 (47%) |
19/37 (52%) |
| Macrolide lnu(A) 1 M14039 |
15/34 (45%) |
17/33 (52%) |
21/32 (66%) |
19/33 (58%) |
17/32 (54%) |
17/37 (46%) |
| Polimixin Colistin pmrC |
11/34 (33%) |
19/33 (58%) |
18/32 (57%) |
27/33 (82%) |
14/32 (44%) |
17/37 (46%) |
| Polimixin Colistin bacA |
12/34 (36%) |
16/33 (49%) |
15/32 (47%) |
26/33 (79%) |
17/32 (54%) |
16/37 (44%) |
| Class A beta-lactamases pbp2 Ecoli |
10/34 (30%) |
17/33 (52%) |
16/32 (50%) |
26/33 (79%) |
12/32 (38%) |
17/37 (46%) |
| Sulfa Drugs mdtN |
10/34 (30%) |
17/33 (52%) |
16/32 (50%) |
25/33 (76%) |
13/32 (41%) |
17/37 (46%) |
| Aminoglycoside aph(3')-III 1 M26832 |
17/34 (50%) |
14/33 (43%) |
18/32 (57%) |
16/33 (49%) |
15/32 (47%) |
15/37 (41%) |
| Polimixin Colistin pmrF |
11/34 (33%) |
16/33 (49%) |
15/32 (47%) |
24/33 (73%) |
14/32 (44%) |
15/37 (41%) |
| Aminoglycoside aadE 1 KF864551 |
15/34 (45%) |
15/33 (46%) |
19/32 (60%) |
16/33 (49%) |
14/32 (44%) |
15/37 (41%) |
| Aminoglycoside aadD 1 AF181950 |
11/34 (33%) |
11/33 (34%) |
10/32 (32%) |
10/33 (31%) |
13/32 (41%) |
11/37 (30%) |
3.1.8.3. Bacteriophages (phages)
Shotgun metagenomic analysis revealed the occurrence of a total of 758 different phages in all the 201 samples collected along the processing chain in the poultry sites sampled in this project. The number of different phages detected over the sampling period at both sites was similar, 644 and 648 at Sites A and B, respectably, but differed in the type of phages present. 291 different types of phage occurred in Site A on all occasions and 326 different types of phage occurred in Site B on all occasions, with 250 different phages being detected in samples taken from both sites on all occasions.
The relative abundance of the phages detected in samples collected at different processing stages at Site A on visits in March, June, and October are presented in Figure 44, Figure 45, and Figure 46, respectively; and on visits in March, June, and November at Site B in Figure 47, Figure 48, and Figure 49, respectively. The overall most abundant different phages detected at Site A were: Escherichia phage P1, Escherichia phage P694, and Erwinia phage FE44. Whereas the overall most abundant different phages detected at Site B were: Escherichia phage P1, Acinetobacter phage B1251, and Escherichia phage P694.
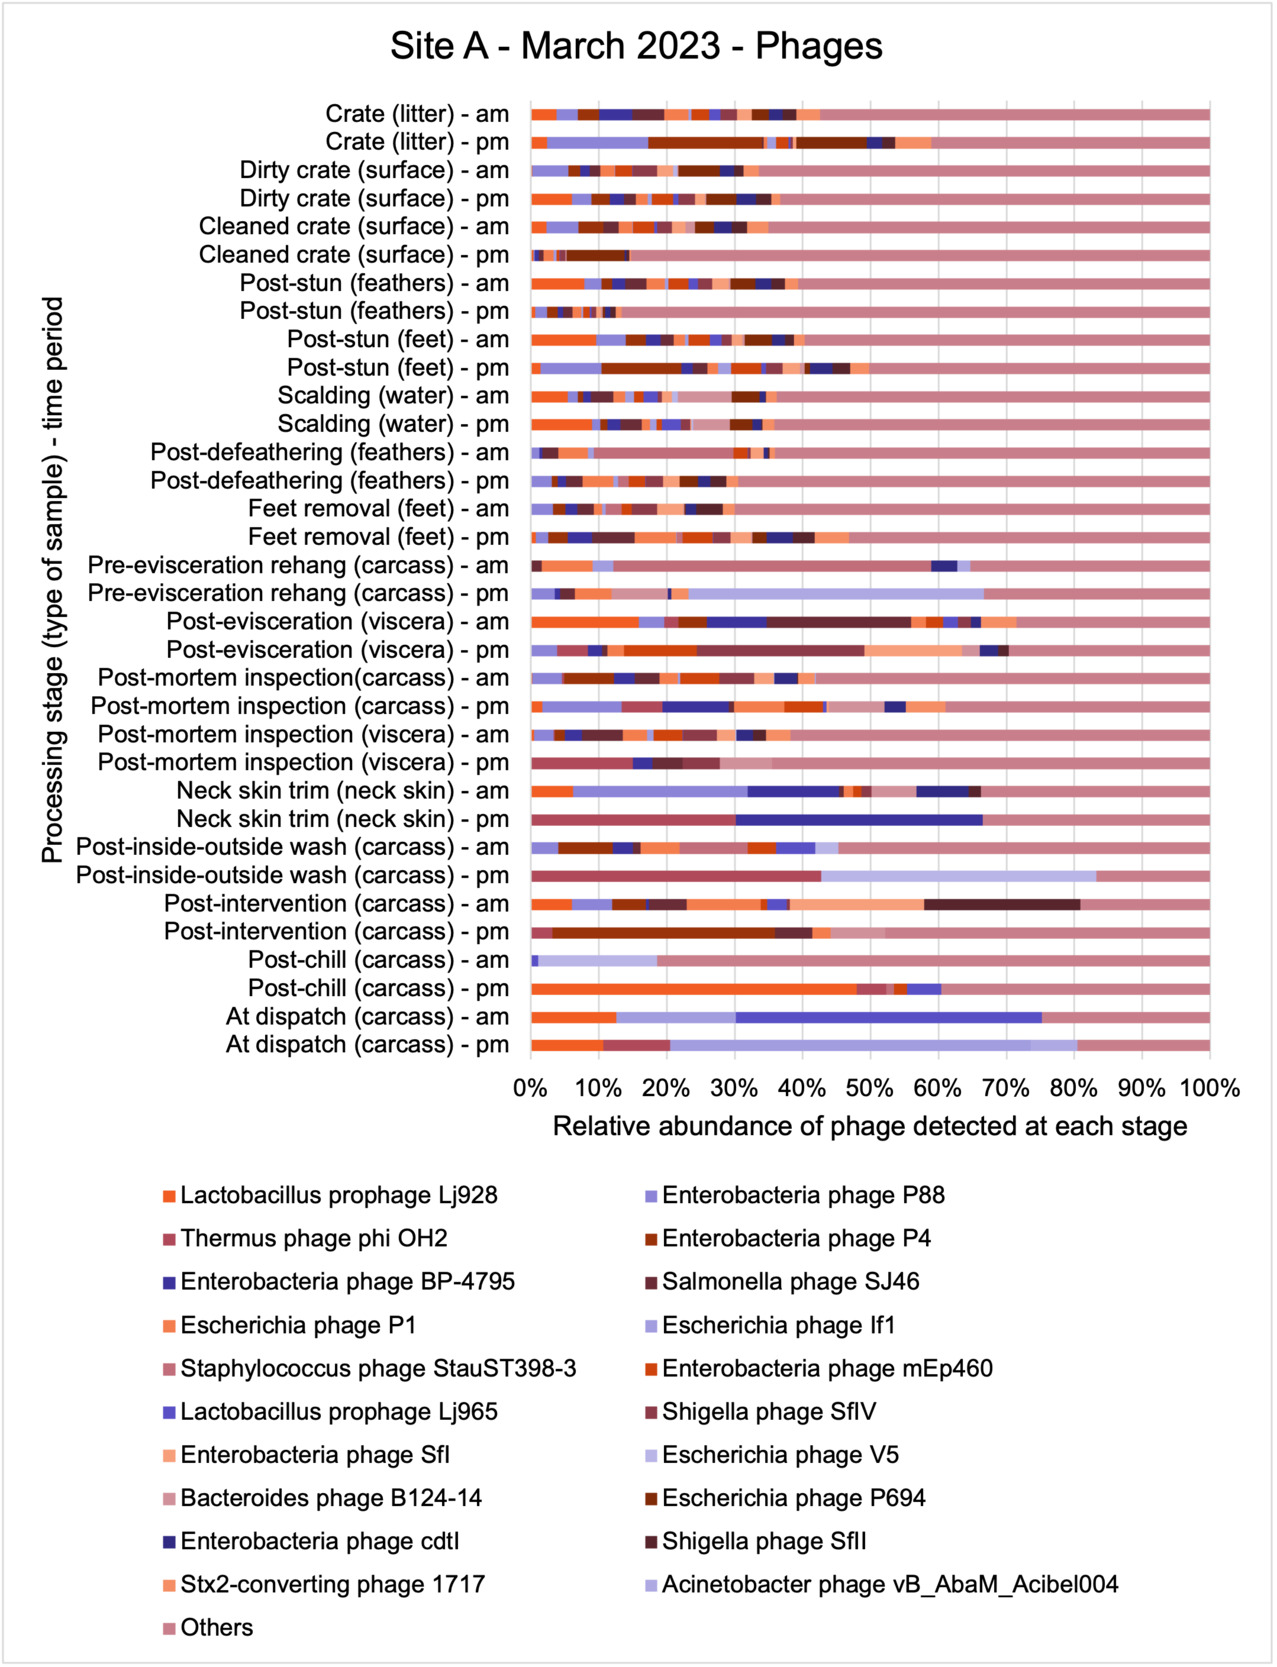
Figure 44.Relative abundance of the 20 most abundant phage detected using shotgun metagenomic analysis in samples taken along the process chain at Site A in a visit in March 2023 (legend lists phage in order of overall abundance, left to right).

Figure 45.Relative abundance of the 20 most abundant phage detected using shotgun metagenomic analysis in samples taken along the process chain at Site A in a visit in June 2023 (legend lists phage in order of overall abundance, left to right).
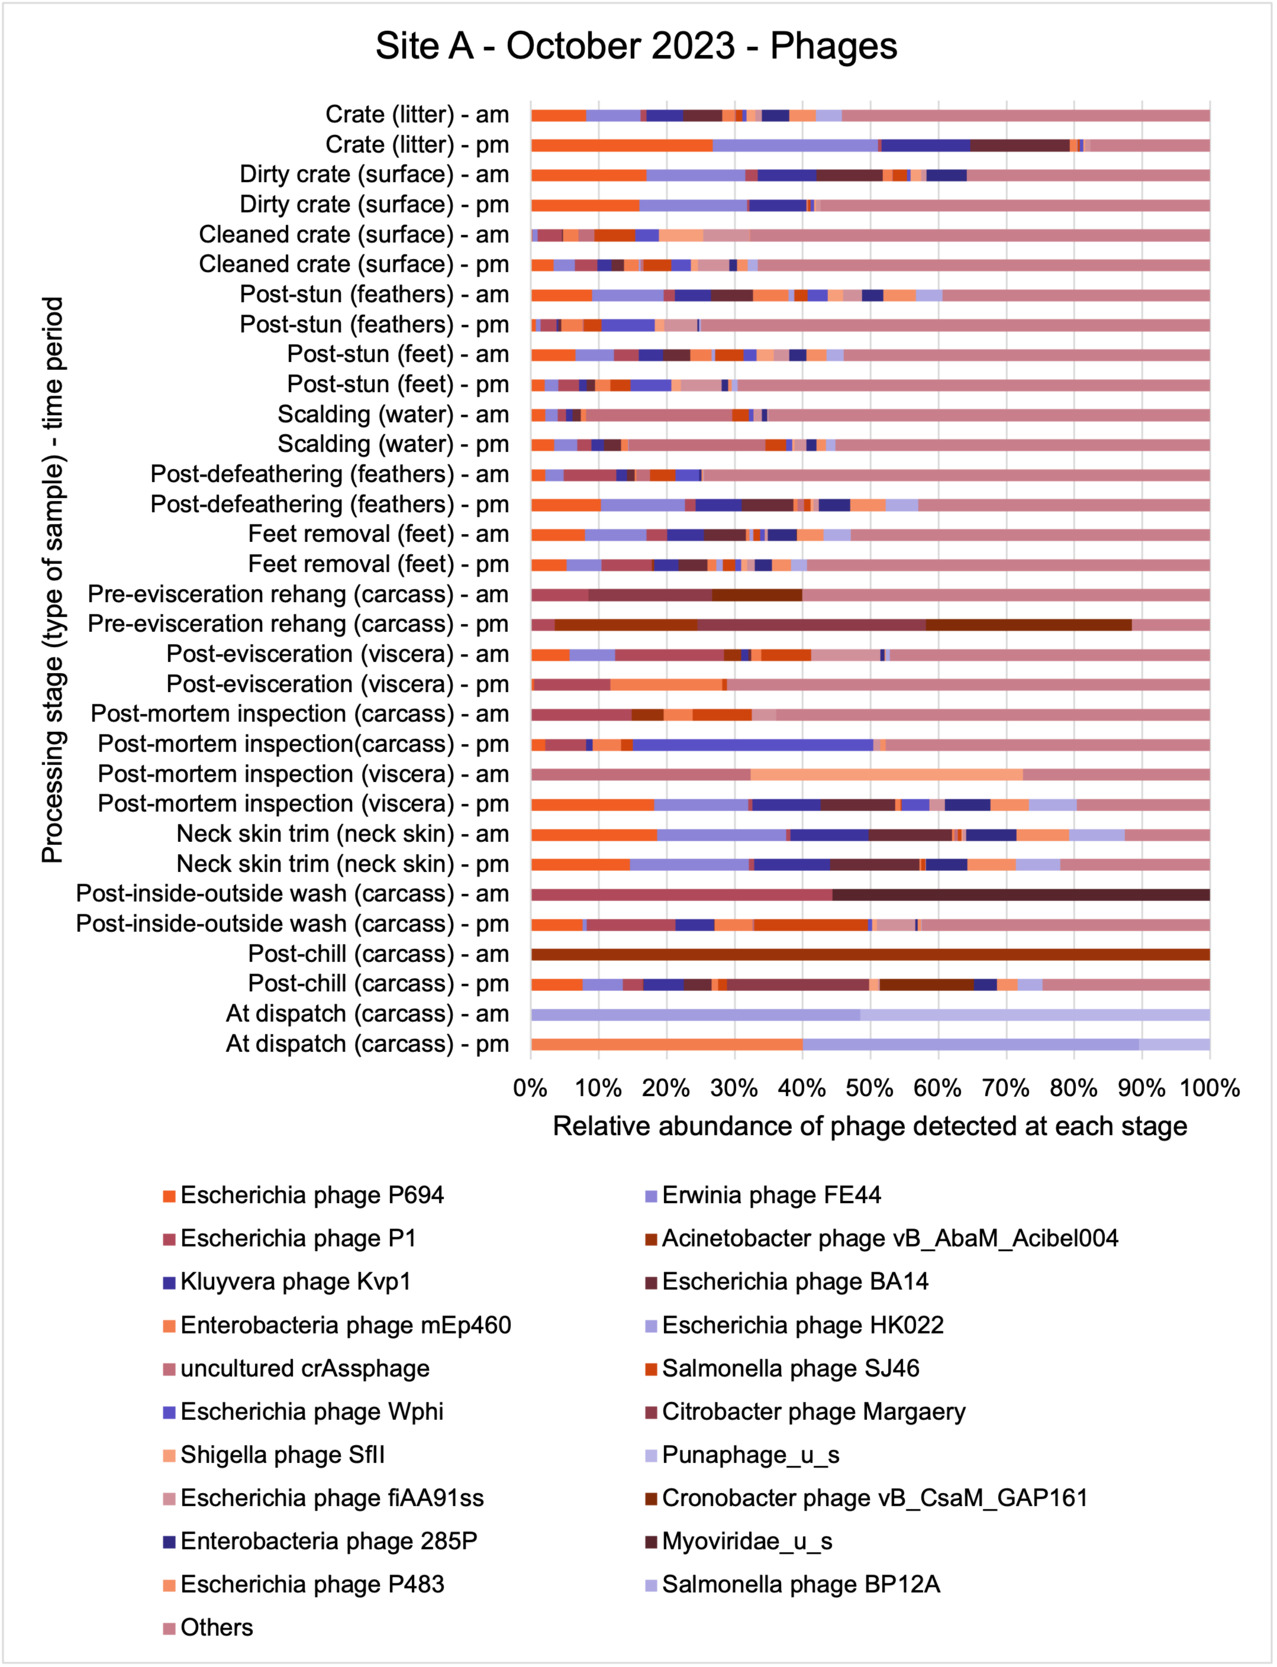
Figure 46.Relative abundance of the 20 most abundant phage detected using shotgun metagenomic analysis in samples taken along the process chain at Site A in a visit in October 2023 (legend lists phage in order of overall abundance, left to right).

Figure 47.Relative abundance of the 20 most abundant phage detected using shotgun metagenomic analysis in samples taken along the process chain at Site B in a visit in March 2023 (legend lists phage in order of overall abundance, left to right).

Figure 48.Relative abundance of the 20 most abundant phage detected using shotgun metagenomic analysis in samples taken along the process chain at Site B in June 2023 (legend lists phage in order of overall abundance, left to right).

Figure 49.Relative abundance of the 20 most abundant phage detected using shotgun metagenomic analysis in samples taken along the process chain at Site B in a visit in November 2023 (legend lists phage in order of overall abundance, left to right).
A summary of the number of different phages detected at the different sampling periods is shown in Table 38.
Table 38.Number of different phages detected using shotgun metagenomic analysis in samples taken in visits in March, June, and October or November 2023 at poultry processing sites A and B.
| Details |
Site A
March |
Site B
March |
Site A
June |
Site B
June |
Site A
Oct |
Site B
Nov |
| Number of different phages detected on each occasion |
452 |
456 |
475 |
508 |
435 |
486 |
| Number of different phages detected at only one sampling point on each occasion |
121 |
155 |
117 |
125 |
121 |
114 |
| Number of different phages detected at more than 10 sampling points on each occasion |
86 |
86 |
112 |
132 |
90 |
116 |
As with the bacteria and ARGs, generally the diversity of phages detected in the samples collected from the sites appeared to reduce through the processing chain in each site on all of the sampling occasions, particularly post evisceration (Figure 50 and Table 39). The exception was Site B in June, where a high diversity of different phages were still detected at post evisceration sampling points.

Figure 50.Diversity of different phages detected using shotgun metagenomic analysis in samples taken in visits in March, June, and October or November 2023 at the two sites (A and B) at the different processing stages.
Table 39.Number of different phages detected using shotgun metagenomic analysis in samples taken in visits in March, June, and October or November 2023 at the two sites (A and B) at different processing stages (NS represent sampling points where no samples were collected on visit).
| Processing stage (type of sample) - time |
Site A March |
Site B March |
Site A June |
Site B June |
Site A Oct |
Site B Nov |
| Crate (litter) - am |
139 |
112 |
192 |
155 |
154 |
182 |
| Crate (litter) - pm |
87 |
111 |
123 |
138 |
127 |
165 |
| Dirty crate (surface) - am |
101 |
137 |
165 |
181 |
209 |
138 |
| Dirty crate (surface) - pm |
168 |
125 |
105 |
157 |
132 |
179 |
| Cleaned crate (surface) - am |
128 |
135 |
148 |
143 |
69 |
90 |
| Cleaned crate (surface) - pm |
107 |
99 |
193 |
94 |
121 |
173 |
| Post-stun (feathers/feet) - am |
NS |
NS |
NS |
122 |
NS |
NS |
| Post-stun (feathers/feet) - pm |
NS |
NS |
NS |
174 |
NS |
NS |
| Post-stun (feathers) - am |
190 |
181 |
152 |
NS |
129 |
152 |
| Post-stun (feathers) - pm |
130 |
135 |
103 |
NS |
118 |
201 |
| Post-stun (feet) - am |
137 |
98 |
138 |
NS |
159 |
153 |
| Post-stun (feet) - pm |
178 |
156 |
144 |
NS |
118 |
198 |
| Scalding (water) - am |
147 |
174 |
160 |
171 |
133 |
177 |
| Scalding (water) - pm |
148 |
174 |
139 |
183 |
156 |
213 |
| Post-defeathering (feathers) - am |
67 |
NS |
166 |
124 |
66 |
157 |
| Post-defeathering (feathers) - pm |
208 |
NS |
149 |
137 |
146 |
183 |
| Feet removal (feet) - am |
81 |
77 |
176 |
143 |
148 |
1 |
| Feet removal (feet) - pm |
102 |
|
208 |
182 |
202 |
5 |
| Pre-evisceration rehang (carcass) - am |
14 |
71 |
97 |
112 |
12 |
9 |
| Pre-evisceration rehang (carcass) - pm |
21 |
68 |
51 |
71 |
13 |
14 |
| Post-evisceration (viscera) - am |
20 |
33 |
83 |
77 |
33 |
2 |
| Post-evisceration (viscera) - pm |
31 |
11 |
24 |
98 |
17 |
107 |
| Post-mortem inspection (carcass) - am |
71 |
76 |
93 |
109 |
30 |
2 |
| Post-mortem inspection (carcass) - pm |
35 |
65 |
29 |
106 |
28 |
56 |
| Post-mortem inspection (viscera) - am |
71 |
78 |
89 |
130 |
4 |
65 |
| Post-mortem inspection (viscera) - pm |
14 |
1 |
33 |
132 |
41 |
56 |
| Neck skin trim (neck skin) - am |
20 |
NS |
16 |
54 |
68 |
2 |
| Neck skin trim (neck skin) - pm |
4 |
45 |
2 |
73 |
65 |
31 |
| Post-inside-outside wash (carcass) - am |
17 |
62 |
95 |
NS |
2 |
7 |
| Post-inside-outside wash (carcass) - pm |
4 |
87 |
29 |
NS |
38 |
82 |
| Post-Intervention (carcass) - am |
25 |
52 |
NS |
133 |
NS |
1 |
| Post-Intervention (carcass) - pm |
8 |
32 |
NS |
119 |
NS |
95 |
| Intervention (equipment surface) - am |
NS |
23 |
NS |
58 |
NS |
62 |
| Intervention (equipment surface) - pm |
NS |
12 |
NS |
20 |
NS |
149 |
| Post-chill (carcass) - am |
22 |
7 |
10 |
68 |
1 |
0 |
| Post-chill (carcass) - pm |
15 |
20 |
23 |
110 |
65 |
11 |
| At temperature check (carcass) - am |
NS |
23 |
NS |
94 |
NS |
0 |
| At temperature check (carcass) - pm |
NS |
6 |
NS |
128 |
NS |
15 |
| At dispatch (carcass) - am |
6 |
2 |
6 |
40 |
2 |
8 |
| At dispatch (carcass) - pm |
6 |
NS |
10 |
NS |
3 |
NS |
While a total of 758 different phages were detected in all of the samples, only 54 different phages were detected at more than 10 sampling points along the processing chain at each site on each month and were also present in samples taken at post-intervention stages in the sites on at least one occasion (Table 40). Of these 13 different phages were detected at more than 10 sampling points, including post intervention, at each site on all occasions. Of these phages, Escherichia phage P1, Salmonella phage SJ46, and Enterobacteria phage mEp460 were detected at the most sampling points. Escherichia phage P1 and Salmonella phage SJ46 were detected in approximately 80% or more of all the samples taken across the processing chain at both sites on all occasions.
Escherichia phage were ubiquitous at both sites, but only one Campylobacter phage, CPt10, was detected. The Campylobacter phage was detected at 2 sampling points in samples taken in November at Site B. Both were feather samples taken at the post-stun (pm) and post-defeathering (pm) stages. The Campylobacter phage CPt10 is known to lyse with C. jejuni and C. coli and has been isolated from UK poultry processing environments (Salama et al., 1989; Timms et al., 2010). Both C. jejuni and C. coli were also detected in these samples.
Table 40.Number of sampling points where a particular phage was detected using shotgun metagenomic analysis in samples taken at different sampling points during processing in two poultry processing sites in visits in March, June, and October or November 2023 (highlighted cells = phage also detected in post-intervention samples).
| Phage |
Site A March |
Site B March |
Site A June |
Site B June |
Site A Oct |
Site B Nov |
| Escherichia phage P1 |
27/34 (80%) |
29/33 (88%) |
29/32 (91%) |
31/33 (94%) |
28/32 (88%) |
30/37 (82%) |
| Salmonella phage SJ46 |
28/34 (83%) |
28/33 (85%) |
28/32 (88%) |
32/33 (97%) |
25/32 (79%) |
26/37 (71%) |
| Enterobacteria phage mEp460 |
25/34 (74%) |
25/33 (76%) |
26/32 (82%) |
32/33 (97%) |
26/32 (82%) |
26/37 (71%) |
| Enterobacteria phage cdtI |
24/34 (71%) |
27/33 (82%) |
26/32 (82%) |
32/33 (97%) |
26/32 (82%) |
23/37 (63%) |
| Enterobacteria phage P88 |
25/34 (74%) |
24/33 (73%) |
25/32 (79%) |
31/33 (94%) |
22/32 (69%) |
24/37 (65%) |
| Enterobacteria phage BP-4795 |
25/34 (74%) |
22/33 (67%) |
25/32 (79%) |
30/33 (91%) |
23/32 (72%) |
24/37 (65%) |
| Shigella phage SfIV |
23/34 (68%) |
23/33 (70%) |
26/32 (82%) |
32/33 (97%) |
22/32 (69%) |
23/37 (63%) |
| Stx2-converting phage 1717 |
21/34 (62%) |
24/33 (73%) |
26/32 (82%) |
31/33 (94%) |
23/32 (72%) |
22/37 (60%) |
| Enterobacteria phage SfV |
23/34 (68%) |
24/33 (73%) |
24/32 (75%) |
31/33 (94%) |
22/32 (69%) |
23/37 (63%) |
| Escherichia phage fiAA91ss |
19/34 (56%) |
23/33 (70%) |
25/32 (79%) |
32/33 (97%) |
24/32 (75%) |
23/37 (63%) |
| Enterobacteria phage SfI |
20/34 (59%) |
23/33 (70%) |
24/32 (75%) |
32/33 (97%) |
22/32 (69%) |
24/37 (65%) |
| Salmonella phage RE-2010 |
21/34 (62%) |
24/33 (73%) |
23/32 (72%) |
31/33 (94%) |
25/32 (79%) |
18/37 (49%) |
| Escherichia phage TL-2011b |
19/34 (56%) |
23/33 (70%) |
25/32 (79%) |
30/33 (91%) |
24/32 (75%) |
21/37 (57%) |
| Shigella phage SfII |
21/34 (62%) |
25/33 (76%) |
24/32 (75%) |
30/33 (91%) |
20/32 (63%) |
22/37 (60%) |
| Enterobacteria phage phiP27 |
23/34 (68%) |
22/33 (67%) |
23/32 (72%) |
30/33 (91%) |
22/32 (69%) |
21/37 (57%) |
| Escherichia phage pro483 |
20/34 (59%) |
23/33 (70%) |
21/32 (66%) |
28/33 (85%) |
22/32 (69%) |
21/37 (57%) |
| Enterobacteria phage P4 |
20/34 (59%) |
22/33 (67%) |
23/32 (72%) |
30/33 (91%) |
20/32 (63%) |
18/37 (49%) |
| Enterobacteria phage YYZ-2008 |
18/34 (53%) |
22/33 (67%) |
23/32 (72%) |
28/33 (85%) |
20/32 (63%) |
21/37 (57%) |
| Escherichia phage If1 |
21/34 (62%) |
23/33 (70%) |
20/32 (63%) |
29/33 (88%) |
18/32 (57%) |
20/37 (55%) |
| Shigella phage Sf6 |
19/34 (56%) |
21/33 (64%) |
22/32 (69%) |
28/33 (85%) |
19/32 (60%) |
21/37 (57%) |
| Salmonella phage SEN22 |
17/34 (50%) |
23/33 (70%) |
20/32 (63%) |
29/33 (88%) |
17/32 (54%) |
23/37 (63%) |
| Lactobacillus phage phiAQ113 |
23/34 (68%) |
21/33 (64%) |
27/32 (85%) |
17/33 (52%) |
16/32 (50%) |
20/37 (55%) |
| Erwinia phage FE44 |
15/34 (45%) |
11/33 (34%) |
23/32 (72%) |
27/33 (82%) |
22/32 (69%) |
25/37 (68%) |
| Stx2-converting phage 86 |
15/34 (45%) |
22/33 (67%) |
19/32 (60%) |
30/33 (91%) |
15/32 (47%) |
18/37 (49%) |
| Kluyvera phage Kvp1 |
13/34 (39%) |
11/33 (34%) |
23/32 (72%) |
24/33 (73%) |
22/32 (69%) |
23/37 (63%) |
| Enterobacteria phage mEp237 |
13/34 (39%) |
20/33 (61%) |
17/32 (54%) |
30/33 (91%) |
18/32 (57%) |
18/37 (49%) |
| Escherichia phage P2 |
16/34 (48%) |
18/33 (55%) |
18/32 (57%) |
25/33 (76%) |
19/32 (60%) |
19/37 (52%) |
| Enterobacteria phage Sf101 |
16/34 (48%) |
21/33 (64%) |
19/32 (60%) |
25/33 (76%) |
15/32 (47%) |
19/37 (52%) |
| Salmonella phage FSLSP004 |
13/34 (39%) |
16/33 (49%) |
20/32 (63%) |
28/33 (85%) |
17/32 (54%) |
20/37 (55%) |
| Enterobacteria phage IME10 |
17/34 (50%) |
14/33 (43%) |
20/32 (63%) |
27/33 (82%) |
17/32 (54%) |
19/37 (52%) |
| Bacteroides phage B124-14 |
21/34 (62%) |
24/33 (73%) |
18/32 (57%) |
15/33 (46%) |
16/32 (50%) |
15/37 (41%) |
| Escherichia phage Wphi |
17/34 (50%) |
17/33 (52%) |
15/32 (47%) |
23/33 (70%) |
18/32 (57%) |
18/37 (49%) |
| Lactobacillus prophage Lj928 |
24/34 (71%) |
16/33 (49%) |
19/32 (60%) |
17/33 (52%) |
16/32 (50%) |
15/37 (41%) |
| Escherichia phage phiV10 |
15/34 (45%) |
17/33 (52%) |
17/32 (54%) |
24/33 (73%) |
13/32 (41%) |
18/37 (49%) |
| Salmonella phage SEN34 |
12/34 (36%) |
15/33 (46%) |
19/32 (60%) |
28/33 (85%) |
10/32 (32%) |
19/37 (52%) |
| Escherichia phage pro147 |
13/34 (39%) |
16/33 (49%) |
16/32 (50%) |
24/33 (73%) |
15/32 (47%) |
17/37 (46%) |
| Lactobacillus prophage Lj965 |
23/34 (68%) |
14/33 (43%) |
20/32 (63%) |
12/33 (37%) |
15/32 (47%) |
17/37 (46%) |
| Salmonella phage vB_SemP_Emek |
16/34 (48%) |
17/33 (52%) |
16/32 (50%) |
21/33 (64%) |
13/32 (41%) |
18/37 (49%) |
| Enterobacteria phage VT2phi_272 |
11/34 (33%) |
16/33 (49%) |
18/32 (57%) |
26/33 (79%) |
12/32 (38%) |
17/37 (46%) |
| Enterobacteria phage HK140 |
11/34 (33%) |
14/33 (43%) |
15/32 (47%) |
27/33 (82%) |
14/32 (44%) |
17/37 (46%) |
| Escherichia phage ECB2 |
11/34 (33%) |
12/33 (37%) |
19/32 (60%) |
20/33 (61%) |
16/32 (50%) |
18/37 (49%) |
| Shigella phage SfMu |
12/34 (36%) |
19/33 (58%) |
20/32 (63%) |
21/33 (64%) |
10/32 (32%) |
13/37 (36%) |
| Bacteroides phage B40-8 |
18/34 (53%) |
19/33 (58%) |
19/32 (60%) |
11/33 (34%) |
11/32 (35%) |
15/37 (41%) |
| Escherichia phage HK106 |
11/34 (33%) |
13/33 (40%) |
15/32 (47%) |
26/33 (79%) |
11/32 (35%) |
16/37 (44%) |
| Escherichia phage HK544 |
12/34 (36%) |
18/33 (55%) |
13/32 (41%) |
22/33 (67%) |
10/32 (32%) |
17/37 (46%) |
| Staphylococcus phage phiRS7 |
15/34 (45%) |
14/33 (43%) |
20/32 (63%) |
13/33 (40%) |
15/32 (47%) |
13/37 (36%) |
| Escherichia phage APEC5 |
16/34 (48%) |
14/33 (43%) |
17/32 (54%) |
13/33 (40%) |
13/32 (41%) |
17/37 (46%) |
| Staphylococcus phage StB20 |
14/34 (42%) |
14/33 (43%) |
15/32 (47%) |
14/33 (43%) |
16/32 (50%) |
13/37 (36%) |
| Salmonella phage HK620 |
16/34 (48%) |
14/33 (43%) |
13/32 (41%) |
16/33 (49%) |
10/32 (32%) |
17/37 (46%) |
| Escherichia phage APEC7 |
14/34 (42%) |
14/33 (43%) |
17/32 (54%) |
11/33 (34%) |
12/32 (38%) |
17/37 (46%) |
| Staphylococcus phage StB20-like |
14/34 (42%) |
13/33 (40%) |
15/32 (47%) |
13/33 (40%) |
15/32 (47%) |
13/37 (36%) |
| Escherichia phage HK633 |
10/34 (30%) |
11/33 (34%) |
10/32 (32%) |
25/33 (76%) |
11/32 (35%) |
16/37 (44%) |
| Streptococcus phage 20617 |
13/34 (39%) |
11/33 (34%) |
15/32 (47%) |
17/33 (52%) |
12/32 (38%) |
14/37 (38%) |
| Escherichia phage G7C |
13/34 (39%) |
13/33 (40%) |
17/32 (54%) |
11/33 (34%) |
11/32 (35%) |
17/37 (46%) |
4. Discussion
4.1. Literature review
Overall, the literature review (see Appendix) found that few studies have focussed on the transmission of AMR bacteria or genes during poultry processing. Studies that have looked at the relationship between AMR on incoming birds and outgoing meat appear to show that AMR and ARGs are related to incoming birds so related to farm drivers rather than contamination occurring from equipment within plant. There is little evidence in the literature on the sequential transmission of AMR (bacteria or genes) during the chicken slaughter process or persistence or transmission of antimicrobial resistant bacteria or ARGs in the processing environment. Few studies have considered the persistence of ARGs in the processing environment and whether they could be a vector or contribute to transmission. But there is some limited evidence of ARGs persisting in processing environments (on equipment and in scald water) that may be a source of cross-contamination during processing. There is also some evidence on role of flock-to-flock contamination during processing on AMR. While many studies (not reviewed here) have determined AMR prevalence in retail poultry, few studies have considered cutting operations and what role they may have on transmission.
Plants outside of Europe often use pre-chill chemical intervention steps not permitted or used in the UK or Europe. No studies appear to have looked at physical interventions, such as steam, on AMR or ARGs that have been implemented and are being used in UK plants, including the plants sampled in this study. In addition, plants outside of Europe also often use immersion (water) chilling (usually in chlorinated water) rather than air chilling which is used in UK plants. Finally, most studies outside of Europe have focussed on Salmonella spp. contamination rather than Campylobacter spp. or commensal gut bacteria that may harbour ARGs.
These insights were used to inform the sampling plan used in this project to ensure that some of these knowledge gaps were covered within this project.
4.2. Field and laboratory sampling and analysis
4.2.1. Sampling sites and poultry supply
The farms supplying chickens to each site varied across the collection periods, in addition this variation was also observed between processing lines at Site B, potentially contributing to differences in AMR profiles observed in this study. The farms that supplied Site A in October were different from those that supplied chickens in March and June, possibly explaining seasonal variations in bacterial loads and AMR patterns. At Site B, while 5-7 farms supplied each processing line during each collection period, one farm consistently supplied chickens across all three collection periods. This consistent supplier might have acted as a stable source of specific bacterial strains or AMR profiles, providing a baseline for comparison with other fluctuating sources. The diversity in farm sources likely contributed to the overall variability in microbial populations and their resistance characteristics observed throughout the study. Other studies have also reported that farm location and management practices significantly influence the prevalence and AMR patterns of poultry bacteria (Mudenda et al., 2023; Sibanda et al., 2018; Taylor et al., 2016). This highlights the importance of considering farm-specific factors when developing strategies to mitigate antimicrobial resistance in poultry production systems.
4.2.2. Presence and levels of Campylobacter and E. coli during chicken processing
The prevalence of Campylobacter spp. and E. coli was varied with ~65% samples positive for Campylobacter spp. and ~96% samples testing positive for E. coli. The analysis of Campylobacter spp. contamination in poultry processing reveals substantial variations across different processing stages, between sites, and across seasons. Crates with litter consistently showed the highest contamination levels, ranging from 2.1 to 4.6 Log10 CFU, compared to clean crates (0.7 to 4.0 Log10 CFU) and dirty crates (0.7 to 3.6 Log10 CFU). Viscera handling and neck skin trim also exhibited consistently higher contamination, with viscera contamination reaching up to 4.0 Log10 CFU at post-evisceration stages. Site B generally demonstrated higher counts than Site A across most processing stages. For instance, in carcass processing, Site B showed contamination levels up to 3.8 Log10 CFU at post-mortem inspection in June, compared to Site A’s maximum of 3.9 Log10 CFU in the same period. Notably, June datasets showed higher contamination levels compared to October or November. This seasonal effect was particularly evident in carcass contamination, where Site A’s post-stun contamination reached 2.9-4.0 Log10 CFU in June but only 0.7-2.6 Log10CFU in October. Similarly, Site B’s post-chill contamination ranged from 0.7 to 3.3 Log10CFU in June, dropping to 0.7-1.7 Log10CFU in November. The prevalence and level of E. coli in this study varied processing stages, sites, and seasons. Crates with litter consistently showed the highest contamination levels similar to the Campylobacter spp. results, with counts ranging from 4.7 to 8.4 Log CFU, compared to clean crates (1.7 to 6.1 Log CFU) and dirty crates (4.1 to 8.4 Log CFU). Viscera handling also demonstrated high contamination levels, reaching up to 8.4 Log CFU at post-evisceration stages. Also, Site B generally showed higher counts than Site A across most processing stages, particularly in June. For instance, in carcass processing, Site B showed contamination levels up to 8.3 Log CFU at post-mortem inspection in June, compared to Site A’s maximum of 8.3 Log CFU in the same period. Notably, June data showed higher contamination levels compared to October or November, indicating a strong seasonal effect. This was particularly evident in carcass contamination, where Site A’s post-stun contamination reached 8.0-8.3 Log CFU in June but only 4.6-4.9 Log CFU in October.
Furthermore, certain interventions showed varying effectiveness between sites and time periods. For example, post-intervention carcass contamination at Site B ranged from 3.0 to 3.3 Log10 CFU in June but consistently measured 0.7 Log10 CFU in November, suggesting potential improvements in intervention efficacy or changes in initial contamination levels. The inside-outside wash stage showed high variability, with Site B ranging from 1.9 to 3.3 Log10 CFU in June and 0.7 to 2.9 Log10 CFU in November, while Site A ranged from 1.3 to 3.5 Log10 CFU in June and consistently measured 0.7 Log10 CFU in October. Scalding water contamination varied from 1.9 to 3.4 Log10 CFU at Site B and 0.7 to 2.8 Log10 CFU at Site A, highlighting the potential for cross-contamination at this early processing stage. These findings emphasise the need for tailored, site-specific approaches to effectively reduce Campylobacter spp. contamination. For E. coli, the effectiveness of interventions varied between sites and time periods. Post-intervention carcass contamination at Site B ranged from 4.0 to 5.2 Log CFU in June but decreased slightly to 4.1 to 4.5 Log CFU in November. Also, the inside-outside wash stage showed high variability, with Site B ranging from 2.8 to 4.1 Log CFU in November, while Site A ranged from 4.3 to 5.0 Log CFU in October. Scalding water contamination varied from 4.1 to 4.5 Log CFU at Site B and 3.0 to 8.3 Log CFU at Site A. The variability in intervention effectiveness suggests that regular monitoring and adjustment of process controls may be necessary to maintain consistent low levels of contamination throughout the year and across different processing facilities.
The finding of our study aligns with existing literature, which notes that while processing stages like scalding and chilling typically reduce pathogen levels for Campylobacter spp. and E. coli, steps like defeathering can negate these reductions, highlighting the importance of validating critical control points within each facility to optimise pathogen reduction strategies (Duffy et al., 2014; Hutchison et al., 2022; Pacholewicz, Swart, et al., 2015). In a study conducted by Duffy et al. (2014), it was observed that scalding and chilling stages typically reduce both Campylobacter spp.and E. coli levels, with reported reductions of 1.8-2.9 log10 CFU/carcass for Campylobacter spp. and 1.3-2.5 log10 CFU/carcass for E. coli. In addition, other similar studies have also observed significant reductions in Campylobacter spp. levels after scalding and chilling steps in both broiler and turkey slaughterhouses (Beterams et al., 2024; Hutchison et al., 2022; Pacholewicz, Swart, et al., 2015). E. coli concentrations in some studies generally followed similar patterns to Campylobacter spp., suggesting its potential as an indicator organism (Duffy et al., 2014; Pacholewicz, Swart, et al., 2015). The consistent differences between sites and seasons suggest that processors should consider both location-specific factors (such as equipment design, processing methods, or local environmental conditions) and seasonal variations when developing and implementing food safety measures.
4.2.3. Phenotypic profiles and genotype predictions of Campylobacter spp. and E. coli isolates
Overall, this study found higher resistance to tetracycline [53%] and ciprofloxacin [26%] in Campylobacter spp. Isolates compared to streptomycin [15%], nalidixic acid [12%] and erythromycin [7%]. This findings are generally in agreement with the UK-VARSS report (UK-VARSS, 2022) that reported very high (66%) resistance to tetracycline and 59% resistance to the ciprofloxacin in C. jejuni in broilers. UK-VARSS, 2022 also reported a lower resistance to erythromycin (2.8%).
The phenotypic susceptibility profile of E. coli varied across different processing stages along the production chain, with no clear correlation between the processing stages and the predicted genetic determinants of antimicrobial resistance. Our results also indicate that at least 46.5% of E. coli showed the lowest levels of susceptibility to ampicillin, tetracycline, ceftazidime, and trimethoprim/sulfamethoxazole.
The majority of AMR surveys on the occurrence of C. jejuni and E. coli in poultry have focused on specific stages across the value chain with many looking at retail poultry. Similar to our observations, Fearnley and Rodgers (2023) who surveyed AMR in E. coli (n=35) on raw fresh chicken meat in UK retail stores in 2022, found that 75% to 100% of the E. coli isolates showed reduced susceptibility to ampicillin, 75% to 90% were less susceptible to tetracycline, and all isolates were less susceptible to cefotaxime and ceftazidime. Fearnley and Rodgers (2023) tested trimethoprim and sulfamethoxazole separately, reporting reduced susceptibility in 61% to 67% of isolates for trimethoprim and 75% to 88% for sulfamethoxazole. It is noteworthy to mention that the study by Fearnley and Rodgers (2023) also considered chicken meat imported from outside the UK. Also, Willis et al. (2022) reported 47.2% of a total of 17 E. coli isolated from battered poultry products on retail sale in the United Kingdom were less susceptible to tetracycline, and all isolates were less susceptible to ampicillin, cefotaxime and ceftazidime.
We observed reduced susceptibility among 11.8 - 32.1% of C. jejuni to streptomycin, ciprofloxacin, nalidixic acid, erythromycin, and tetracycline. In both sampling sites, the phenotypic susceptibility pattern remained consistent between the C. jejuni isolates regardless of the stage of processing from which they were recovered. Fearnley and Rodgers (2023) reported that ciprofloxacin and tetracycline had the most common reduced susceptibility in C. jejuni isolates from raw fresh chicken meat, although they did not test for streptomycin.
Generally, the genotype predictions for AMR to beta-lactams, cotrimoxazole, quinolones, and tetracyclines were consistent with the phenotypic profiles. However, there were some inconsistencies with other drug classes. Specifically, the ResFinder tool failed to detect resistance genes in isolates that displayed phenotypic resistance to cephalosporins, and a similar pattern was observed for macrolides in most sequence types. Conversely, ARGs were detected in several isolates that were not phenotypically resistant. This shows the value of additional work to enhance the prediction of phenotypic AMR from genotype, for example as occurring for Campylobacter spp. and other organisms in the PATH-SAFE Programme.
4.2.4. Genomic diversity of Campylobacter spp. and E. coli
All Campylobacter spp. isolates were identified as C. jejuni, with no other Campylobacter spp. being identified by WGS. The presence of C. jejuni and E. coli STs identified in this study, whether they contained ARGs or were free of them, have been documented over the years in other poultry related studies, except for the novel ST. We cannot definitively state that the C. jejuni and E. coli sequence types observed in this study are directly associated with the specific processing stages they were recovered from. This is because only one of six isolates per stage was selected for genomic sequencing based on the phenotypic resistance profile.
For C. jejuni, STs 21, 262, 5136 and 6175 were detected. ST21, ST262 and ST6175 are all members of the ST21 clonal complex (CC) of closely related sequence types. The ST21-CC is the most common CC in the pubMLST database for the UK (updated 13/08/2024, accessed 15/08/2024), representing 19.8% of accessions to the database. It is the second most common ST isolated from poultry in the UK, representing 11.3% of accessions. ST5136 is part of the ST464 CC, the eighth most common UK CC in pubMLST, both across all sample types and from chicken specifically (3.2% and 3.8% of accessions respectively). Therefore, all identified CCs are consistent with CCs previously identified in UK poultry. ST 6175 was the most prevalent ST, being detected at various sampling points in both sample sites regardless of the sampling period. According to Mughini-Gras et al. (2021) ST 6175 is a poorly documented ST in the literature, but they reported it to be highly prevalent in poultry in an analysis they carried out of C. jejuni/coli isolates from the Netherlands in 2017–2019 from a variety of sources. They also found it to be predominant in isolates from humans. Our study also identified ST 21 as being present, which has been reported to be particularly prevalent in poultry (Mughini-Gras et al., 2021).
Considerably more E. coli STs were isolated than C. jejuni STs, with many STs only found in this study at a maximum of one timepoint at one site (29 out of 36 identified STs). No STs were observed at all six time points, although ST10 was observed at five out of six time points. No clear site or seasonal patterns in ST distribution were seen, except that ST 1841 was observed at both sites sampled at the October/November timepoint, but not at any other time.
Among the E. coli strains, the prevalence of ST10, one of the most persistent ST regardless of sampling site and sampling period, has been observed particularly among broiler chickens in various countries e.g., China, Ghana, Poland, Romania, UK. This ST is known to be a common sequence type found in poultry, often associated with ESBL production (Lim et al., 2015; Liu et al., 2022; Oteo et al., 2009; Randall et al., 2011). Recent studies conducted in UK, have also reported ST 93, 117, 155, 224, 1011, 6446 among others in poultry products (Fearnley & Rodgers, 2023). These similarities could suggest that these STs are persistent in the poultry setting in UK.
Shotgun metagenomic sequencing was performed on 201 samples collected across the processing chain of two poultry processing sites in March, June, and October/November 2023. Overall, this showed a great diversity of bacterial species, ARGs, and phages to be present in both plants and that the diversity in numbers of different bacterial species, ARGs, and phages generally decreased along the processing chain indicating that contamination was progressively reduced on the chicken carcasses as they were processed. Reductions in the diversity of the microbiome through the poultry processing chain have been observed in other studies (Handley et al., 2018; Marmion et al., 2023; Oakley et al., 2013; Rothrock et al., 2016). The association of ARG diversity with taxonomic diversity, suggests that ARGs may be reduced with hygiene/contamination reduction. Further studies are required to confirm whether similar patterns occur in other UK poultry processing plants.
4.2.5.1. Bacterial diversity
The shotgun metagenomic sequencing showed a great diversity of bacterial species in the 201 samples collected along the processing chain in the two poultry sites sampled. The most abundant phyla were Proteobacteria, Firmicutes, and Actinobacteria, which accounted for the majority of detected phyla in all samples. These same phyla have been reported to be the most abundant phyla in poultry in other studies (though not always in the same order) in the US (Handley et al., 2018; Rothrock et al., 2016; Wages et al., 2019), Italy (De Cesare et al., 2018), Australia (S. H. Chen et al., 2020), and Ireland (Marmion et al., 2023).
A total of 1407 different bacterial species (including classifiable and classifiable species) were detected, but only 334 of these species were detected in samples taken from both plants on all occasions. Acinetobacter spp. were the most abundant species at both sites, particularly A. johnsonii, lwoffii, and gandensis, and were detected in samples from sampling points along the whole process chain (from entry to dispatch) in both sites. It is not known whether any of these Acinetobacter spp. were antimicrobial resistant. Infections caused by antimicrobial resistant Acinetobacter spp. are a known clinical risk (Hamouda et al., 2008). Foods of animal origin have been postulated as a vector for human infection with antimicrobial resistant strains of Acinetobacter (Carvalheira et al., 2017), but studies are limited and there is some evidence that human and animal isolates may differ (Hamouda et al., 2008). Acinetobacter spp. have been identified as relatively abundant in poultry in studies in Portugal (Carvalheira et al., 2017), Italy (De Cesare et al., 2018), the US (Hinton et al., 2004; Li et al., 2020; Oakley et al., 2013).
To our knowledge, few studies appear to have reported on the prevalence of B. pullorum in poultry, it has been reported to be prevalent in the cecum of laying hens surveyed in Ireland (Corrigan et al., 2023).
Other studies of poultry processing have reported Pseudomonas spp. to be prevalent through the processing chain (Handley et al., 2018; Hinton et al., 2004; Oakley et al., 2013; Wages et al., 2019). While present, Pseudomonas spp. were not that abundant or prevalent in samples from the two sites we studied. US studies by Handley et al. (2018) and Wages et al. (2019) also identified Chryseobacterium spp. as a potential indicator organism in poultry processing as they isolated them from 3 processing plants at multiple sampling locations. Our study did not detect this species as being very abundant or prevalent in the two UK sites we studied.
4.2.5.2. ARG diversity
The most abundant and commonly occurring class of ARGs in both plant A and B were tetracycline resistant genes. Since tetracycline is widely used in animal production this is not surprising. The overall most abundant ARGs detected from samples at both sites were: Tetracycline GENE tet(39) 1 KT346360, Tetracycline 41 2477 Branch, and Macrolide GENE lnu(A) 1 M14039.
Tet(39) is a tetracycline efflux pump found in Gram-negative bacteria, including Brevundimonas, Stenotrophomonas, Enterobacter, Alcaligenes, Acinetobacter, and Providencia spp. (The Comprehensive Antibiotic Resistance Database). Since Acinetobacter spp. were prevalent in the samples it is likely that they are a source for this gene, particularly A. johnsonii which has been reported to host this gene (The Comprehensive Antibiotic Resistance Database), but further studies are needed to confirm this.
Tetracycline 41 2477 Branch is a higher-level node/branch that represents individual AMR gene allele sequences or leaves. Tetracycline 41 2477 Branch contains Tetracycline GENE tet(W) 6 FN396364 and Tetracyclines DOXYCYCLINE MINOCYCLINE HCL GENE tetW, thus is an AMR allele homologous to the tet(W) gene (Personal communication from Cosmos). The gene encodes a ribosomal protection protein and known to provide tetracycline resistance to a wide range of anaerobic intestinal bacteria [The Comprehensive Antibiotic Resistance Database; Ammor et al. (2008)]. This gene was both abundant at both sites and detected in samples from many different sampling points. Further studies are required to confirm the host and any role it may have in foodborne AMR.
The lnu(A) gene (The Comprehensive Antibiotic Resistance Database), coding for macrolide and lincomycin resistance, has been described in several gram-negative and positive bacteria species of poultry origin, such as Clostridium spp., Campylobacter spp., Salmonella spp., and lactobacilli (Cauwerts et al., 2006; Farooq et al., 2022). Lactobacilli (particularly L. gallinarum and L. johnsonii) were abundant and found in samples taken along the process chain in both plants in our study. Further studies are required to confirm the sources of the genes detected in this study and to confirm whether similar patterns occur in other UK poultry processing plants.
4.2.5.3. Bacteriophage (phage) diversity
Phages are ubiquitous in the environment (Hassan et al., 2021), and a high diversity of different phages were detected in the samples. While many studies have looked at phages as a natural control for food pathogens in poultry, there is little information in the literature on the occurrence and role of naturally occurring phages during poultry processing and on the phages detected in this project in a poultry context. There is some evidence that some phages may play a role in the transfer of genes (including ARGs) between bacteria (Hassan et al., 2021), though as highlighted by Colavecchio et al. (2017), there is considerable debate on their importance in natural environments.
The most abundant and commonly occurring phage in both plants, P1, was a transducing phage. This phage is known to be both a reservoir and vector for horizontal gene transfer (HGT) that can infect E. coli and to transduce genes to bacteria other than E. coli (Riquelme et al., 2019). It has been identified as a potential vehicle for the spread and maintenance of virulence genes and ARGs in both clinical and livestock production settings (Venturini et al., 2019; M. Wang et al., 2022).
Escherichia phage P694 (the second and third most abundant phage in samples from Sites A and B, respectively) has been isolated from duck faeces in China (M. Chen et al., 2016) and reported to lyse avian pathogenic E. coli strain DE069. We have found no other literature identifying other hosts. The phage has been reported to be relatively sensitive to heat, not surviving a treatment of 65°C for 30 min. The scalding treatments used at Sites A and B are unlikely to deactivate it as the temperatures and times used to scald are too low and short, but the thermal interventions used at both plants may affect survival. However, this phage was detected in post intervention samples at both plants on a number of visits. It was detected at Site A post-intervention in October and at Site B post-intervention in June and November.
We have found no relevant data on Erwinia phage FE44. Acinetobacter phage B1251, the second most abundant phage at Site B, has been reported to lyse Acinetobacter baumannii (Jeon et al., 2012). A. baumannii was detected in samples from both sites on all sampling periods. It was detected in samples from post-intervention processing stages at Site A on all sampling months and was the seventeenth most abundant classifiable bacterial species detected at this site. A. baumannii causes infections in hospitals, and antimicrobial resistant A. baumannii has been reported, but data is limited regarding the role of A. baumannii in foods.
The detection of Salmonella phage SJ46 in majority of samples supports speculation in the literature that SJ46 is related to P1 and SJ46 may have a broader host range and also target E. coli (Gabashvili et al., 2020; Strange et al., 2021). There is also evidence that SJ46 may serve as a vector for the transfer of blaCTX-M ARGs that code for B-Lactamase resistance (Gabashvili et al., 2020; Hassan et al., 2021). Enterobacteria phage mEp460, also detected in a majority of samples, infects E. coli, and has been reported to have a possible role in the transfer of virulence genes to other bacteria in the chicken gut microbiome (Oladeinde et al., 2019). Only one Campylobacter phage was detected (in November at Site B). This phage, CPt10, is known to lyse C. jejuni and C. coli and has been isolated previously from UK poultry processing environments (Salama et al., 1989; Timms et al., 2010).
5. Conclusion and recommendations
The approach of traditional culture combined with genomic analysis allowed us to provide a detailed map of potential contamination events in the process chain of a working poultry environment. We were able to conclude that the target organisms were readily recovered from the process chain at early stages but following several hygienic contamination reduction practices in general the ability to recover Campylobacter spp. and E. coli was reduced. Moreover, parallel sampling for genomic analysis showed early-stage extensive bacterial diversity which was concordant with associated ARG diversity and their reduction through the processing chain suggests that ARGs along with their host bacteria may also be reduced by hygienic contamination reduction practices, rather than ARGs persisting in particular resilient bacteria throughout.
This study (in common with others) shows that shotgun metagenomic sequencing is a suitable approach to investigate how the microbiome composition and diversity changes during processing and provide insights not provided by traditional microbiological analysis. However, such approaches also result in large data sets which must be analysed and interpreted.
The association of ARG diversity with taxonomic diversity observed in the shotgun metagenomics results suggests that ARGs may be reduced with hygiene/contamination reduction, rather than ARGs persisting in particular, resilient taxa.
This study detected the prevalence of phages associated with the transduction of genes (including ARGs) which could in theory play a role in the transfer of ARGs within the poultry microbiome. Whether such transfer takes place, and whether it is significant, not only in the poultry microbiome but also in other food animal microbiomes is unknown. Further work to investigate and quantify the risk associated with the possible phage-mediated transfer of such ARGs may be worthwhile.
It should be stressed that these findings are only based on samples from two poultry processing sites. Further studies are needed to clarify if the microbiome composition and changes in diversity observed in the two UK poultry plants investigated in this study are representative of other UK-wide poultry plants. It is vital that future work focuses on elucidating the processing variables that have the greatest influence on these microbiomes, thus allowing for eventual targeted interventions to better manage these microbial populations to benefit environmental and public health.
Appendix
1. Systematic literature review
The purpose of the literature review was to aid the project sampling plan/design.
1.1. Method
A systematic review approach was taken to the literature search (Figure A1). Because of the paucity of specific published studies on this topic a narrative critical review approach was taken to the review of the publications identified.
The review questions were:
-
“Are antimicrobial resistant bacteria, or genetic materials that could give rise to antimicrobial resistant bacteria, transmitted during the processing of chicken meat?”
-
“Does the use of antimicrobials in chicken production and processing impact on the transmission of antimicrobial resistant bacteria, or genetic materials that could give rise to antimicrobial resistant bacteria, during the processing of chicken meat?”
The review adopted a comprehensive search strategy considering all available evidence in the public domain, including peer-reviewed articles, grey literature (e.g., government and industry reports), relevant government reports (e.g., FSA published studies, ACMSF reports), European and International literature (e.g., the EFSA Scientific Opinions, WHO reports) up to December 2022. This included previously published systematic and critical reviews, and risk assessments, as well as primary research.
The primary source databases searched were Web of Science, Scopus, and MEDLINE. The searches were restricted to records published from January 1990 to December 2022. Finalised keywords were agreed with the Agency and were:
For the first question:
“antimicrobial resistance” OR “antimicrobial resistant” OR “antibiotic resistance” OR “antibiotic resistant” OR “drug resistant” OR “drug resistance” OR “multidrug resistant” OR “multidrug resistance” OR “multi resistance” OR “multi resistant” OR “ABR” OR “AMR” OR “MDR” OR “MAR” OR “AMRG”
AND
“processing” OR “slaughter” OR “bleeding” OR “scalding” OR “defeathering” OR “evisceration” OR “inside-outside wash*” OR “dressing” OR “chilling” OR “deboning” OR “cutting” OR “abattoir” OR “slaughterhouse”
AND
“chicken” OR “broiler” OR “poultry”
For the second question:
“co-selection” OR “antimicrobial resistance” OR “antimicrobial resistant” OR “antibiotic resistance” OR “antibiotic resistant” OR “drug resistant” OR “drug resistance” OR “multidrug resistant” OR “multidrug resistance” OR “multi resistance” OR “multi resistant” OR “ABR” OR “AMR” OR “MDR” OR “MAR” OR “AMRG”
AND
“treatment*” OR “antiseptic” OR “biocide*” OR “disinfectant*” OR “sanitizer*” OR “sanitiser*” OR “intervention” OR “decontamination”
AND
“chicken” OR “broiler” OR “poultry”
Focused Google searches were used to identify relevant grey literature.
For the first search, a total of 1435 citations were initially identified in Web of Science, 969 were identified in Scopus and 895 were identified in MEDLINE. For the second search, a total 1562 citations were initially identified in Web of Science, 1703 were identified in Scopus and 1161 were identified in MEDLINE. There was considerable overlap between the databases with 3955 duplicates. For all searches, citations and abstracts were uploaded from each of the electronic databases into Covidence (an online tool for systematic reviewing). The following exclusion criteria were applied:
-
They contained no relevant data on processing steps or antimicrobials used in chicken production and processing on the development of AMR.
-
Measured irrelevant population (viruses, fungi, and parasites), interventions (biocide not used in chicken production [for example, healthcare]; used for their surfactant properties, antimicrobial peptides [for instance, bacteriocins]; outcomes (did not include impact on AMR bacteria or genes).
-
Were in a language other than English.
The criteria were independently applied to the abstract of each paper by at least two members of the five-member project team. For each citation, a consensus was reached that the citation is relevant for inclusion. Arbitration by a third member of the project team was used to settle conflicting appraisals. 3,760 abstracts were screened, and 3,524 references excluded. Full texts were obtained for all abstracts that passed the inclusion criteria.
A total of 235 publications were considered relevant by title and abstract and full texts collected for second screening. This number was reduced to 99 publications, with 136 references being excluded because they were not relevant. Of the 99 selected publications 45 publications covered aspects of AMR transfer during processing from which some data were extracted.

Figure A1.Flow diagram of the selection and exclusion of articles related to the scope of the literature review.
1.2. Results
The literature review found that studies have revealed not only frequent abundance of antimicrobial resistant bacteria and ARGs along the slaughter line but also some variability in these ARGs, emphasising the importance of good hygiene during processing (Koutsoumanis et al., 2021). The changing microbiome of poultry meat demonstrating the impact of stages from farm to fork has been covered in many reviews including Marmion et al. (2021). However, no review was found that addressed the transmission of AMR or ARGs throughout the poultry chain, particularly within the processing plant.
The following is a summary of the key findings extracted from the articles (in author alphabetical order) identified in the literature search as relevant to the transmission of AMR during poultry processing. Since there are important differences between poultry processes in different countries the country where a study took place has been recorded.
Agostinho Davanzo et al. (2021) characterised antimicrobial resistant strains of Salmonella spp. and L. monocytogenes from poultry slaughterhouses in Brazil but did not look at any effect of processing stages on transmission (no details on plant size or throughput were provided).
Al-Zenki et al. (2007) looked at the prevalence and AMR of Salmonella in poultry farm and plant environments in Kuwait but did not look at any effect of processing stages on transmission (no details on plant size or throughput were provided).
A study in China by Bai et al. (2021) reported a decreased prevalence of C. jejuni and C. coli along the slaughtering process, from early processing steps. Although they identified antimicrobial resistant isolates of these organisms (against 12 antimicrobial agents) and analysed the ARGs present, they did not look at the prevalence of antimicrobial resistant isolates or ARGs at different processing stages. As well as sampling carcasses, environmental samples (mainly water) were taken at different processing stages. The highest resistance rate was against sulfamethoxazole. Eleven virulence-associated genes (cadF, cdtA, cdtB, ciaB, flaA, imaA, dnaJ, plaA, virB11, racR, and cdtC) were detected by PCR analysis. No details on plant size or throughput were provided.
A US study (Bailey et al., 2019) compared the prevalence and AMR of Campylobacter spp. from organic and conventionally produced broilers raised without antimicrobial drugs (though coccidiostats were used in conventionally raised birds). No details on plant size or throughput were provided. The study looked at levels and prevalence of Campylobacter spp. at different processing stages (on carcasses and environment). A downward trend in levels and prevalence of Campylobacter spp. was observed from early processing steps to post-chill. The prevalence and AMR pattern of Campylobacter spp. from organic and conventionally produced broilers raised without antimicrobial drugs is shown in
Table A1.Prevalence and antimicrobial resistance of Campylobacter spp. from organic and conventionally produced broilers raised without antibiotics (adapted from Bailey et al., 2019).
| Weeks |
Method of production |
Environmental location |
Resistance pattern |
| 11 |
Organic |
Swab, vent gun |
Clindamycin, Nalidixic acid, Tetracycline |
| 12 |
Conventional |
Post-pick (pluck) |
Azithromycin, Ciprofloxacin, Clindamycin, Florfenicol, Nalidixic acid |
| 12 |
Conventional |
Faecal grab |
Azithromycin, Ciprofloxacin, Clindamycin, Florfenicol, Nalidixic acid |
| 16 |
Conventional |
Water, stunner |
Clindamycin, Florfenicol, Gentamicin, Nalidixic acid, Telithromycin, Tetracycline |
| 19 |
Organic |
Post-pick (pluck) |
Azithromycin, Ciprofloxacin, Clindamycin, Clindamycin, Erythromycin, Florfenicol, Nalidixic acid, Telithromycin, Tetracycline |
| 19 |
Organic |
Post pick (pluck) |
Azithromycin, Clindamycin, Erythromycin, Telithromycin |
| 8 |
Conventional |
Air, scald/pick (pluck) room |
Azithromycin, Clindamycin, Erythromycin, Telithromycin |
| 8 |
Conventional |
Air, scald/pick (pluck) room |
Azithromycin, Clindamycin, Erythromycin, Telithromycin |
| 8 |
Conventional |
Post pick (pluck) |
Azithromycin, Clindamycin, Erythromycin, Telithromycin |
| 8 |
Conventional |
Post-immersion chill |
Erythromycin, Telithromycin, Tetracycline |
| 18 |
Conventional |
Gloves, air chill rehang |
Erythromycin, Gentamicin, Tetracycline |
| 11 |
Organic |
Swab, vent gun |
Clindamycin, Nalidixic acid, Tetracycline |
The authors concluded that as there was no major difference in AMR between isolates from organic and conventional birds treated with nicarbazin and zoalene. This indicated that use of ionophores as anti-coccidia measures may not select for co-resistance to any of the antimicrobials tested. Overall, the study suggests that raising birds without the use of antimicrobials may not be effective in reducing the incidence of antimicrobial resistant Campylobacter spp. in chicken. However, the team reported separately (Bailey et al., 2020) that this may not be the case for antimicrobial resistant Salmonella spp., where a low prevalence of antimicrobial resistant Salmonella spp. was observed in both groups of broilers, though no data on AMR transmission at processing stages of Salmonella spp. was reported.
A study conducted in the US (Barnhart & Pancorbo, 1992) examined the transmission and AMR of Aeromonas hydrophila isolated from broiler carcasses and chill water (immersion chilling) at various processing stages. The researchers found that 46.2% of the A. hydrophila isolates tested exhibited AMR, with the majority showing resistance to ampicillin and cephalothin. Notably, the highest percentage of antimicrobial resistant isolates (70.6%) was recovered from carcasses sampled immediately after evisceration. No details on plant size or throughput were provided.
Berrang et al. (2008), a US study, compared the effect of chilling method (air or water immersion) on Campylobacter spp. on broiler carcasses in a simulated pilot-scale study. Although the resistance of the isolates were measured, no resistant C. jejuni isolates were found and the number of antimicrobial resistant C. coli isolates was very small and there is insufficient evidence to make any conclusions regarding the effect of chilling method on AMR transmission from this study. Air chilling is the standard method used to chill chicken carcasses in the UK, whereas water immersion is more common in the US.
A further study by Berrang et al. (2009) studied the prevalence and AMR of Salmonella spp. isolated from broiler carcasses post-defeathering (pick) and post-chill in 20 plants (no details on size or throughput of these plants were provided). Overall, the prevalence of Salmonella spp. reduced from 72% post-defeathering to 20% post-chill, with antimicrobial resistant isolates being detected post-chill. However, no clear resistance profile at these stages was reported or compared, and many of the plants used different chemical processing aids to reduce microbial contamination of the carcasses pre-chill, and three used chlorine post-chill. Immersion chilling was used by all plants.
Bertolatti et al. (2003), an Australian study, determined the prevalence of antimicrobial resistant S. aureus in two poultry processing plants, and characterised the isolates by antimicrobial susceptibility and chromosomal and plasmid DNA analysis. Overall, there were no consistent resistance patterns for the isolates, and no consistent patterns were found between and within the two processing plants. Some isolates had similar plasmid profiles and resistance patterns. While samples were taken at various points during the processing the study did not compare resistance patterns or prevalence at different stages in the two plants, and no detail of the size or throughputs of the plants were provided.
A Thai study of “small-scale poultry plants” (unfortunately not defined by the authors), by Chotinum et al. (2014), studied prevalence and antimicrobial resistance of Salmonella spp. isolated from carcasses and processing facilities but did not link any prevalence of Salmonella spp. at different sampling points with any pattern of resistance.
Da Costa et al. (2006), a Portuguese study, investigated antimicrobial resistant Enterococcus spp. isolated from wastewater and sludge of eight poultry processing plants, but did not look at the role of processing stages on transmission. The only comparison was in throughput (which ranged from 10,000 birds per day to 60,000 birds per day) and differences in waste treatment. Waste treatments reduced but did not eliminate the discharge of antimicrobial resistant enterococci into receiving waters.
One of the studies to provide data on AMR and genomic diversity of C. jejuni from broilers during processing was conducted in Ireland (Emanowicz et al., 2022). The research focused on a large processing plant, though specific throughput details were not provided. Samples were collected from 32 batches of poultry at various stages of processing, including after evisceration, final wash, and carcass chilling. The researchers obtained both broiler caeca and neck skin samples to assess C. jejuni prevalence and characteristics throughout the processing chain. The aim of the study was to:
-
determine the prevalence of AMR in C. jejuni isolates
-
investigate if C. jejuni strains with particular resistance profiles were more frequently recovered at the end of processing,
-
establish if multiple strains with different resistance profiles were present within individual batches of broilers and
-
determine the virulence profiles of isolates.
Results showed that resistance to tetracycline was most prevalent (46%), followed by resistance to ciprofloxacin and nalidixic acid (29%). All isolates were susceptible to erythromycin and gentamicin, while resistance to streptomycin was low (2%). Resistance genes identified included the tet(O) gene, tet(O/32/O) gene, gyrA p.T86I mutation and blaOXA-61 like genes. A number of virulence factors and survival associated genes which might have a role in Campylobacter spp. survival and environmental adaptation during key processing stages were detected. The average prevalence of these genes was highest in isolates from neck skin samples collected after carcass chilling, as were sequence types of C. jejuni associated with AMR, suggesting that more resistant strains might persist throughout the processing environment and these genes might have a role in survival of C. jejuni in unfavourable conditions.
Gregova et al. (2012), a Slovakian study, was the only study identified in the literature search to have investigated airborne contamination of antimicrobial resistant bacteria, in this case E. coli, in a processing plant. Equipment surface swabs and aerosols were sampled in the: shackling, killing, eviscerating, packing, and portioning areas of the plant. The highest levels of air coliforms occurred during shackling, killing and evisceration. E. coli isolates were resistant only to ampicillin, tetracycline, or enrofloxacin, however, E. coli with ESBLs and associated with resistance to quinolones (nalidixic acid, ciprofloxacin and enrofloxacin), streptomycin, tetracycline and cotrimoxazol were isolated from surface swabs taken throughout the plant. No details of the size or throughput of the plant were provided.
A Chinese study (Gu et al., 2020) determined the prevalence, AMR, and genetic characteristics of Salmonella spp. at different processing stages in a plant. Throughout the process, Salmonella spp. contamination gradually increased from the scalding and defeathering stage (17.5%) to the portioning/cutting stage (70%). But while the ARG profiles of the isolates were determined, and phenotypes were consistent with the presence of the corresponding ARGs, the study did not report how the pattern of resistance was affected by processing stages. However, it was reported that a high prevalence of antimicrobial resistant Salmonella spp. were observed at all processing stages. No details of the size or throughput of the plant were provided.
Henry et al. (2013), a study on Reunion Island, determined the prevalence, AMR, and genetic characteristics of Salmonella spp. from chicken carcasses and environment within a processing plant (processing around 6,000,000 chickens per year at a line speed of approximately 3,000 carcasses per hour). Samples were taken from 71 broiler flocks over a 16-month period. Transport crates, scalding water, plucking fingers, evisceration equipment, and trussing tables were also sampled. This study highlighted the primary source of Salmonella spp. was the farm of origin and downstream stages in processing amplified this Salmonella spp. contamination. Though it was also found that Salmonella-negative flocks could be contaminated through contaminated crates or during processing. However, while the AMR of isolates were determined, and antimicrobial resistant strains identified this was not mapped to processing steps or in terms of flock-to-flock transmission.
A study in Trinidad and Tobago (Khan et al., 2021) determined the prevalence and AMR characteristics of Salmonella spp. from chicken carcasses and the environment within the four chicken processing plants on Trinidad. The four plants had a capacity of processing 250,000, 160,000, 100,000, and <100,000 birds per week at throughputs of 50,000, 32,000, 20,000, and 15,000 birds per day, respectively. Sampling was carried out post-defeathering, post-evisceration and post-chilling. But while the prevalence of Salmonella spp. at different processing stages in each of the four plants was reported, the occurrence of AMR at different processing stages was pooled and the study did not compare different plants, also the number of samples tested was very low. Overall, AMR prevalence (though based on a small number of samples) remained high throughout processing and did not appear to be affected by processing stages. A high prevalence was detected on carcasses post-defeathering and onwards.
Lee et al. (2019), a Korean study, determined the occurrence of sequential transmission of Salmonella spp. during primary processing of chicken from samples collected from 26 plants. No details of the size or throughputs of the plants were provided. Relatively high contamination prevalences of Salmonella spp. were found on shackles (75.0%), feathers near the defeathering machine (68.5%), and in faeces from crates (44.0%). While the pattern of AMR in isolates was determined (and 33.6% of isolates found to be resistant to five or more antimicrobial agents) the occurrence of AMR in isolates was not mapped to transmission during processing stages.
Logue et al. (2003), a US study, determined the prevalence of Salmonella spp. at two selected points on the production line, pre- and post-chill, of two turkey plants. The plants had processing rates of approximately 800 and 8,000 birds per hour. While the AMR of isolates was determined, the prevalence of AMR and effect of processing on AMR transmission was not addressed. Immersion chilling (chlorinated) reduced Salmonella spp., but any specific impact on antimicrobial resistant Salmonella was not reported. Levels of resistance in isolates were low at both plants.
A Spanish study by Melero et al. (2012) is one of the few studies that have mapped genotypes and AMR of C. jejuni at different processing stages and in different flocks (processed a month apart). The plant throughput was 20,000 birds per day. The Sma1 genotype patterns observed in the two different flocks processed in the same processing plant in samples at various stages of the poultry processing chain are shown in Table A3. The prevalence and resistance profiles of the Sma1 genotypes isolated in the two flocks are shown in Table A4. C. jejuni occurred at all steps along the poultry production chain. They observed a high ciprofloxacin and tetracycline resistance among C. jejuni genotypes with resistance to both antimicrobial agents being common, but with only one genotype was found to be resistant to three antimicrobial agents. A new genotype was observed to enter the chain of both flocks in the plant, and persisted throughout slaughter, deboning, and processing suggesting that contamination may occur during processing from C. jejuni persisting in the plant from different flocks. This is also one of the few studies to have continued through cutting operations (though these were manual in this plant, rather than automated).
Table A2.Sma1 genotypes of C. jejuni found at different processing stages in a Spanish poultry processing chain (adapted from Melero et al., 2012).
| Location |
Sample |
Flock 1 Sma1 Genotypes (Table A3) |
Flock 2 Sma1 Genotypes (Table A3) |
| Farm |
Cloacal swab |
H, M |
F |
| Farm |
Boot sock |
H, M, I, J |
None detected |
| Crates |
Dirty crates |
H |
T, D, V |
| Crates |
Clean crates |
H |
D, F |
| Processing plant |
Cloacal swab |
D, H |
T, U, D |
| Processing plant |
Dirty defeathering machine |
D, H |
D, K |
| Processing plant |
Clean defeathering machine |
D, H |
D, X, K |
| Processing plant |
Carcass pre air chilling - Outside |
D, H |
D |
| Processing plant |
Carcass pre air chilling - Inside |
D, E, Q |
D |
| Processing plant |
Carcass post air chilling - Outside |
D, H |
D |
| Processing plant |
Carcass post air chilling - Inside |
D, H |
D, F, K |
| Cutting/deboning |
Cutting table |
D, H |
None detected |
| Cutting/deboning |
Operator’s gloves |
D |
None detected |
| Cutting/deboning |
Chicken breasts |
D, H |
L, S, T, D |
| Cutting/deboning |
Chicken leg |
A, D, H |
L, D, K |
Table A3.Genotype, prevalence, and resistance of C. jejuni isolated in two flocks processed in a Spanish processing plant (adapted from Melero et al., 2012).
| Flock 1 Sma1 Genotype |
Flock 1 Prevalence (%) |
Flock 1 Resistance |
Flock 2 Sma1 Genotype |
Flock 2 Prevalence (%) |
Flock 2 Resistance |
| A |
2.46 |
Ciprofloxacin, Tetracycline |
L |
5.66 |
Ciprofloxacin, Tetracycline |
| D |
43.44 |
Ciprofloxacin, Tetracycline |
S |
1.87 |
Ciprofloxacin, Tetracycline |
| E |
0.82 |
Ciprofloxacin, Tetracycline |
T |
2.83 |
Ciprofloxacin, Tetracycline |
| H |
25.41 |
Ciprofloxacin |
U |
0.94 |
Ciprofloxacin, Tetracycline |
| I |
0.82 |
Ciprofloxacin |
D |
55.66 |
Ciprofloxacin, Tetracycline |
| J |
0.82 |
Ciprofloxacin |
V |
0.94 |
Ciprofloxacin, Tetracycline |
| M |
4.1 |
Ciprofloxacin, Tetracycline |
F |
20.75 |
Ciprofloxacin, Tetracycline |
| Q |
7.38 |
Ciprofloxacin, Tetracycline, Streptomycin |
K |
4.72 |
Tetracycline |
A US study by Mohamed et al. (2014) specifically looked at the impact of broiler chicken chilling on antimicrobial resistant Salmonella spp.. The study described the isolates as have come from a “large poultry plant” , but no details of throughput or line speed were provided. This study found that while chilling impacted the recovery of particular Salmonella spp. clonal groups it had no effect on the presence of class-I integrons, blaCMY genes (which encodes ceftiofur resistance), or tested virulence factors (invA, pagC, and spvC). Thus, suggesting that chilling does not change any pattern of resistance. However, the form of chilling used (immersion) is not used to chill poultry in the UK (except for turkeys). Nether-the-less, it is one of the few studies that have looked in detail at whether a processing stage may impact on any pattern of resistance.
O’Brien et al. (1993), a US study, was one of the few studies identified that had considered the role of plasmids (in E. coli) in poultry processing. Plasmids are important Mobile Genetic Elements (MGEs) and potentially important vectors for the transfer of ARGs between bacteria. However, this specific study provides no useful evidence on what role plasmids may play in the transmission of resistance during poultry processing.
A study of two chicken processing plants (Pacholewicz, Liakopoulos, et al., 2015), one in Germany (with a throughput of 130,000 birds per day) and one in the Netherlands (with a throughput of 240,000 birds per day) determined how levels of extended-spectrum-β-lactamase (ESBL)- and AmpC-β-lactamase (AmpC)-producing E. coli changed in broiler carcasses during processing in both plants. The levels of ESBL/AmpC producing E. coli on broiler chicken carcasses in both plants reduced during processing. In the German plant, all subsequent processing steps reduced the levels, except evisceration which led to a slight increase. The changes in levels between processing steps were reported to be similar for all sampled flocks (broilers from one shed) in this plant. In contrast, changes varied between flocks in the Netherlands plant, and the overall reduction through processing was higher. Changes in ESBL/AmpC producing E. coli along the processing line were similar to changes in generic E. coli in both plants, indicating that E. coli may be a process indicator for ESBL/AmpC producing E. coli. The effect of defeathering on ESBL/AmpC producing E. coli and Campylobacter spp. levels differed. ESBL/AmpC producing E. coli decreased after plucking, whereas Campylobacter spp. levels increased. Genotypes were found to change within some flocks during processing, suggesting that cross-contamination during processing between flocks occurred. A difference between reductions in levels during processing in the different plants suggest that changes in processes and process controls during processing may reduce levels in the final product. Despite a significant reduction of ESBL/AmpC producing E. coli through processing, levels of ESBL/AmpC producing E. coli of between 2 to 5 log10 CFU/carcass were measured on carcasses after chilling.
A US study, by Parveen et al. (2007), found that there was no significant difference in the prevalence of Salmonella spp. between pre- and post-chill carcasses or in the incidence of antimicrobial resistant isolates, suggesting that immersion chilling has no selective effect on AMR. No details of the size or throughput of the plant were provided.
Projahn et al. (2019), a German study, determined the influence of cross-contamination during scalding and defeathering with ESBL-producing Enterobacteriaceae (Klebsiella pneumoniae and E. coli). Samples were taken from the live broilers (from two flocks) prior to processing, environmental samples from the plant before processing of the respective flocks, and from carcasses after processing. WGS analyses of seven ESBL-producing K. pneumoniae isolates and 14 E. coli isolates revealed close relationships between isolates from scalding water and the defeathering equipment, respectively, which were collected before the processing of the broiler flocks, to those isolates found in samples from skin and filet of the respective flock carcasses. No details of the size or throughput of the plant were provided.
Rahimi et al. (2010), an Iranian study, determined the occurrence of transmission of Campylobacter spp. during processing of chicken at four stages in a chicken plant processing approximately 140,000 birds per day. While the pattern of AMR in isolates was determined, the occurrence of AMR in isolates was not mapped to transmission of AMR during specific processing stages.
A US study determined phenotypic and genotypic characterisation of antimicrobial resistant Salmonella strains isolated from chicken carcasses and parts collected at different stages during processing in a plant with a throughput of approximately 130,000 birds per day (Ramirez-Hernandez et al., 2019). The most frequent resistance in Salmonella spp. was associated with tetracycline (49 of 50, 98%) and streptomycin (43 of 50, 86%). WGS analysis of Salmonella spp. isolates identified nine different clonal populations distributed throughout the samples taken at different processing stages. This is one of the few studies to have sampled post-cutting. While general microbial counts on carcasses reduced as carcasses progressed through processing stages there was a slight increase following cutting, suggesting that cross-contamination took place. However, the number of antimicrobial resistant isolates was low and no clear conclusions regarding the role of processing stages on AMR transmission were made.
A Columbian study (Ramirez-Hernandez et al., 2021) determined phenotypic and genotypic characterisation of antimicrobial resistant Salmonella strains isolated from chicken carcasses and parts collected at different stages during processing at three processing plants (Table A5). The 3 processing sites were large scale plants processing 60,000, 90,000, and 55,000 birds per day, respectively. They all utilised 10 ppm hypochlochlorous acid as a chemical intervention in their immersion chiller tanks, a process not employed by UK processors. While a diverse range of genes and plasmids were isolated and identified the study did not come to any firm conclusions regarding the role of different processing stages in the transmission of AMR.
Table A4.Distribution of ARGs and plasmids of Salmonella spp. isolates recovered at different processing stages at different chicken processing sites in Columbia (adapted from Ramirez-Hernandez et al., 2021).
| Processing stage |
Site |
Isolate |
ST |
ARGs |
Plasmids |
| Arrival |
C |
1 |
32 |
aadA1, aph(3’)-la, aph(4)-la, aac(3)-Iva, blaCTX-M-65, fosA3, floR, sul1, tet(A)
|
None |
| Arrival |
C |
2 |
32 |
aadA1, aph(3’)-la, aph(4)-la, aac(3)-Iva, blaCTX-M-65, fosA3, floR, sul1, tet(A)
|
None |
| Arrival |
C |
3 |
32 |
aadA1, aph(3’)-la, aph(4)-la, aac(3)-Iva, blaCTX-M-65, fosA3, floR, sul1, tet(A)
|
None |
| Arrival |
C |
4 |
32 |
aadA1, aph(3’)-la, aph(4)-la, aac(3)-Iva, blaCTX-M-65, blaCTX-M, fosA3, floR, sul1, tet(A)
|
None |
| Arrival |
C |
5 |
28 |
aadA1, dfrA1, qnrB19, sat2
|
None |
| Arrival |
C |
6 |
28 |
aac(6’)-laa, aadA1, dfrA1, qnrB19
|
None |
| Pre-scalding |
B |
1 |
19 |
aac(6’)-laa, aadA1, aph(3’)-la, blaOXA-2, blaTEM-1, cmlA1, mph, sul1, sul3, tet(A) , qnrB19
|
IncA/C2, IncFIB |
| Pre-scalding |
B |
2 |
19 |
aac(6’)-laa, aadA1, aph(3’)-la, blaOXA-2, blaTEM-1, cmlA1, mph, sul1, sul3, tet(A)
|
IncA/C2, IncFIB |
| Pre-scalding |
B |
3 |
19 |
aac(6’)-laa, aadA1, aph(3’)-la, blaOXA-2, blaTEM-1, cmlA1, mph, sul1
|
IncA/C2, IncFIB |
| Pre-scalding |
B |
4 |
15 |
aadA1, blaCMY-2, dfrA1, qnrB19, sat2
|
ColpVc, IncX1, p0111 |
| Pre-scalding |
B |
5 |
28 |
aac(6’)-laa, aadA1, aph(3’)-la, aph(6)-ld, dfrA1, tet(B), qnrB19
|
ColpVc, IncH12, InxX1 |
| Pre-scalding |
B |
6 |
28 |
aac(6’)-laa, aadA1, aph(3’)-la, aph(6)-ld, dfrA1, tet(B), qnrB19
|
IncH12 |
| Pre-scalding |
B |
7 |
28 |
aac(6’)-laa, aadA1, blaCMY-2, dfrA1, tet(A), qnrB19
|
ColpVc, IncH12, InxX1 |
| Pre-scalding |
C |
1 |
32 |
aadA1, aph(4)-la, aac(3)-Iva, blaCTX-M-65, fosA3, floR, sul1, tet(A)
|
None |
| Pre-scalding |
C |
2 |
32 |
aadA1, aph(4)-la, aac(3)-Iva, blaCTX-M-65, fosA3, floR, sul1, tet(A)
|
None |
| Pre-scalding |
C |
3 |
32 |
aadA1, aph(4)-la, aac(3)-Iva, blaCTX-M-65, fosA3, floR, sul1, tet(A)
|
None |
| Pre-scalding |
C |
4 |
32 |
aadA1, aph(3’)-la, aph(4)-la, aac(3)-Iva, blaCTX-M-65, blaCTX-M, fosA3, floR, sul1, tet(A)
|
None |
| Pre-scalding |
C |
5 |
32 |
aac(6’)-laa, aadA1, aph(3’)-la, aph(4)-la, aac(3)-Iva, blaCTX-M-65, fosA3, sul1, tet(A)
|
None |
| Pre-scalding |
C |
6 |
32 |
aadA1, aph(3’)-la, aph(4)-la, aac(3)-Iva, blaCTX-M-65, fosA3, floR, sul1, tet(A)
|
None |
| Pre-scalding |
C |
7 |
32 |
aadA1, aph(3’)-la, aph(6)-ld, aph(4)-la, blaCTX-M-65, dfrA1, fosA3, floR, sul1, tet(A)
|
ColpVc |
| Pre-scalding |
C |
8 |
24 |
None |
None |
| Pre-scalding |
C |
9 |
24 |
None |
None |
| Pre-scalding |
C |
10 |
674 |
qnrB19 |
None |
| Pre-scalding |
C |
11 |
674 |
qnrB19 |
None |
| Pre-scalding |
C |
12 |
32 |
aadA1, aph(3’)-la, aph(4)-la, aac(3)-Iva, fosA3, floR, sul1, qnrB19
|
None |
| Pre-scalding |
C |
13 |
28 |
aadA1, aph(4)-la, aac(3)-Iva, blaSHV-5, cmlA1, dfrA1, sul1, qnrB19, sat2
|
IncH12 |
| Post-scalding |
B |
1 |
28 |
aadA1, aac(3)-Iva, blaCTX-M-65, dfrA1, fosA7, floR, tet(A), tet(B), qnrB19
|
ColpVc |
| Post-scalding |
B |
2 |
32 |
aac(6’)-laa, aadA1, aph(3’)-la, aph(6)-ld, dfrA7, fosA7, sul1, tet(A), qnrB19
|
ColpVc, IncQ1, IncX1, p0111 |
| Post-scalding |
B |
3 |
28 |
aac(6’)-laa, aadA1, aph(3’)-la, aph(6)-ld, blaCMY-2, dfrA1, tet(B), qnrB19
|
ColpVc, IncH12 |
| Post-scalding |
B |
4 |
28 |
aac(6’)-laa, aadA1, aph(3’)-la, aph(6)-ld, dfrA1, tet(B), qnrB19
|
ColpVc, IncH12, IncX1 |
| Post-scalding |
B |
5 |
28 |
aac(6’)-laa, aadA1, aph(3’)-la, aph(6)-ld, blaCMY-2, dfrA1, tet(B), qnrB19
|
None |
| Post-scalding |
C |
1 |
32 |
aac(6’)-laa, aadA1, aph(3’)-la, aph(4)-la, aac(3)-Iva, blaCTX-M-65, fosA3, sul1, tet(A)
|
None |
| Post-scalding |
C |
2 |
32 |
aadA1, aph(3’)-la, aph(4)-la, aac(3)-Iva, blaCTX-M-65, fosA3, floR, sul1, tet(A)
|
None |
| Post-scalding |
C |
3 |
32 |
aadA1, aph(3’)-la, aph(4)-la, aac(3)-Iva, blaCTX-M-65, blaCTX-M, fosA3, floR, sul1, tet(A)
|
None |
| Post-scalding |
C |
4 |
32 |
aadA1, aph(3’)-la, aph(4)-la, aac(3)-Iva, blaCTX-M-65, blaCTX-M, fosA3, floR, sul1, tet(A)
|
None |
| Post-scalding |
C |
5 |
32 |
aadA1, aph(3’)-la, aph(4)-la, aac(3)-Iva, blaCTX-M-65, blaCTX-M, fosA3, floR, sul1, tet(A)
|
None |
| Post-scalding |
C |
6 |
32 |
aadA1, aph(3’)-la, aph(4)-la, aac(3)-Iva, blaCTX-M-65, fosA3, floR, sul1, tet(A)
|
None |
| Post-scalding |
C |
7 |
32 |
aadA1, aph(3’)-la, aph(4)-la, aac(3)-Iva, blaCTX-M-65, fosA3, floR, sul1, tet(A)
|
None |
| Post-scalding |
C |
8 |
32 |
aadA1, aph(3’)-la, aph(4)-la, aac(3)-Iva, blaCTX-M-65, fosA3, floR, sul1, tet(A)
|
None |
| Post-scalding |
C |
9 |
32 |
aadA1, aph(3’)-la, aph(4)-la, aac(3)-Iva, blaCTX-M-65, fosA3, floR, sul1, tet(A)
|
None |
| Post-scalding |
C |
10 |
32 |
aadA1, aph(3’)-la, aph(4)-la, aac(3)-Iva, blaCTX-M-65, fosA3, floR, sul1, tet(A)
|
None |
| Post-defeathering |
C |
1 |
32 |
aadA1, aph(3’)-la, aph(4)-la, aac(3)-Iva, blaCTX-M-65, fosA3, floR, sul1, tet(A)
|
None |
| Post-defeathering |
C |
2 |
32 |
aadA1, aph(3’)-la, aph(4)-la, aac(3)-Iva, blaCTX-M-65, fosA3, floR, sul1, tet(A)
|
None |
| Post-defeathering |
C |
3 |
32 |
aadA1, aph(4)-la, aac(3)-Iva, blaCTX-M-65, fosA3, floR, sul1, tet(A)
|
None |
| Post-defeathering |
C |
4 |
32 |
aadA1, aph(4)-la, aac(3)-Iva, blaCTX-M-65, fosA3, floR, sul1, tet(A)
|
None |
| Post-defeathering |
C |
5 |
32 |
aadA1, aph(4)-la, aac(3)-Iva, blaCTX-M-65, fosA3, floR, sul1, tet(A)
|
None |
| Post-defeathering |
C |
6 |
32 |
aadA1, aph(3’)-la, aph(4)-la, aac(3)-Iva, blaCTX-M-65, fosA3, floR, sul1, tet(A)
|
None |
| Post-defeathering |
C |
7 |
32 |
aadA1, aph(4)-la, aac(3)-Iva, blaCTX-M-65, fosA3, floR, sul1, tet(A)
|
None |
| Post-defeathering |
C |
8 |
32 |
aadA1, aph(4)-la, aac(3)-Iva, dfrA1, floR, sul1, tet(A)
|
None |
| Post-defeathering |
C |
9 |
32 |
aadA1, aph(3’)-la, aph(4)-la, aac(3)-Iva, blaCTX-M-65, fosA3, floR, sul1, tet(A)
|
None |
| Post-defeathering |
C |
10 |
32 |
aadA1, aph(4)-la, aac(3)-Iva, blaCTX-M-65, fosA3, floR, sul1, tet(A)
|
None |
| Post-inside-outside wash |
A |
1 |
32 |
aac(6’)-laa, aadA1, aph(4)-la, aac(3)-Iva, dfrA1, sul1, tet(A)
|
None |
| Post-inside-outside wash |
B |
1 |
24 |
aac(6’)-laa |
None |
| Post-inside-outside wash |
B |
2 |
28 |
aac(6’)-laa, aadA1, aph(3’)-la, aph(6)-ld, dfrA1, tet(B), qnrB19
|
ColpVc, IncH12 |
| Post-inside-outside wash |
B |
3 |
28 |
aadA1, dfrA1, qnrB19, sat2
|
ColpVc, IncH12 |
| Post-inside-outside wash |
C |
1 |
32 |
aadA1, aph(3’)-la, aph(4)-la, aac(3)-Iva, blaCTX-M-65, fosA3, floR, sul1, tet(A)
|
None |
| Post-inside-outside wash |
C |
2 |
24 |
None |
None |
| Pre-chiller |
A |
1 |
32 |
aac(6’)-laa, aadA1, aph(4)-la, aac(3)-Iva, dfrA1, sul1, tet(A)
|
None |
| Pre-chiller |
A |
2 |
32 |
aac(6’)-laa, aadA1, aph(4)-la, aac(3)-Iva, blaCTX-M-65, dfrA1, fosA3, sul1, tet(A)
|
None |
| Pre-chiller |
A |
3 |
32 |
aac(6’)-laa, aadA1, aph(4)-la, aac(3)-Iva, blaCTX-M-65, dfrA1, fosA3, floR, sul1, tet(A)
|
None |
| Pre-chiller |
A |
4 |
32 |
aac(6’)-laa, aadA1, aph(4)-la, aac(3)-Iva, blaCTX-M-65, dfrA1, fosA3, sul1, tet(A)
|
None |
| Pre-chiller |
B |
1 |
28 |
aadA1, aph(6)-ld, aac(3)-Iva, blaCMY-2, blaSHV-5, blaTEM-1, cmlA1, sul3, qnrB19, sat2
|
IncH12 |
| Pre-chiller |
B |
2 |
28 |
aadA1, aph(6)-ld, dfrA1, qnrB19, |
IncH12 |
| Pre-chiller |
B |
3 |
28 |
aadA1, aph(3’)-la, aph(6)-ld, dfrA1, qnrB19, sat2
|
None |
| Pre-chiller |
B |
4 |
28 |
aac(6’)-laa, aadA1, dfrA1, qnrB19
|
None |
| Pre-chiller |
B |
5 |
28 |
aadA1, aph(4)-la, aac(3)-Iva, blaCMY-2, blaSHV-5, blaTEM-1, cmlA1, dfrA1, sul3, qnrB19, sat2
|
IncH12 |
| Pre-chiller |
B |
6 |
28 |
aadA1, aph(6)-ld, aac(3)-Iva, dfrA1, qnrB19, sat2
|
ColpVc, IncX1 |
| Pre-chiller |
B |
7 |
28 |
aadA1, aph(4)-la, aac(3)-Iva, blaCMY-2, blaSHV-5, blaTEM-1, dfrA1, sul3, qnrB19, sat2
|
IncH12 |
| Pre-chiller |
C |
1 |
28 |
aac(6’)-laa, aadA1, dfrA1, qnrB19
|
None |
| Pre-chiller |
C |
2 |
28 |
aadA1, aph(4)-la, aac(3)-Iva, blaCMY-2, blaSHV-5, blaTEM-1, cmlA1, dfrA1, sul3, qnrB19, sat2
|
IncH12 |
| Pre-chiller |
C |
3 |
28 |
aadA1, dfrA1, qnrB19, sat2
|
ColpVc, IncX1 |
| Post-chiller |
A |
1 |
32 |
aac(6’)-laa, aadA1, aph(4)-la, aac(3)-Iva, dfrA1, sul1, tet(A)
|
None |
| Post-chiller |
A |
2 |
32 |
aadA1, aph(4)-la, aac(3)-Iva, dfrA1, floR, sul1
|
None |
| Post-chiller |
C |
1 |
32 |
aadA1, aph(4)-la, aac(3)-Iva, blaCTX-M-65, fosA3, floR, sul1, tet(A)
|
None |
| Post-chiller |
C |
2 |
32 |
aadA1, aph(4)-la, aac(3)-Iva, fosA3, floR, sul1, tet(A)
|
None |
| Post-chiller |
C |
3 |
24 |
None |
None |
| Post-chiller |
C |
4 |
28 |
aac(6’)-laa, aadA1, dfrA1, qnrB19
|
None |
Roe et al. (2003), a US study, determined the prevalence of integrons (an important MGE that may contribute to the dissemination of ARGs in bacteria). Class 1 and class 2 integrons were found throughout the processing environment (post-pluck, pre-chill, and post-chill). Of the two classes of integrons, class 1 was the most prevalent in all processing areas. The levels of both classes of integrons decreased from the farm to the processing plant. Within the chiller tank (immersion chilling being used), the persistence of these sequences appeared to be related to the free chlorine concentration of the water. These results suggest that MGEs are capable of persisting in the poultry processing environment. But this study did not test for the presence of any ARGs in the processing environment. No details of the size or throughput of the two plants where samples were taken were provided.
A study on the recovery of antimicrobial resistant isolates of Salmonella Heidelberg from scalding tank water at two time points during a processing day over multiple processing days in a commercial poultry plant (at a throughput of approximately 21,840 birds per hour) suggests that scalder water may be a reservoir for cross-contamination of AMR bacteria (Rothrock et al., 2015). No Salmonella spp. were recovered from the scalding water at the beginning of the day, but a total of 56 isolates were recovered from mid-day and end-of-day scalder samples suggesting contamination was a regular occurrence. Eleven of these 56 isolates were identified as Salmonella Heidelberg and all found to be MDR.
A US study by Sánchez et al. (2002) provides evidence that the method of chilling (immersion or air) may influence the microbial profile and AMR of Campylobacter spp. and Salmonella spp*.* This study reported that the incidence of Salmonella spp. and Campylobacter spp. tended to be lower in air-chilled broilers, suggesting that cross-contamination may be more prevalent during immersion-chilling. Campylobacter spp. isolates from immersion-chilled broilers had a higher incidence of resistance to nalidixic acid and related fluoroquinolones than isolates from air-chilled broilers. Though, Campylobacter spp. isolates from air-chilled broilers had a higher frequency of resistance to tetracycline than isolates from immersion-chilled broilers. Regarding Salmonella spp., isolates from immersion-chilled broilers had a higher incidence of resistance to nalidixic acid than isolates from air-chilled broilers.
Sakaridis et al. (2019) determined the occurrence of Campylobacter spp. transmission during chicken processing in a small-scale plant (throughput of 6,000 birds per day) in Greece. While the pattern of AMR in isolates was identified, the occurrence of AMR in isolates was not mapped to transmission of AMR during specific processing stages.
A series of papers by the same team in Germany (Savin, Bierbaum, Blau, et al., 2020; Savin, Bierbaum, Hammerl, et al., 2020; Savin, Bierbaum, Mutters, et al., 2022; Savin, Bierbaum, Schmithausen, et al., 2022; Savin et al., 2021) report on studies that have looked in detail at the role of wastewater from poultry plants (as well as pork plants) in the dissemination of antimicrobial resistant bacteria and ARGs into the environment. While these studies did not look at transmission of AMR and/or ARGs to carcasses during processing, they did look at the occurrence of many different antimicrobial resistant bacteria and ARGs in process waters at different locations throughout two plants, including from transport crates, stunning facilities, scalding/defeathering water, evisceration equipment, as well as effluent. These studies suggest that a wide range of pathogenic and commensal bacteria (including ESKAPE bacteria, ESBL E. coli, and colistin-resistant Enterobacteriaceae) with a diverse range of ARGs, virulence factors, and diverse resistance patterns may reside in poultry processing plants and act a reservoir for mobile resistances. They also looked at mitigation strategies/methods for removing antimicrobial resistant bacteria and ARGs from wastewater (Savin et al., 2021).
A Spanish study (Torralbo et al., 2015), that collected 476 samples from cloaca, carcass surfaces and quartered carcasses and 372 environmental samples reported that the general prevalence of Campylobacter spp. was 68.8% (40.2% of C. coli and 28.5% of C. jejuni). The relative prevalence of C. coli increased from loading dock area (41.5%) to packing area (64.6%). In contrast, the relative prevalence of C. jejuni decreased from 58.5% to 35.4%. These differences between species from initial to final area were significant (p = 0.02). The overall AMR was determined for the samples but not related to processing stage. Eleven of 30 (36.7%) C. jejuni isolates and 25 of 30 (83.3%) C. coli isolates were found to be MDR. No information was provided on the role of processing stage on AMR transmission along the slaughter line. No details of the size or throughput of the plant where samples were taken was provided.
Vinueza-Burgos et al. (2019), a study in Ecuador, looked at presence of Salmonella spp. in farm and 3 stages in plant (caeca samples and skin samples before and after chilling). Salmonella Infantis isolates were isolated from all stages and had the highest isolation rate (94%, 66/70), and showed resistance to at least 6 antimicrobial agents. In contrast, Salmonella Mbandaka (1%, 1/70) and Salmonella Amsterdam (3%, 2/70) were only isolated from raw feed materials and overshoes (flock 1, farm C) respectively. One isolate from overshoes (flock 3, farm A) was auto-agglutinable and showed resistance to at least 6 antimicrobial agents. This study showed that some genotypes originated on farm and persisted through processing, whereas some were only found on carcasses, suggesting cross-contamination in plant played a role in the diversity of contamination. No details of the size or throughput of the processing plant was provided.
von Tippelskirch et al. (2018), a study in Germany, did not look at the effect of different processing stages during processing on AMR transmission but did look at the effect of processing multiple flocks. Overall, this study indicates that cross-contamination has an impact on the prevalence of ESBL-/AmpC-producing Enterobacteriaceae in broiler chicken. ESBL-/AmpC-producing Enterobacteriaceae were brought into the plant by certain flocks and other flocks were contaminated by ESBL-/AmpC-producing Enterobacteriaceae already present in the slaughterhouse environment or in the transport crates. No details of the size or throughput of the processing plant was provided.
Another study (in China) that collected samples from chicken carcass surfaces and processing contact-surfaces, at three processing stages (post-evisceration, post-chilling, and post-grading) at a chicken plant (H. Wang et al., 2013) reported that the incidence of Salmonella spp. decreased with progress through the plant (Figure A2). They reported that Salmonella spp. isolates had the potential for attachment on contact-surfaces in a meat processing environment. The study demonstrated that the occurrence of Salmonella spp. in a chicken processing plant was relatively high, a total of 23 isolates of Salmonella spp. belonging to 6 serotypes were identified, including serotypes Indiana, Derby, Heidelberg, Agona, Infantis and Typhimurium. All isolates showed 13 multiple AMR patterns against 11 different antimicrobial agents. Of the 23 isolates, the proportion of isolates resistant to various antimicrobial agents ranged from 13% to 78%, and the MAR (Multiple Antibiotic Resistant) index (the ratio of the number of antimicrobial agents to which an organism is resistant against the number of antimicrobial agents to which the organism is exposed) of the isolates varied from 0.09 to 0.91. However, no conclusions regarding the role of processing stages on AMR transmission were made. No details of the size or throughput of the processing plant was provided.
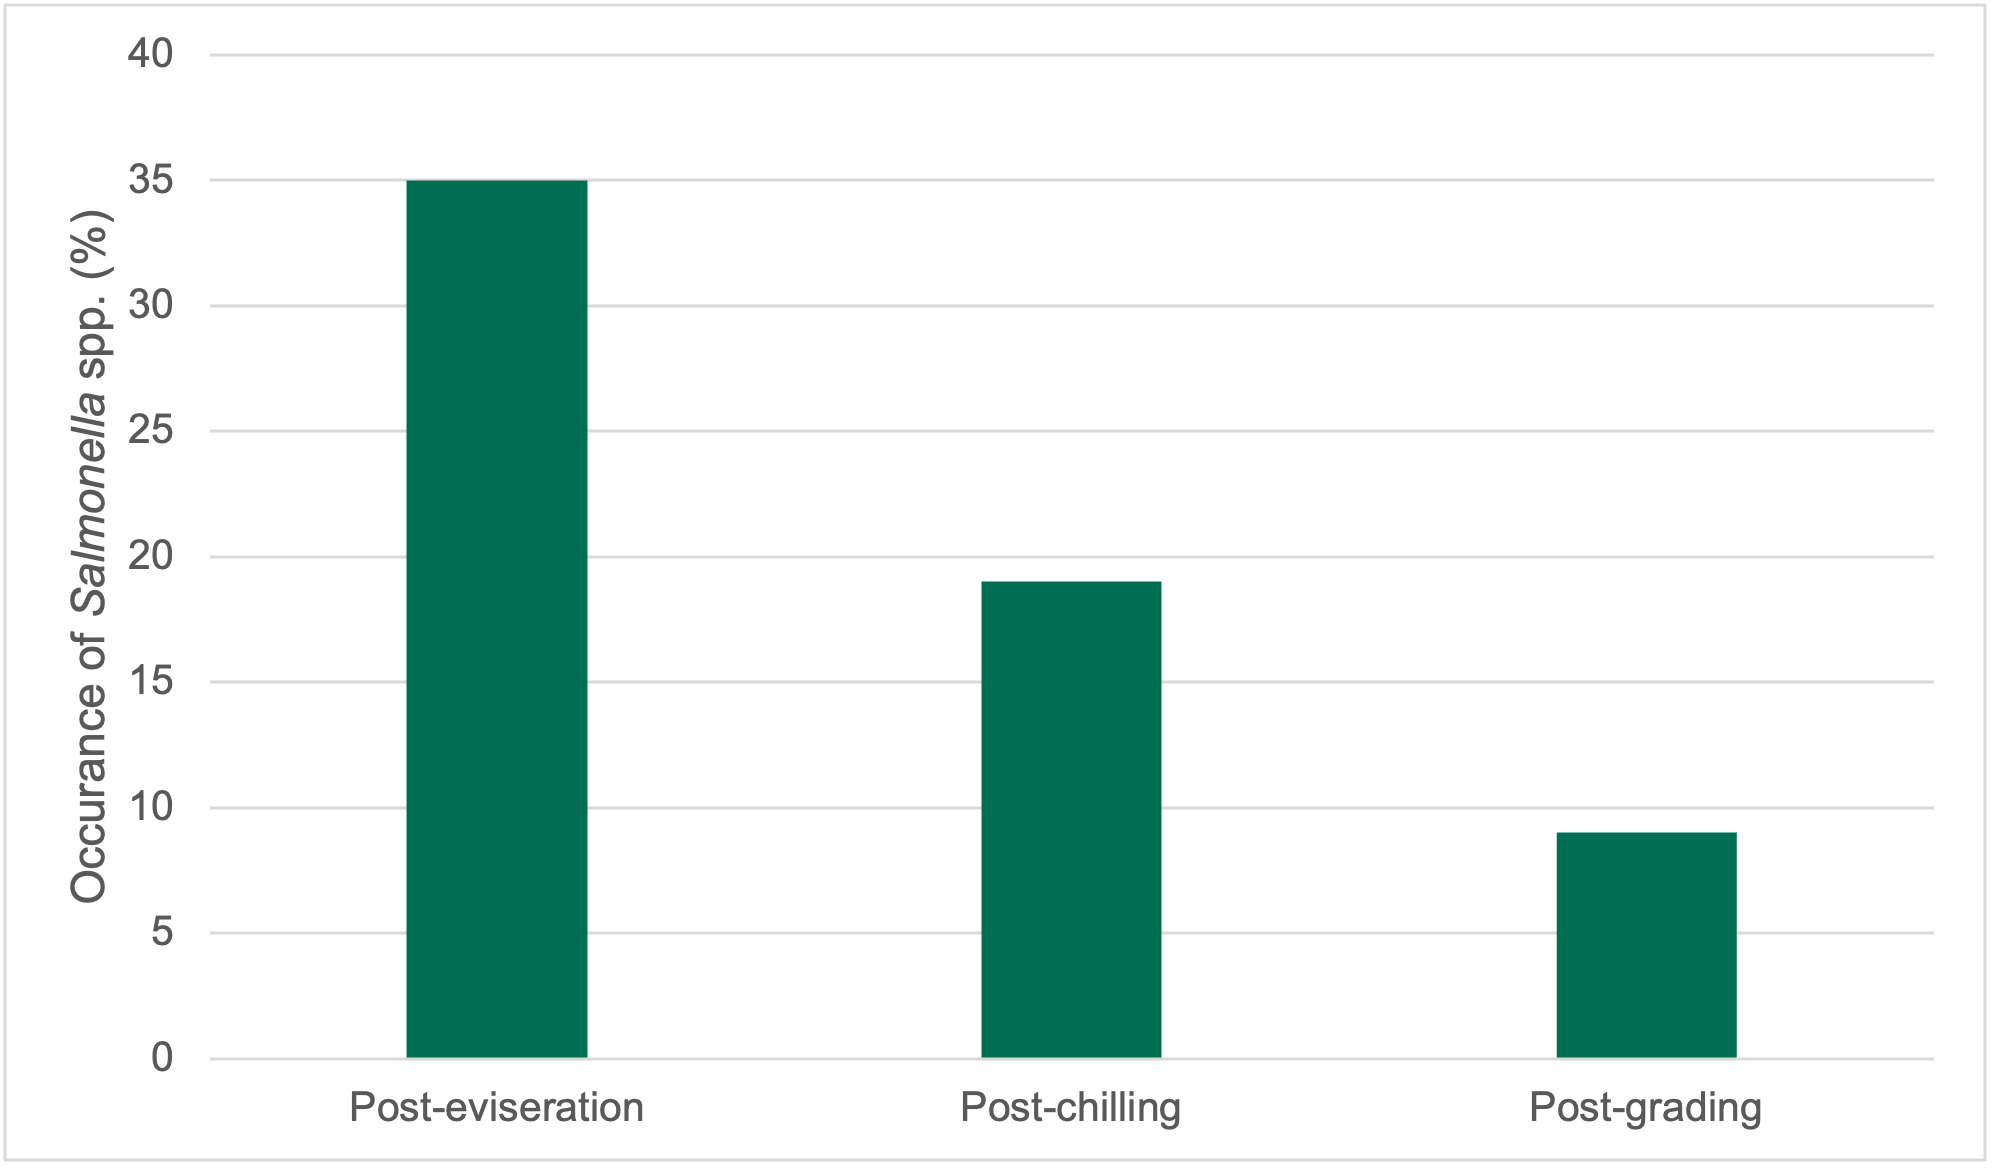
The isolation of ESBL-/AmpC producing E. coli during the slaughter process of six chicken flocks in a Korean processing plant were reported by Wei et al. (2021). The plant was reported to be “the largest chicken slaughter and processing plant in Korea”, but no details of throughput provided. The environmental samples were collected from the first batch each sampling day at 6 time points from 12 process locations, including (1) lairage, (2) scalding, (3) feather removal, (4) the first conveyor, (5) evisceration, (6) the first washing, (7) the second conveyor, (8) the second washing, (9) air chilling, (10) the third conveyor, (11) the third washing, and (12) handling workers along the entire poultry processing operation in the plant.
In total, 81 suspected ESBL/AmpC-producing E. coli isolates were collected, and all isolates were used to examine the presence of the lactamase encoding genes, blaCTX-M, blaSHV, and blaTEM, and the AmpC -lactamase gene, blaCMY. Among these 81 isolates, the presence of blaTEM, blaCTX-M, and blaCMY was confirmed in 78 isolates. The dominant CTX-M types included blaCTX-M-1 and blaCTX-M-14, while blaCTX-M-15, blaCTX-M-55, and blaCTX-M-65 were detected in ESBL-producing isolates. Moreover, the only AmpC gene, blaCMY-2, was found both in the slaughterhouse and retail chicken meat. Experimental (in vitro in broth) transfer of blaCTX-M genes by conjugation to recipient E. coli J53 was found in 67.5% (27/40) of the ESBL-producing isolates. Three blaCTX-M genes (blaCTX-M-1, blaCTX-M-14, and blaCTX-M-55) were transferred to J53 in the ESBL-producing E. coli isolates from the lairage area, then slaughterhouse environment, and retail meat. The AmpC gene, blaCMY-2, could be transferred to J53 in 56.1% (23/41) of the AmpC-producing E. coli isolates, and its presence was confirmed in AmpC-producing isolates from the lairage area, the slaughterhouse environment, and retail meat.
The authors concluded that cross-contamination has a crucial role in the occurrence of ESBL/AmpC-producing E. coli in retail chicken meat. They found that ESBL-/AmpC-producing E. coli were brought into the processing plant by certain broiler chicken flocks, and other chicken flocks were contaminated by ESBL/AmpC-producing E. coli already present in the slaughterhouse environment.
Wirz et al. (2010) collected samples from 411 different flocks from 5 different suppliers in Switzerland. Details of the throughputs of the 5 plants were not provided but said to account for 80% of the poultry meat produced in Switzerland. The caecal samples were taken at the time of evisceration by careful manual traction at the junction with the intestine. The neck skins were collected directly after chilling but before further processing, such as cutting or packaging. The prevalence of C. jejuni and C. coli was not significantly different between the sites. A mutated gyrA gene, associated with quinolone resistance, was detected in 18.9% of C. jejuni and 26.8% of C. coli isolates. The authors concluded that most of the contamination occurred prior to processing and originated from the slaughtered flock itself.
A Brazilian study (Yamatogi et al., 2015) determined the occurrence of Salmonella Corvallis on chicken samples collected at different stages of the manufacturing process (post-bleeding, post-defeathering, and post-chilling). No details of the size or throughput of the plant were provided. Ten of the 14 isolates (71.4%) showed ESBL production and resistance to at least three antimicrobial agents. Of the isolates obtained, 28.6% had confirmed nalidixic acid resistance and reduced ciprofloxacin susceptibility. Nine of the 14 isolates were found at the post-bleeding stage, three at the post-plucking stage, and two at the post-chiller stage. Numbers of isolates were too low to determine the role of processing stages on transmission.
An investigation on AMR in thermotolerant Campylobacter spp. isolated from different stages of the poultry meat supply chain in Argentina (Zbrun et al., 2015) studies 6 poultry meat chains from the reproductive farm to the chicken at retail. Chickens sampled along each food chain were from the same batch. Samples collected were a) cloacal samples from hens and chickens on the farm, b) chicken carcasses from the slaughterhouse and retail market. However, no details were provided of where in the processing plant samples were taken. It was concluded that contamination was occurring on-farm. No details of the size or throughputs of the plants were provided.
A Chinese study that followed batches of chickens from three different farms through the same processing plant (with a throughput of 20,000 birds per day) found similarities in Campylobacter spp. isolates from different flocks (Zhang et al., 2018). Similar STs of Campylobacter spp. were detected in samples collected at multiple points processing in the poultry processing chain at the plant. The most frequently detected STs (ST8089, ST6186, and ST860) in samples taken during processing were also detected in isolates from each cloacal sample. 94% of the tested isolates were MDR. The authors concluded that Campylobacter spp. in slaughterhouses originate mainly from the farms and that minimising the Campylobacter spp. colonization in the incoming broiler flock was thus important. The specific role of processing on AMR transmission was not discussed in any detail.
A Chinese study by Zhu et al. (2017) sampled caecal and carcass samples after evisceration and after cutting. Overall, 60.8% of Salmonella spp. isolates were MDR, and MDR isolates increased from 44.7% to 78.6% along the slaughtering line. Of these 94.6% (n =157) of beta-lactam-resistant isolates harboured at least one resistance gene of blaTEM or blaCTXM. However, this data was obtained from only two sampling points during processing (cecal contents and carcasses after evisceration, and chicken meat after cutting) in one processing plant. No details of the size or throughput of the plant were provided.
Overall, the literature review found that relatively few studies have investigated the role of processing on the transmission of antimicrobial resistant bacteria and/or ARGs in chicken meat. Of those studies that have, few have compared operations in different plants, and often details on the size, throughput, and line speeds of the plants studied have been omitted in publications.
A summary of processing stages/locations that have been sampled in studies that have investigated the role of processing on the transmission of AMR contamination during poultry processing is shown in Table A5.
Table A5.Summary of processing stages/locations that have been sampled in studies that have investigated the role of processing on the transmission of AMR contamination during poultry processing (S = Sampled; N = Not sampled).
| Birds arrival, Live bird |
Post-bleed, Pre-scald |
Post-scald, Pre-pluck |
Post-pluck/defeathering |
Post-evisceration, Pre-inside-outside wash |
Post-inside outside wash, Pre-chill |
Post-chill |
Post-portioning/cutting |
Pre-pack (whole carcasses) |
Environmental and water |
Organism |
Country |
Reference |
| S |
N |
N |
S |
S |
S |
S |
N |
N |
S |
C. jejuni, C. coli |
China |
Bai et al. (2021) |
| S |
N |
N |
S |
S |
S |
S |
N |
N |
S |
Campylobacter |
US |
Bailey et al. (2019) |
| N |
N |
N |
S |
N |
N |
S |
N |
N |
N |
Salmonella |
US |
Berrang et al. (2009) |
| N |
N |
N |
N |
N |
S |
S |
S |
N |
N |
Campylobacter |
Ireland |
Emanowicz et al. (2022) |
| N |
N |
N |
S |
S |
S |
N |
S |
N |
N |
Salmonella |
China |
Gu et al. (2020) |
| N |
N |
N |
S |
S |
N |
S |
N |
N |
N |
Salmonella |
Trinidad and Tobago |
Khan et al. (2021) |
| N |
S |
S |
S |
S |
N |
S |
N |
N |
N |
ESBL/AmpC producing E. coli
|
Germany, and the Netherlands |
Pacholewicz et al. (2015) |
| N |
N |
N |
N |
N |
S |
S |
N |
N |
N |
Salmonella |
US |
Parveen et al. (2007) |
| N |
S |
S |
N |
S |
S |
N |
S |
N |
N |
Salmonella |
US |
Ramirez-Hernandez et al. (2019) |
| S |
S |
S |
S |
N |
S |
S |
S |
N |
N |
Salmonella |
Columbia |
Ramirez-Hernandez et al. (2021) |
| S |
N |
S |
N |
S |
S |
N |
S |
S |
S |
C. jejuni, C. coli |
Spain |
Torralbo et al. (2015) |
| N |
N |
N |
N |
N |
N |
S |
S |
N |
S |
Salmonella |
Ecuador |
Vinueza-Burgos et al. (2019) |
| S |
N |
N |
N |
S |
N |
S |
N |
N |
N |
Salmonella Indiana, Infantis, Derby, Heidelberg, Agona, Typhimurium |
China |
Wang et al. (2013) |
| N |
N |
S |
S |
S |
S |
N |
N |
N |
S |
E. coli |
Korea |
Wei et al. (2021) |
| N |
N |
N |
N |
S |
N |
S |
N |
N |
N |
C. jejuni, C. coli |
Switzerland |
Wirz et al. (2010) |
| N |
S |
S |
N |
N |
N |
S |
N |
S |
N |
Salmonella Corvallis |
Brazil |
Yamatogi et al. (2015) |
| S |
N |
N |
N |
N |
N |
N |
N |
S |
N |
C. jejuni, C. coli |
Argentina |
Zbrun et al. (2015) |
| S |
N |
N |
S |
S |
S |
S |
N |
N |
S |
C. jejuni, C. coli |
China |
Zhang et al. (2018) |
| N |
N |
N |
N |
N |
S |
N |
S |
N |
N |
Salmonella |
China |
Zhu et al. (2017) |
The most relevant published studies identified in the literature search were those by Melero et al. (2012), Pacholewicz et al. (2015), Bailey et al. (2019), Savin et al. (2020), Savin et al. (2020), Wei et al. (2021), Ramirez-Hernandez et al. (2021), and Emanowicz et al. (2022).