Consumer Insights Tracker - January 2025 to March 2025 Report
1. Key findings
-
Approximately a fifth of respondents (21%) were worried about being able to afford food in March 2025. This represents a decrease from December 2024 (26%). For all months across the quarter (22% in January and 23% in February) figures return to comparable levels with October 2024 (23%).
-
In March 2025, 19% of respondents reported worrying about the availability of food for their household in the next month. This remained consistent throughout the quarter (19% in January, 21% in February, and 19% in March). These figures were lower than the 24% who reported worry in December 2024.
-
Food prices (87%) and ultra-processed food (78%) were the top two food concerns in March 2025. The percentage who reported concern about these issues has been relatively stable over time and is in line with this time last year.
-
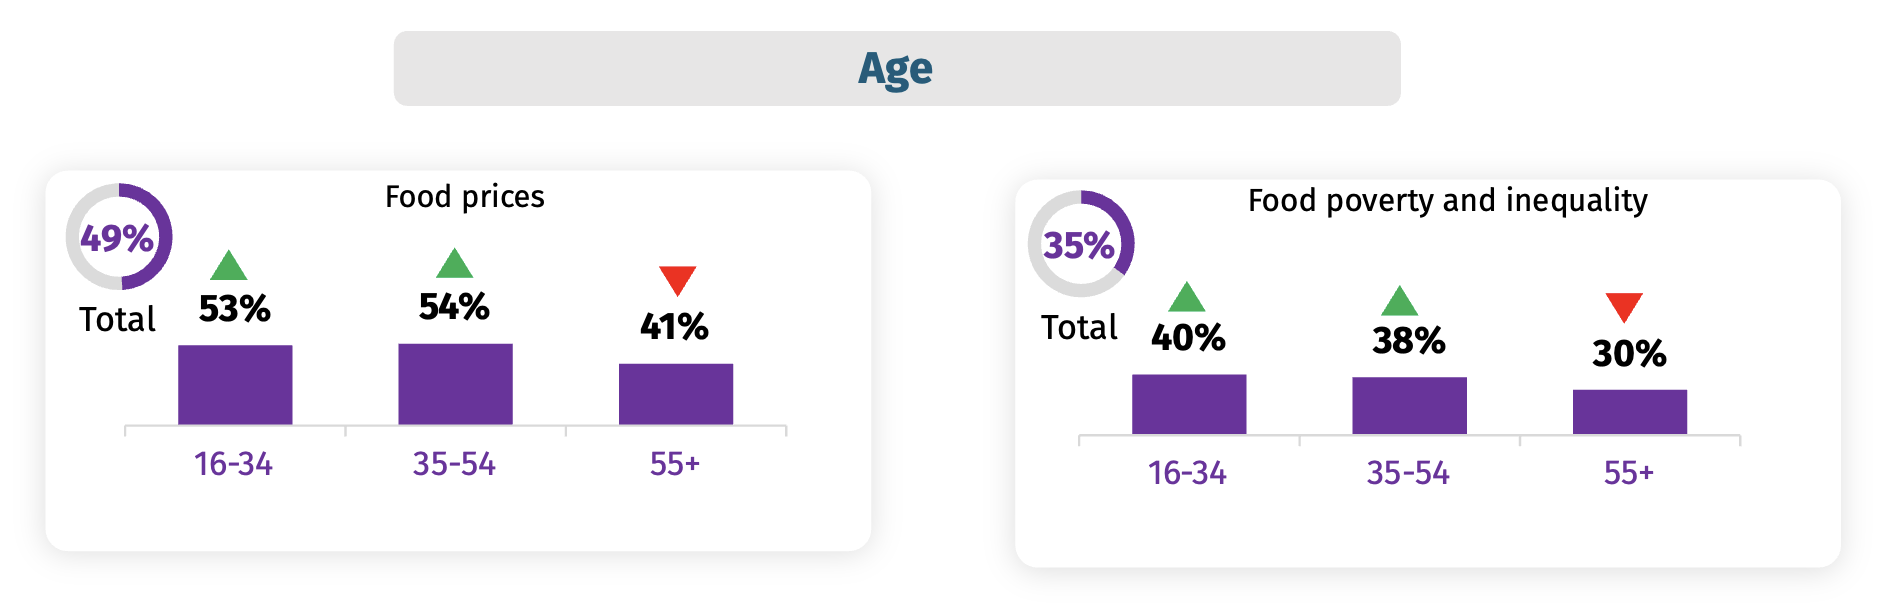
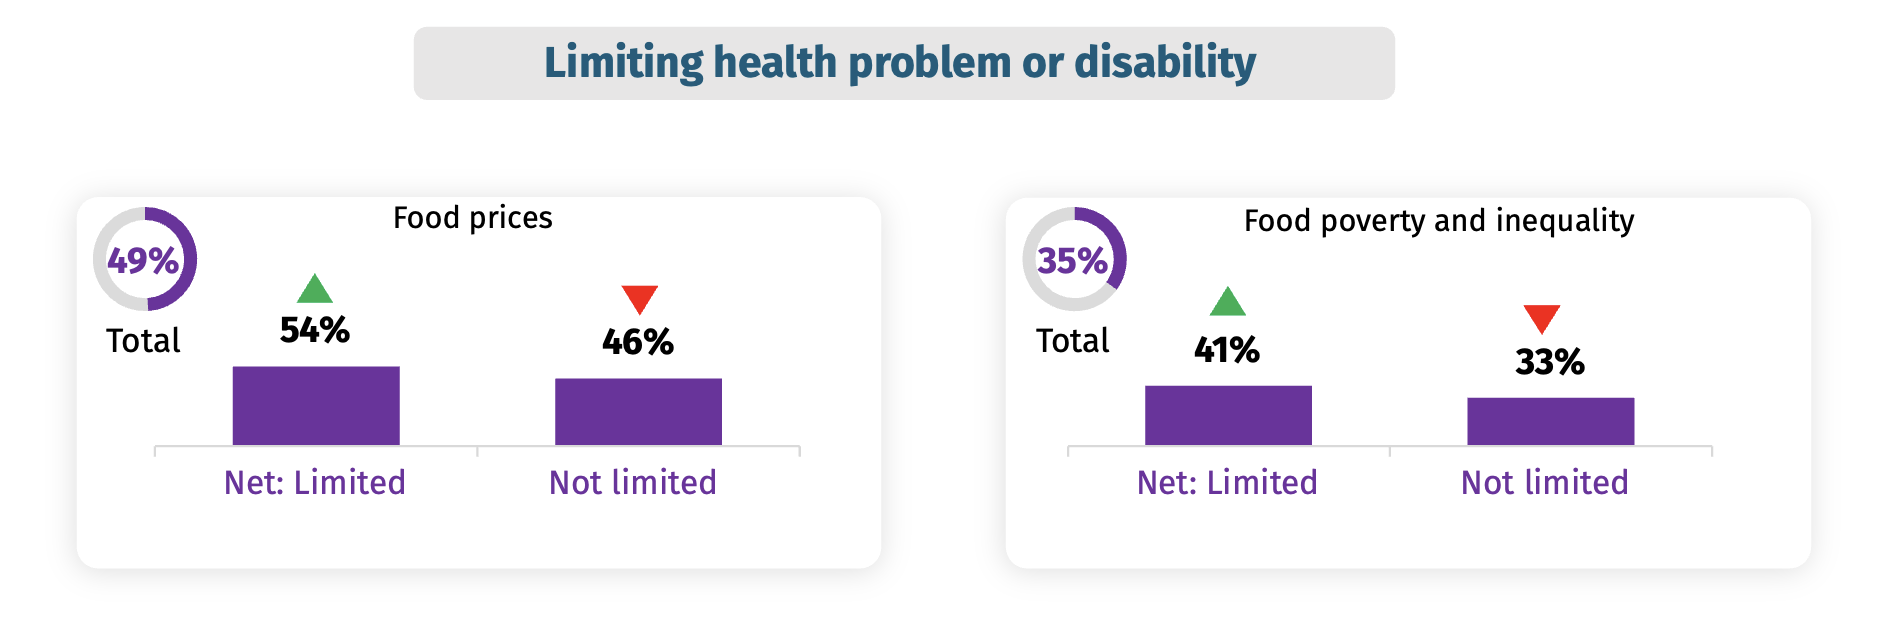
Looking at data from January to March 2025 combined, respondents aged 16-34 and 35-54 were more likely than those aged 55+ to report being highly concerned about food prices (53% and 54% vs 41%) and food poverty and inequality (40% and 38% vs 30%). Respondents limited by a disability/health problem were also more likely to be highly concerned about food prices (54%) and food poverty (41%) vs those not limited (46% and 33%).
-
63% were confident in the food supply chain in March 2025. Confidence in February (64%) and March (63%) is higher than September 2024 - January 2025.
-
Among those with some knowledge of the FSA, the proportion who trust the FSA to do its job rose from 57% in December 2024 to 64% in March 2025. Over the same period, confidence in the FSA communicating openly with the public about food-related risks rose from 64% to 70%.
2.1. Topics
This report presents findings for topics we track regularly including consumer concerns in relation to food, food affordability, and confidence in the FSA as a regulator.
Between January and March 2025, questions were also asked about consumer views on food regulations (Jan), listeria (Jan), precision fermented dairy (Feb), slushies and glycerol (Mar), caffeine (Mar) and precision breeding (Mar). Data for these questions can be found in the accompanying data tables.
2.2. Method
-
This research was conducted online using the YouGov panel which gives access to 400,000 active panellists in the UK.
-
This report presents findings from the months January – March 2025. Where appropriate, comparisons are made to previous waves since July 2023.
-
Across England, Wales and Northern Ireland 2,080 took part in the survey in January (3rd – 8th), 2,097 in February (7th – 10th) and 2,051 in March 2025 (7th – 11th).
-
Quotas were set by age, gender, education and region. The data is also weighted to be representative of the population by these demographic variables. All results are based on final weighted data.
2.3. Notes for interpretation
-
Reporting convention (↑ / ↓ on graphs): The Consumer Insights Tracker uses t-tests to assess differences over time and between groups, and highlights those where the p value is <0.05. Due to the quota sampling methodology used, the tests cannot be interpreted strictly. However, they do help to highlight where there is the greatest evidence of a shift in behaviour or attitudes. For more information contact analysis@food.gov.uk.
-
Online panel survey: As respondents come from an online panel, people without internet access are not represented directly.
-
Percentages: Figures may not add up to 100% on graphs due to rounding, or in some questions, respondents were able to select multiple answers.
3. Results
3.1. Food affordability
From December 2024 to March 2025, the proportion who reported worrying about their household not being able to afford food decreased. All three months saw the proportion who reported worrying return to levels comparable to October (23%).

Figure 1.Proportion who reported worrying about their household not being able to afford food in the next month
Note: The new data points (from January to March) are shown in a different colour. Q3m. To what extent, if at all, are you worried you/your household will not be able to afford food in the next month? Base: All in March 25 (n=2,051), February 25 (n=2,097), January 25 (n=2,080), December 24 (n=2,036), November 24 (n=2,022), October 24 (n=2,008), September 24 (n=2,014), August 24 (n=2,008), July 24 (n=2,070), June 24 (n=2,056), May 24 (n=2,067), April 24 (n=2,061), March 24 (n=2,015), February 24 (n=2,066), January 24 (n=2,038), December 23 (n=2,026), November 23 (n=2,064), October 23 (n=2,062), September 23 (n=2,057), August 23 (n=2,044) and July 23 (n=2,085).
The proportion who reported that at least one of the statements shown in Figure 2 applies to them or their household has remained relatively stable over time, at above three in five. There was a slight drop in the proportion reporting buying reduced/discounted food from February (38%) to March (34%).

Figure 2.Reported shopping statements
Note: Q6. In the last month, did any of the following apply to you, or someone else in your household? Please tick all that apply. I, or someone in my household… Base: All in March 25 (n=2,051), February 25 (n=2,097), January 25 (n=2,080), December 24 (n=2,036), November 24 (n=2,022), October 24 (n=2,008), September 24 (n=2,014), August 24 (n=2,008), July 24 (n=2,070), June 24 (n=2,056), May 24 (n=2,067), April 24 (n=2,061), March 24 (n=2,015), February 24 (n=2,066), January 24 (n=2,038), December 23 (n=2,026), November 23 (n=2,064), October 23 (n=2,062), September 23 (n=2,057) and August 23 (n=2,044). Please note: Total values do not add to 100% as participants could select multiple responses. Differences compared to February shown with arrows, please see background section for more information.
3.1.2. Cooking and eating
Between January and March 2025, there was no notable change in the proportion of respondents who reported doing the money saving cooking and eating behaviours shown in Figure 3.

Figure 3.Proportion who had the following apply to them or someone else in their household
Note: Q6. In the last month, did any of the following apply to you, or someone else in your household? Please tick all that apply. I, or someone in my household… Base: March 2025 (n=2,051), February (n=2,097) and January (n=2,080)
In January, February and March 2025, a lower proportion reported doing all the behaviours to reduce energy bills and save money shown in Figure 4 compared to December 2024. Figures from January to March 2025 are in line with November 2024.

Figure 4.Proportion who did any of the following to reduce energy bills or save money in the last month
Note: Q8m. In the last month, which, if any, of the following have you done to reduce your energy bills and save money? Base: March 25 (n=2,051), February 25 (n=2,097), January 25 (n=2,080), December 24 (n=2,036), November 24 (n=2,022). Differences compared to February shown with arrows, please see background section for more information.
3.2. Food availability
As shown in Figure 5, the proportion who reported worrying about there not being enough food available for them or their household in the next month was lower in January (19%), February (21%) and March (19%) 2025 compared to December 2024 (24%).

Figure 5.Proportion who reported worrying about there not being enough food available for their household in the next month
Note: The new data points (from January to March) are shown in a different colour. Q2m. To what extent, if at all, are you worried about there not being enough food available for you/your household to buy in the next month? Base: All in March 25 (n=2,051), February 25 (n=2,097), January 25 (n=2,080), December 24 (n=2,036), November 24 (n=2,022), October 24 (n=2,008), September 24 (n=2,014), August 24 (n=2,008), July 24 (n=2,070), June 24 (n=2,056), May 24 (n=2,067), April 24 (n=2,061), March 24 (n=2,015), February 24 (n=2,066), January 24 (n=2,038), December 23 (n=2,026), November 23 (n=2,064), October 23 (n=2,062), September 23 (n=2,057), August 23 (n=2,044) and July 23 (n=2,085).
3.3. Food concerns
From January to March 2025, the top two concerns were food prices and ultra-processed food (as shown in Figure 6).

Figure 6.Proportion who reported concern about food by topic
Note: Q12. Thinking about food in the UK in general. At the moment, how concerned, if at all, do you feel about each of the following topics? Base: All in March 2025 (n=2,051), February (n=2,097) and January (n=2,080) Respondents were shown all of the topics listed and asked how concerned, if at all, they felt about each. Figures shown in chart are the proportion ‘highly concerned’ or ‘somewhat concerned’. Differences compared to February shown with arrows, please see background section for more information.
As shown in Figures 7 to 11, in March 2025 there was a decline in concern regarding:
-
Food poverty and inequality
-
The information on food labels being accurate
-
Food availability/food shortages
-
The quality of food produced in the UK
-
The safety of food produced in the UK

Figure 7.Proportion who reported concern about food poverty and inequality
Note: The new data points (from January to March) are shown in a different colour. Q12. Thinking about food in the UK in general. At the moment, how concerned, if at all, do you feel about each of the following topics? Base: All in March 25 (n=2,051), February 25 (n=2,097), January 25 (n=2,080), December 24 (n=2,036), November 24 (n=2,022), October 24 (n=2,008), September 24 (n=2,014), August 24 (n=2,008), July 24 (n=2,070), June 24 (n=2,056), May 24 (n=2,067), April 24 (n=2,061), March 24 (n=2,015), February 24 (n=2,066), January 24 (n=2,038), December 23 (n=2,026), November 23 (n=2,064), October 23 (n=2,062), September 23 (n=2,057), August 23 (n=2,044) and July 23 (n=2,085). Respondents were shown all of the topics listed and asked how concerned, if at all, they felt about each. Figures shown in chart are the proportion ‘highly concerned’ or ‘somewhat concerned’. Differences compared to February shown with arrows, please see background section for more information.

Figure 8.Proportion who reported concern about the information of food labels being accurate
Note: The new data points (from January to March) are shown in a different colour. Q12. Thinking about food in the UK in general. At the moment, how concerned, if at all, do you feel about each of the following topics? Base: All in March 25 (n=2,051), February 25 (n=2,097), January 25 (n=2,080), December 24 (n=2,036), November 24 (n=2,022), October 24 (n=2,008), September 24 (n=2,014), August 24 (n=2,008), July 24 (n=2,070), June 24 (n=2,056), May 24 (n=2,067), April 24 (n=2,061), March 24 (n=2,015), February 24 (n=2,066), January 24 (n=2,038), December 23 (n=2,026), November 23 (n=2,064), October 23 (n=2,062), September 23 (n=2,057), August 23 (n=2,044) and July 23 (n=2,085). Respondents were shown all of the topics listed and asked how concerned, if at all, they felt about each. Figures shown in chart are the proportion ‘highly concerned’ or ‘somewhat concerned’. Differences compared to February shown with arrows, please see background section for more information.

Figure 9.Proportion who reported concern about food availability/ food shortages
Note: The new data points (from January to March) are shown in a different colour. Q12. Thinking about food in the UK in general. At the moment, how concerned, if at all, do you feel about each of the following topics? Base: All in March 25 (n=2,051), February 25 (n=2,097), January 25 (n=2,080), December 24 (n=2,036), November 24 (n=2,022), October 24 (n=2,008), September 24 (n=2,014), August 24 (n=2,008), July 24 (n=2,070), June 24 (n=2,056), May 24 (n=2,067), April 24 (n=2,061), March 24 (n=2,015), February 24 (n=2,066), January 24 (n=2,038), December 23 (n=2,026), November 23 (n=2,064), October 23 (n=2,062), September 23 (n=2,057), August 23 (n=2,044) and July 23 (n=2,085). Respondents were shown all of the topics listed and asked how concerned, if at all, they felt about each. Figures shown in chart are the proportion ‘highly concerned’ or ‘somewhat concerned’. Differences compared to February shown with arrows, please see background section for more information.

Figure 10.Proportion who reported concern about the quality of food produced in the UK
Note: The new data points (from January to March) are shown in a different colour. Q12. Thinking about food in the UK in general. At the moment, how concerned, if at all, do you feel about each of the following topics? Base: All in March 25 (n=2,051), February 25 (n=2,097), January 25 (n=2,080), December 24 (n=2,036), November 24 (n=2,022), October 24 (n=2,008), September 24 (n=2,014), August 24 (n=2,008), July 24 (n=2,070), June 24 (n=2,056), May 24 (n=2,067), April 24 (n=2,061), March 24 (n=2,015), February 24 (n=2,066), January 24 (n=2,038), December 23 (n=2,026), November 23 (n=2,064), October 23 (n=2,062), September 23 (n=2,057), August 23 (n=2,044) and July 23 (n=2,085). Respondents were shown all of the topics listed and asked how concerned, if at all, they felt about each. Figures shown in chart are the proportion ‘highly concerned’ or ‘somewhat concerned’. Differences compared to February shown with arrows, please see background section for more information.

Figure 11.Proportion who reported concern about the safety of food produced in the UK
Note: The new data points (from January to March) are shown in a different colour. Q12. Thinking about food in the UK in general. At the moment, how concerned, if at all, do you feel about each of the following topics? Base: All in March 25 (n=2,051), February 25 (n=2,097), January 25 (n=2,080), December 24 (n=2,036), November 24 (n=2,022), October 24 (n=2,008), September 24 (n=2,014), August 24 (n=2,008), July 24 (n=2,070), June 24 (n=2,056), May 24 (n=2,067), April 24 (n=2,061), March 24 (n=2,015), February 24 (n=2,066), January 24 (n=2,038), December 23 (n=2,026), November 23 (n=2,064), October 23 (n=2,062), September 23 (n=2,057), August 23 (n=2,044) and July 23 (n=2,085). Respondents were shown all of the topics listed and asked how concerned, if at all, they felt about each. Figures shown in chart are the proportion ‘highly concerned’ or ‘somewhat concerned’. Differences compared to February shown with arrows, please see background section for more information.
Looking at data from January to March 2025 combined, respondents aged 16-34 and 35-54 and those limited by a health problem or disability were more likely to report being highly concerned about food prices and food poverty and inequality than those aged 55+ and those not limited by a health problem or disability (see Figure 12 and Figure 13).

Figure 12.Proportion who reported being highly concerned about food prices and food poverty and equality by age
Note: Q12. Thinking about food in the UK in general. At the moment, how concerned, if at all, do you feel about each of the following topics? Base. Those aged 16-34 (n=1,602), those aged 35-54 (n=1,878) and those aged 55+ (n=2,748) in January-March 2025. Figures shown in chart are the proportion ‘highly concerned’. Differences compared to the average shown with arrows, please see background section for more information.

Figure 13.Proportion who reported being highly concerned about food prices and food poverty and equality by limiting health problem or disability
Note: Q12. Thinking about food in the UK in general. At the moment, how concerned, if at all, do you feel about each of the following topics. Disability. Are your day-to-day activities limited because of a health problem or disability which has lasted, or is expected to last, at least 12 months? Base. Those limited a lot (n=607), those limited a little (n=1,249 and those not limited (n=4,324) by a disability or health problem in January-March 2025. Figures shown in chart are the proportion ‘highly concerned’. Differences compared to the average shown with arrows, please see background section for more information.
3.4. Food supply chain
As shown in Figures 14 and 15, overall confidence in the food supply chain, and confidence that those involved in the food supply chain ensure food is safe, high quality and affordable, increased from January to February 2025. Confidence in these measures in March remains higher than January.

Figure 14.Proportion who reported confidence in the food supply chain
Note: The new data points (from January to March) are shown in a different colour. Q13. How confident are you in the food supply chain? That is all the processes involved in bringing food to your table. Base: All in March 25 (n=2,051), February 25 (n=2,097), January 25 (n=2,080), December 24 (n=2,036), November 24 (n=2,022), October 24 (n=2,008), September 24 (n=2,014), August 24 (n=2,008), July 24 (n=2,070), June 24 (n=2,056), May 24 (n=2,067), April 24 (n=2,061), March 24 (n=2,015), February 24 (n=2,066), January 24 (n=2,038), December 23 (n=2,026), November 23 (n=2,064), October 23 (n=2,062), September 23 (n=2,057), August 23 (n=2,044) and July 23 (n=2,085).

Figure 15.Proportion who reported confidence that those involved in the food supply chain ensure that…
Note: The new data points (from January to March) are shown in a different colour. Q14. How confident are you that those involved in the food supply chain in the UK… Base: All in March 25 (n=2,051), February 25 (n=2,097), January 25 (n=2,080), December 24 (n=2,036), November 24 (n=2,022), October 24 (n=2,008), September 24 (n=2,014), August 24 (n=2,008), July 24 (n=2,070), June 24 (n=2,056), May 24 (n=2,067), April 24 (n=2,061), March 24 (n=2,015), February 24 (n=2,066), January 24 (n=2,038), December 23 (n=2,026), November 23 (n=2,064), October 23 (n=2,062), September 23 (n=2,057), August 23 (n=2,044) and July 23 (n=2,085).
3.5. The Food Standards Agency
As shown in Figure 16, among those with some knowledge of the FSA, trust in the FSA has risen over the past three months from 57% in December 2024 to 64% in March 2025.
.svg)
Figure 16.Proportion that trust the FSA to do its job (among those with knowledge of the FSA)
Note: The new data points (from January to March) are shown in a different colour. Q16. The Food Standards Agency (FSA) is the Government Agency responsible for food safety in England, Wales and Northern Ireland. How much do you trust or distrust the Food Standards Agency to do its job? That is to make sure that food is safe and what it says it is. Base: Those who know a little / a lot about the FSA in March 2025 (n=1,138), February (n=1,190), January (n=1,231), December 2024 (n=1,193), November (n=1,139), October (n=1,173) September (n=1,063), August (n=1,109), July (n=1,140), June (n=1,163), May (n=1,161), April (n=1,137), March (n=1,137), February (n=1,127) January (n=1,168) December (n=1,134), November (n=1,183), October (n=1,175), September (n=1,161) and August 2023 (n=1,126).
As shown in Figure 17, confidence that the FSA is committed to communicating openly with the public about food-related risks also increased from 64% in December 2024 to 70% in March 2025.

Figure 17.Proportion who reported confidence that the FSA is committed to communicating openly with the public about food-related risks (among those with knowledge of the FSA)
Note: The new data points (from January to March) are shown in a different colour. Q15. The Food Standards Agency (FSA) is the Government Agency responsible for food safety in England, Wales and Northern Ireland. How confident are you that the Food Standards Agency… Base: Those who know a little / a lot about the FSA in March 2025 (n=1,138), February (n=1,190), January (n=1,231), December 2024 (n=1,193), November (n=1,139), October (n=1,173) September (n=1,063), August (n=1,109), July (n=1,140), June (n=1,163), May (n=1,161), April (n=1,137), March (n=1,137), February (n=1,127) January (n=1,168) December (n=1,134), November (n=1,183), October (n=1,175), September (n=1,161) and August 2023 (n=1,126).

Figure 18.Proportion who reported confidence that the FSA protects the public from food-related risks (among those with knowledge of the FSA)
Note: The new data points (from January to March) are shown in a different colour. Q15. The Food Standards Agency (FSA) is the Government Agency responsible for food safety in England, Wales and Northern Ireland. How confident are you that the Food Standards Agency… Base: Those who know a little / a lot about the FSA in March 2025 (n=1,138), February (n=1,190), January (n=1,231), December 2024 (n=1,193), November (n=1,139), October (n=1,173) September (n=1,063), August (n=1,109), July (n=1,140), June (n=1,163), May (n=1,161), April (n=1,137), March (n=1,137), February (n=1,127) January (n=1,168) December (n=1,134), November (n=1,183), October (n=1,175), September (n=1,161) and August 2023 (n=1,126).

Figure 19.Proportion who reported confidence that the FSA takes appropriate action about identified food-related risks (among those with knowledge of the FSA)
Note: The new data points (from January to March) are shown in a different colour. Q15. The Food Standards Agency (FSA) is the Government Agency responsible for food safety in England, Wales and Northern Ireland. How confident are you that the Food Standards Agency… Base: Those who know a little / a lot about the FSA in March 2025 (n=1,138), February (n=1,190), January (n=1,231), December 2024 (n=1,193), November (n=1,139), October (n=1,173) September (n=1,063), August (n=1,109), July (n=1,140), June (n=1,163), May (n=1,161), April (n=1,137), March (n=1,137), February (n=1,127) January (n=1,168) December (n=1,134), November (n=1,183), October (n=1,175), September (n=1,161) and August 2023 (n=1,126).
Acknowledgements
FS code FS900280