


1. Executive Summary
1.1. Introduction
In 2010, the Food Standards Agency (FSA) launched the Food Hygiene Rating Scheme (FHRS), to help consumers make more considered choices about where they eat or purchase food. The FHRS is operated in partnership with local authorities (LAs) and the Welsh Government in Wales.
Establishments where food is supplied, sold or consumed are given a rating ranging from 0 to 5, with 5 indicating ‘very good’ food hygiene standards and 0 indicating ‘urgent improvement necessary’. In Wales and Northern Ireland, businesses are legally required to display their ratings in a prominent place at their premises. In England the scheme is voluntary, and businesses are encouraged to display their ratings. In all three countries, food hygiene ratings can be searched for on the FHRS website.[1]
The FSA has conducted research into the Display of Food Hygiene Ratings in England, Northern Ireland and Wales since 2011. The objectives of this year’s research were to:
-
Provide a representative estimate of the display of food hygiene rating stickers at physical premises.
-
Provide a representative estimate of the display of food hygiene ratings online.
-
Explore business awareness and attitudes towards the Scheme.
-
Explore the reasons and drivers behind display and non-display both at the premises and online.
Mainstage fieldwork occurred between October and December 2024 and comprised of two strands:
-
1,348 covert audits of food businesses in England, Northern Ireland and Wales.
-
1,349 telephone interviews of food businesses in England, Northern Ireland and Wales.
In total, 574 food businesses that participated in the survey were also audited.
1.2. Display of food hygiene ratings: audit results
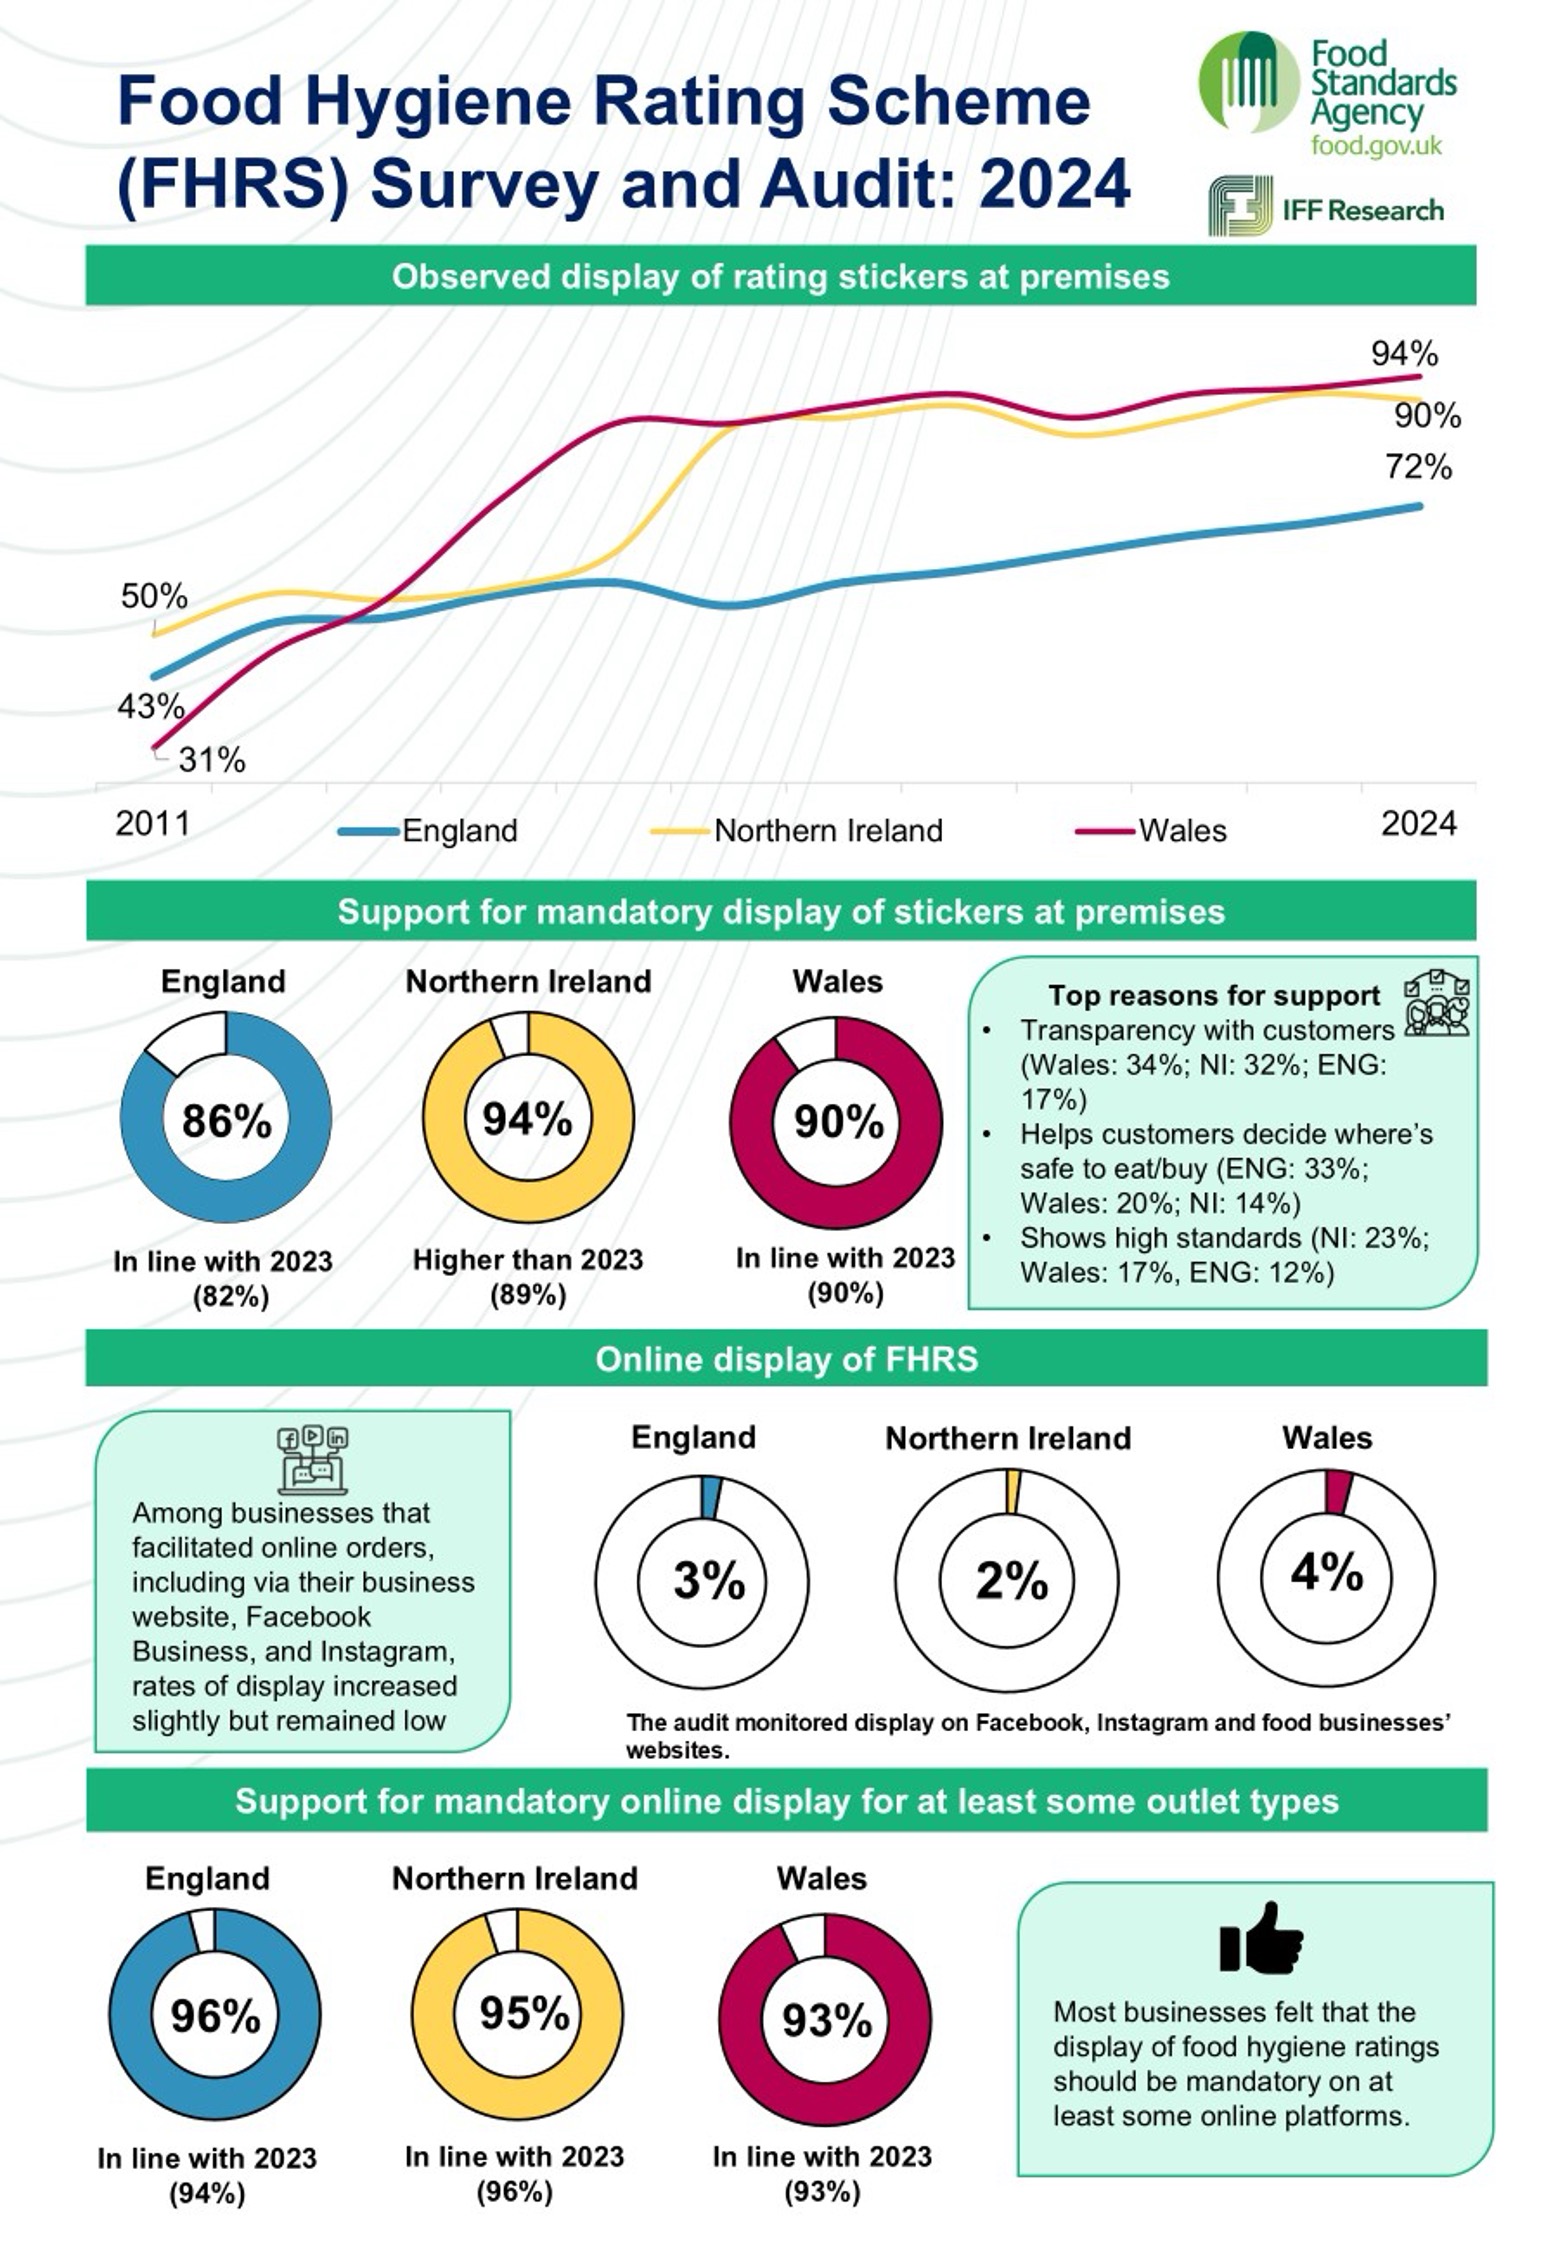
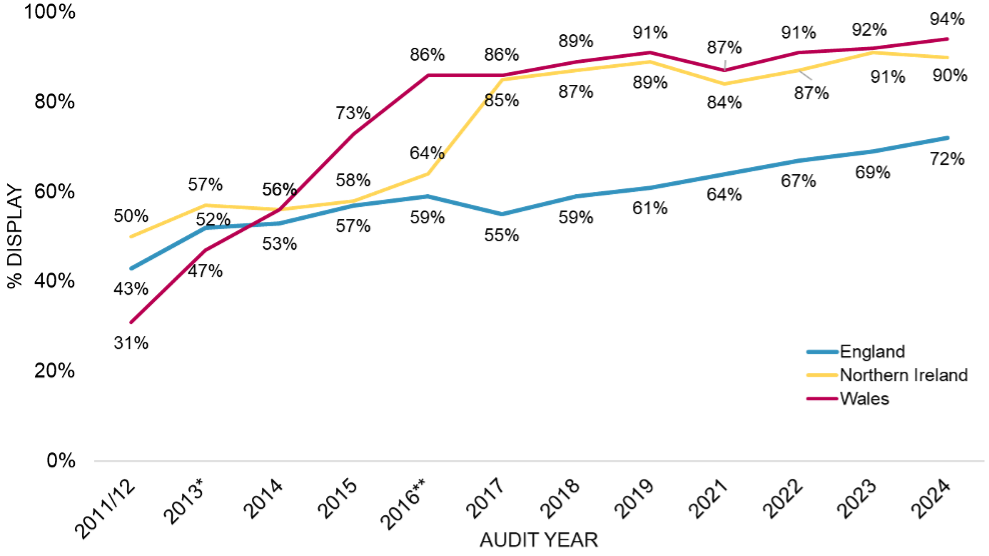
In England, around seven-in-ten (72%) food businesses were displaying a FHRS sticker either inside or in a location visible from outside their premises. Although not significantly higher than the observed rate of display in 2023 (69%), this represents a continuation of the steady upward trend in the rate of display in England in recent years, up from 55% in 2017. Two-thirds (66%) had a sticker displayed so it was visible from outside their premises, and around one in 20 (6%) displayed a sticker that was visible inside their premises, but not from outside.
The rates of display observed in Northern Ireland and Wales were significantly higher than in England, reflecting the legal requirement to display a rating sticker in Northern Ireland and Wales.
In Northern Ireland, 90% of businesses were displaying a sticker either inside or in a location visible from outside the premises (broadly consistent with 2023, 91%). More than eight in ten (82%) businesses had a sticker displayed so it was visible from outside their premises and 8% displayed a sticker that was visible inside their premises but not from outside.
In Wales, 94% of businesses were displaying a rating sticker either inside or in a location visible from outside the premises (broadly consistent with 2023, 92%). More than nine in ten (91%) of businesses had a sticker displayed so it was visible from outside their premises and 3% displayed a sticker that was visible inside their premises but not from outside.
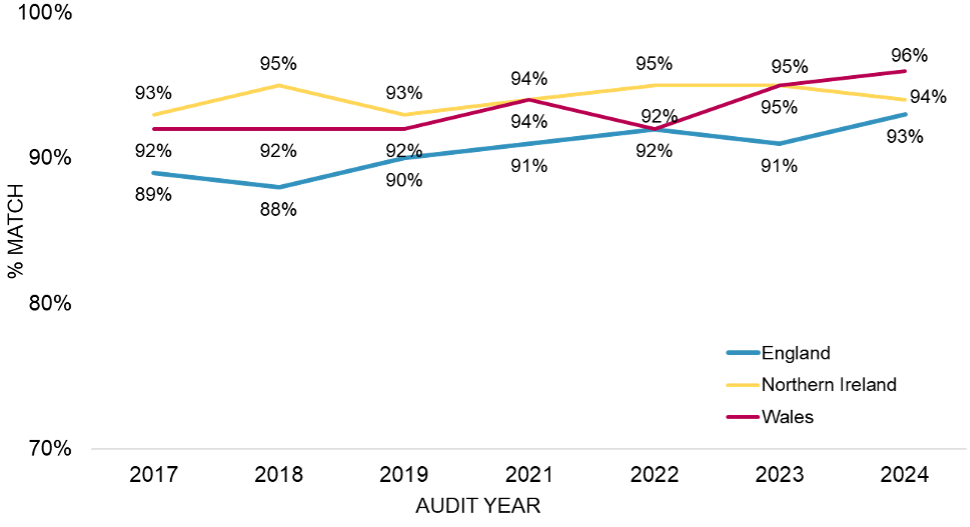
The vast majority of outlets displaying an FHRS sticker in England, Northern Ireland and Wales were displaying a rating that matched the FHRS database at the time of the audit (England: 93%; Northern Ireland: 94%; Wales: 96%). This is consistent with recent waves of the research.
1.3. Online display
In this wave, auditors conducted a more thorough online audit than in previous years, with the aim of better understanding the presence of food business operators, the facilitation of online orders, and the display of FHRS ratings on three prominent online platforms: Facebook business pages, Instagram profiles and businesses’ own websites. The audit explored the use of aggregators amongst food business operators, but not whether an FHRS rating was displayed as the format of how they display is already known.
In summary, findings from the audit and survey indicate that there is widespread use of social media platforms and websites, but relatively few businesses facilitate food orders or display ratings on these platforms.
In the online audit, across all three countries, around three quarters of businesses (74% in England, 75% in Northern Ireland and 75% in Wales) were observed to be active on at least one of the three online platforms of interest (Facebook business pages, Instagram profiles, and businesses’ own websites). However, among those present on any of these platforms, very few were displaying a rating online (3% in England, 2% in Northern Ireland and 4% in Wales). Additionally, only around one in eight businesses present on these platforms facilitated online orders through them (13% in England, 12% in Northern Ireland and 18% in Wales).
The online audit also found that a third (32%) of businesses in England, a fifth (19%) in Northern Ireland, and around a quarter (23%) in Wales used one of three major online food delivery aggregators: Just Eat, Deliveroo and UberEats. These results are comparable with 2023.
In the telephone survey, across England, Northern Ireland, and Wales, the majority of businesses felt that the display of food hygiene ratings should become mandatory for at least some online platforms (England: 96%; Northern Ireland: 95%; Wales: 93%). When asked more generally for their thoughts on the introduction of mandatory display for online ordering platforms, most businesses gave positive comments. Some noted that as a customer, using a digital platform should be no different from purchasing from a physical premises, especially due to the growing importance of online reviews and an online presence.
Similarly, in the telephone survey, attitudes were largely positive towards the idea of online food delivery aggregators displaying food hygiene ratings in a location where customers can see the rating without having to actively seek it out (e.g. behind a ‘click-through’). Around three quarters of businesses in England (72%) and Northern Ireland (72%) and two thirds of businesses in Wales (66%) considered this a good idea.
1.4. Awareness of the scheme and rating satisfaction
Awareness of the FHRS remains high, with 94% of establishments in both Northern Ireland and Wales reporting that they had heard of the scheme, and 91% in England. There was a slight drop in awareness in Wales, from a high of 97% in 2023 to 94% in 2024.
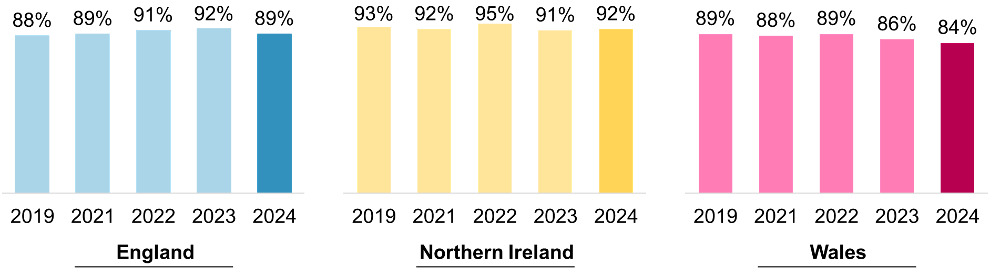
Nearly all (98%) businesses surveyed were aware of their food hygiene rating, and of those, nine in ten establishments in Northern Ireland (92%) and England (89%) reported being satisfied with their rating. In Wales, 84% were satisfied with their rating, which was the lowest level seen in the past few years. While not a statistically significant change compared with 2023, it did continue a gradual downward trend seen since 2022.
Businesses were asked to specify the lowest food hygiene rating they would be satisfied with. The picture was fairly consistent in England and Northern Ireland where around six in ten businesses (61% and 58% respectively) reported that they would only be satisfied with a rating of 5. A tiny minority (both 4%) reported they would be happy with a rating of 3. Contrastingly, 13% of businesses in Wales reported that they would be satisfied with a rating of 3 (with 50% only satisfied with a rating of 5).
1.5. Reported display of ratings and reasons for non-display
Self-reported display of ratings was higher than observed in the audit. Nearly all businesses in Northern Ireland and Wales (both 97%) reported displaying their rating where it is clearly visible to customers (compared to 90% and 94% observed in the audit). In England – where display is not mandatory - 86% of businesses reported displaying their rating (compared to 72% observed in the audit).
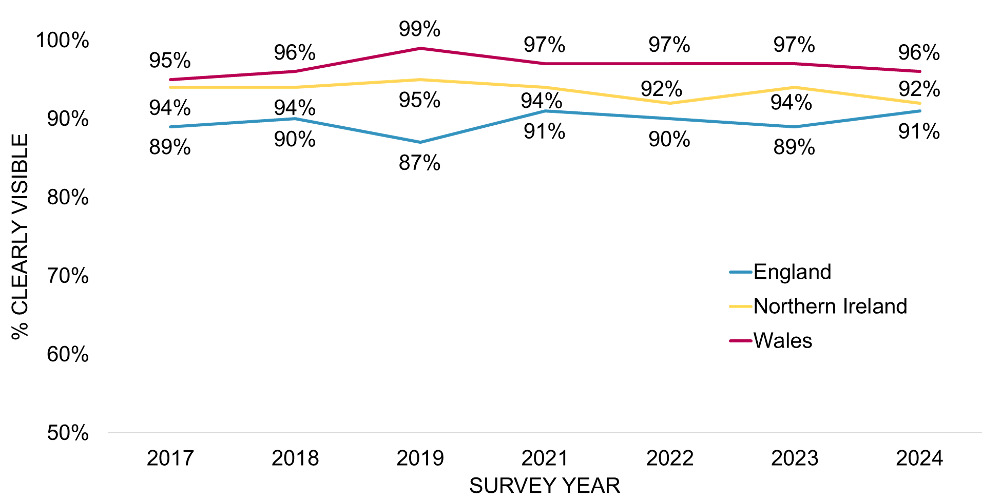
Businesses that reported clearly displaying their FHRS sticker were asked whether their sticker could be clearly seen by customers from outside their premises. Nearly all businesses in Wales (96%) reported that this was the case, with this proportion slightly lower, but still very high, in Northern Ireland (92%) and England (91%). All figures were broadly consistent with previous years.
Businesses in England gave a range of reasons for not displaying their FHRS sticker, with the most common response being that there was nowhere suitable for them to display it where their customers could clearly see it (17%). Ratings received also impacted likelihood to display (i.e. those awarded lower ratings were less likely to display it): when asked what actions might encourage businesses in England to display their FHRS sticker, the most common response was if they had a higher food hygiene rating (18%).
1.6. Attitudes towards mandatory physical display at food business premises
At least nine in ten food businesses in Northern Ireland (94% - the highest since 2017) and Wales (90% - in line with previous years) who were aware of their rating felt that the legal requirement to display their food hygiene rating sticker was ‘a good thing’. Most believed it was ‘very good’ (Northern Ireland: 78%; Wales: 75%). Around a third of businesses reported that this was due to the importance of being transparent with customers about food hygiene (Northern Ireland: 32%; Wales: 35%). In England, positive attitudes towards mandatory display were similarly high. Almost nine in 10 (86%) felt it would be a ‘good thing’ if they were required by law to display their food hygiene rating, continuing a gradual upward trend (from 65% in 2015). Most commonly, businesses in England reported that making rating display mandatory would help customers decide where it was safe to eat or purchase food (33%).
1.7. Awareness and ease of use of safeguards
When a business is dissatisfied with their food hygiene rating, they can exercise their right to appeal, right to reply or apply for a re-rating inspection. Among food business operators (FBOs):
-
Awareness of each safeguarding mechanism was relatively high. Awareness levels ranged from 79% to 80% in England, 88% to 89% in Northern Ireland, and 86% to 88% in Wales.
-
Despite high levels of awareness, only a small proportion of businesses rated 0-4 actually reported exercising a safeguarding option. The safeguard most commonly reported to have been used was the right to reply (19% in England, 15% in Northern Ireland and 21% in Wales). Both England and Wales saw an increase in the proportion who reported using this option compared to 2023. Around one in eight (13% in both England and Wales; 12% in Northern Ireland) said they had applied for a re-rating, while one in 10 in England (11%) and Wales (9%) said they had appealed their rating, with only a small minority doing so in Northern Ireland (2%).
-
Businesses gave a range of reasons for deciding not to use a safeguarding option. A common theme across each option was businesses saying they were making the changes required. The most common reason for not exercising the ‘right to reply’ was that businesses did not think it was necessary (15%), while concerns around the fee being too high (15%) was the most common reason for not applying for a re-rating (some LAs charge a fee for the re-rating service).
1.8. Perceived impacts of the scheme
Most businesses reported that they work hard to maintain or improve their food hygiene rating (98% of businesses in England and 97% in each of Northern Ireland and Wales).
Despite two-thirds reporting that displaying their food hygiene rating gave their business more customers (England 67%; Northern Ireland 71%; Wales 65%), only a minority actively used it as a promotional tool: around one in 10 food businesses in each nation (England: 11%; Northern Ireland: 10%; Wales: 12%) incorporated their food hygiene rating within promotional materials.
A rating of 4 or less prompted most FBOs to try to make improvements to their business in order to achieve a higher rating. Around nine in ten (89%) businesses in England and eight in ten in Northern Ireland (78%) and Wales (80%) reported making changes to the way they do things at their premises in order to improve their rating at the next inspection. This was consistent with 2023 findings. The most common changes businesses made were:
-
Undertaking repairs / improvement works (ranging from 20% to 29% by nation)
-
Improving documentation / record keeping (17% to 21%)
-
Fixing structural issues (19% each)
-
Purchasing additional equipment (9% to 26%)
1.9. Infographic

2. Introduction
2.1. Background to the FHRS
In 2010, the Food Standards Agency (FSA) launched the Food Hygiene Rating Scheme (FHRS). This was designed to help consumers make more considered choices about where they eat or purchase food by providing ‘at-a-glance’ information about the hygiene standards of food businesses as of their last inspection by their local authority’s food safety officer.
Under the scheme, establishments where food is supplied, sold or consumed are given a rating ranging from 0 to 5, with 5 indicating ‘very good’ food hygiene and 0 indicating ‘urgent improvement necessary’. The ratings are determined by three elements:
-
hygienic food handling;
-
physical condition of the premises and facilities; and
-
food safety management.
Figure 2.1 provides examples of the FHRS stickers currently in use in England and Northern Ireland (left) and Wales (right).
_and_wales_(right).jpeg)
In Northern Ireland (since 2016) and Wales (since 2013), establishments are legally required to display their food hygiene ratings in a prominent place, like the front door, entrance or window of the business where it can be easily seen and read by customers. They are also required to provide information on their rating verbally if requested to in person or over the phone. Businesses in England are not legally required to display their rating at their premises but are encouraged to do so. Across England, Northern Ireland and Wales, food hygiene ratings are available to search on the FSA’s ratings website. The FSA also provides guidance and a free toolkit to help businesses get the most from their food hygiene ratings.
In Wales, the scheme differs slightly in that it also applies to businesses that sell food to other businesses, including food manufacturers and wholesalers. Furthermore, establishments that supply takeaway food must include a bilingual statement on their menu leaflets and flyers. This instructs customers on how to find details of their food hygiene rating on the FSA’s ratings website, as well as reminding consumers that they have a legal right to ask the food business for their food hygiene rating when they order food.
2.2. Research objectives
The FSA has undertaken research into the display of Food Hygiene Ratings in England, Northern Ireland and Wales on an annual basis since 2011.
The research objectives in 2024 were to:
-
Provide a representative estimate of the display of food hygiene rating stickers at physical premises and online.
-
Explore business awareness and attitudes towards the Scheme, and the reasons and drivers for display and non-display both at the premises and online.
-
Provide the FSA with the robust insight they need to make any legislative changes (in particular relating to mandatory online display), and to support communications.
2.3. Methodology
In line with previous years of the study, a two-strand approach was adopted, consisting of:
-
A covert audit of 1,350 food businesses in England, Northern Ireland and Wales (450 in each nation), conducted by Mystery Shoppers. This included both an audit of the businesses’ physical premises and their website, Instagram or Facebook Business Page, where applicable.
-
A telephone survey of 1,350 food businesses in England, Northern Ireland and Wales, conducted by IFF Research (450 per nation).
This wave, the decision was made to reduce the total target number of surveys and audits from 1,500 to 1,350, in order to deliver the project within the budget available. This reduction in sample size had a negligible impact on confidence intervals by country; a sample of 500 carries a maximum margin of error of ±4.38% while a sample of 450 carries a maximum margin of error of ±4.62% (a difference of ±0.24%).
2.3.1. Sampling
For both the audit and telephone survey of food businesses, a sample was drawn from the FSA’s FHRS database. The sample consisted of food businesses that sell or serve food to the public and had received a food hygiene rating following an inspection by a food safety officer from a local authority.
Food businesses were excluded from the sample if they were a new business and had not yet been inspected and issued with a food hygiene rating. Food businesses were also excluded if they were not publicly accessible, a mobile food business or a food business within a residential property.
The initial sample for both the audit and the telephone survey of food businesses included the following outlet types:
-
Accommodation (e.g., hotels) and pubs, bars, and nightclubs
-
Restaurants, cafes, and other catering businesses (e.g., event caterers and home caterers)
-
Retail (e.g., supermarkets, butchers, and bakeries)
-
Takeaways and sandwich shops
The sample was then stratified within country, region, outlet type, and food hygiene rating to reflect the profile of the underlying population of food businesses across the three nations. Businesses in Northern Ireland and Wales, takeaways and sandwich shops and those with a food hygiene rating of 3 or less were oversampled due to historically lower than average response rates and – in some cases – a relatively low population.
The Technical Report that accompanies this main report contains more information on sampling for the 2024 wave of the FHRS Audit and Survey.
2.3.2. Fieldwork
A total of 1,350 food businesses participated in each of the audit and the telephone survey. Each commenced with a week-long pilot, with mainstage audit fieldwork occurring between 28 October and 12 December 2024, and mainstage telephone survey fieldwork occurring between 14 October and 29 November 2024. Upon completion of both the audit and telephone survey fieldwork periods, data quality checks meant that two records in Wales were removed from the audit data, and one record in Wales was removed from the survey data, giving final total figures of 1,348 audits and 1,349 telephone surveys.
The final profile of the audits and telephone interviews achieved by country, outlet type, food hygiene rating and number of employees are detailed in Table 2.1 to Table 2.4.
In total, 574 audited food businesses also took part in the telephone survey. Detail on the profile of these specific businesses is available in the 2024 Technical Report.
2.3.3. Data preparation
The audit and telephone survey results were weighted so that findings were representative of the underlying population of food businesses in terms of outlet type and food hygiene rating within England, Northern Ireland and Wales.
2.4. Reporting notes
Throughout the report the terms ‘business’, ‘establishment’, ‘premises’ and ‘outlet’ are used interchangeably to refer to food business sites.
In charts and tables:
-
↑ / ↓ denotes a significant difference compared to 2023
-
~ denotes findings should be treated with caution due to a low base size
-
* denotes figure is higher than the 2024 average for all three countries or individual countries (see graph notes for information); ** denotes figure is lower than the 2024 average for all three countries or individual countries (see graph notes for information)
All differences between sub-groups and previous waves of the research stated in this report are statistically significant at the 95% confidence level unless otherwise stated.
3. Audit of display of food hygiene rating stickers by country
This chapter covers the findings from the physical audits of food businesses in England, Northern Ireland and Wales. It provides comprehensive analysis of the prevalence of FHRS sticker display, the location of stickers on display and the accuracy of displayed ratings.
3.1. Rates of display
As presented in Figure 3.1, the vast majority of audited outlets in Wales (94%) and Northern Ireland (90%) and around seven in ten (72%) outlets in England were found to be displaying an FHRS sticker in a location visible from outside or inside the premises. The display rates observed in England and Wales in 2024 were the highest recorded since monitoring began in 2011. The rate of display in Northern Ireland remained consistent with 2023.
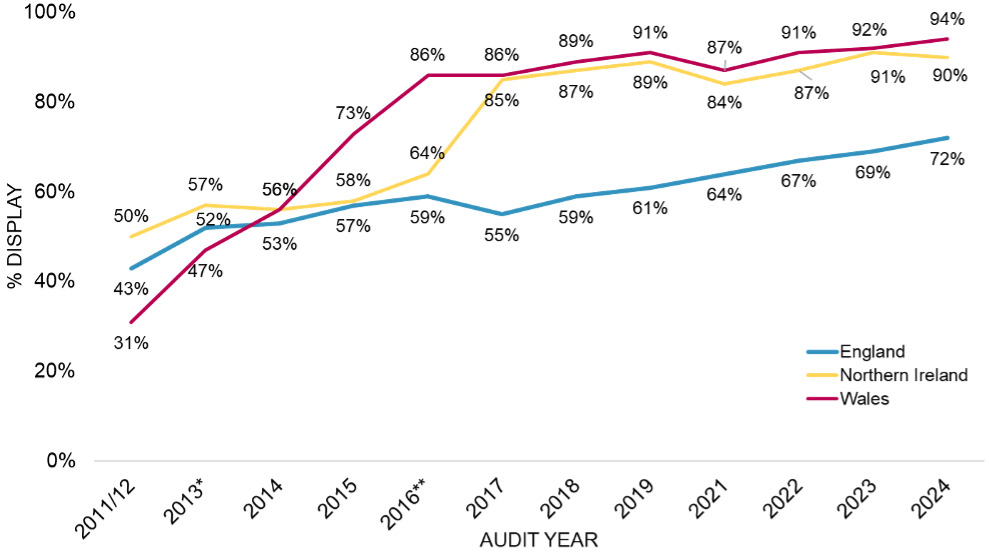
As in previous years, the rate of display observed in England remained lower than Northern Ireland and Wales, likely reflecting the absence of a legal requirement to display a rating sticker in England. In contrast, mandatory display in Northern Ireland and Wales appears to drive high levels of display, reinforcing the impact of regulatory measures on business practices.[3]
While rates of display were lower in England than in Northern Ireland and Wales, the proportion of outlets displaying a sticker has steadily increased in recent years. Between 2017 and 2024 the rate of display in England increased by 17 percentage points, from 55% to 72%. Focusing on 2024, restaurants, cafes and canteens in England were more likely than average to display a rating sticker (78%).
In Northern Ireland, following a significant increase between 2022 and 2023 (from 87% to 91%), the proportion of businesses displaying a sticker remained broadly consistent between 2023 (91%) and 2024 (90%). There was variation in rates of display between different outlet types in Northern Ireland in 2024. Nearly all takeaway and sandwich shops were displaying a rating (97%), while accommodation businesses, pubs, bars and nightclubs were less likely than average do so (83%). This marks the second consecutive year that these types of outlets have been less likely to display a rating.
In Wales, 94% of businesses were displaying a rating sticker either inside or in a location visible from outside the premises. While this does not represent a significant increase since 2023 (92%), this is the third consecutive year that the rate of display has increased, continuing an upward trend since 2021, when 87% of outlets displayed a rating. There was no variation in rates of display between different outlet types in Wales in 2024.
In England, the likelihood to display an FHRS sticker at the premises is linked to having a higher rating. Around eight in ten (79%) of those rated five in England were displaying a rating, dropping to 65% of those rated four and just under two fifths (38%) of those rated three. As shown in Figure 3.2, this pattern was not observed in Northern Ireland and Wales. Display rates remained consistent across different ratings demonstrating the increased transparency that mandatory display provides to consumers.

Across all three countries, the number of audited outlets with a rating of 2 or less was very low (England: 20; Northern Ireland: 6; Wales: 17). However, there was an indication that even the lowest-rated businesses in Northern Ireland and Wales displayed ratings, with all 6 in Northern Ireland and 15 out of 17 in Wales doing so. This compares to 6 out of the 20 businesses with a rating of 2 or less in England.[4]
The findings presented in Table 3.1 also highlight that a notable proportion of businesses were not displaying an FHRS sticker in a location visible from either outside or inside the premises: 28% in England, 10% in Northern Ireland, and 6% in Wales.
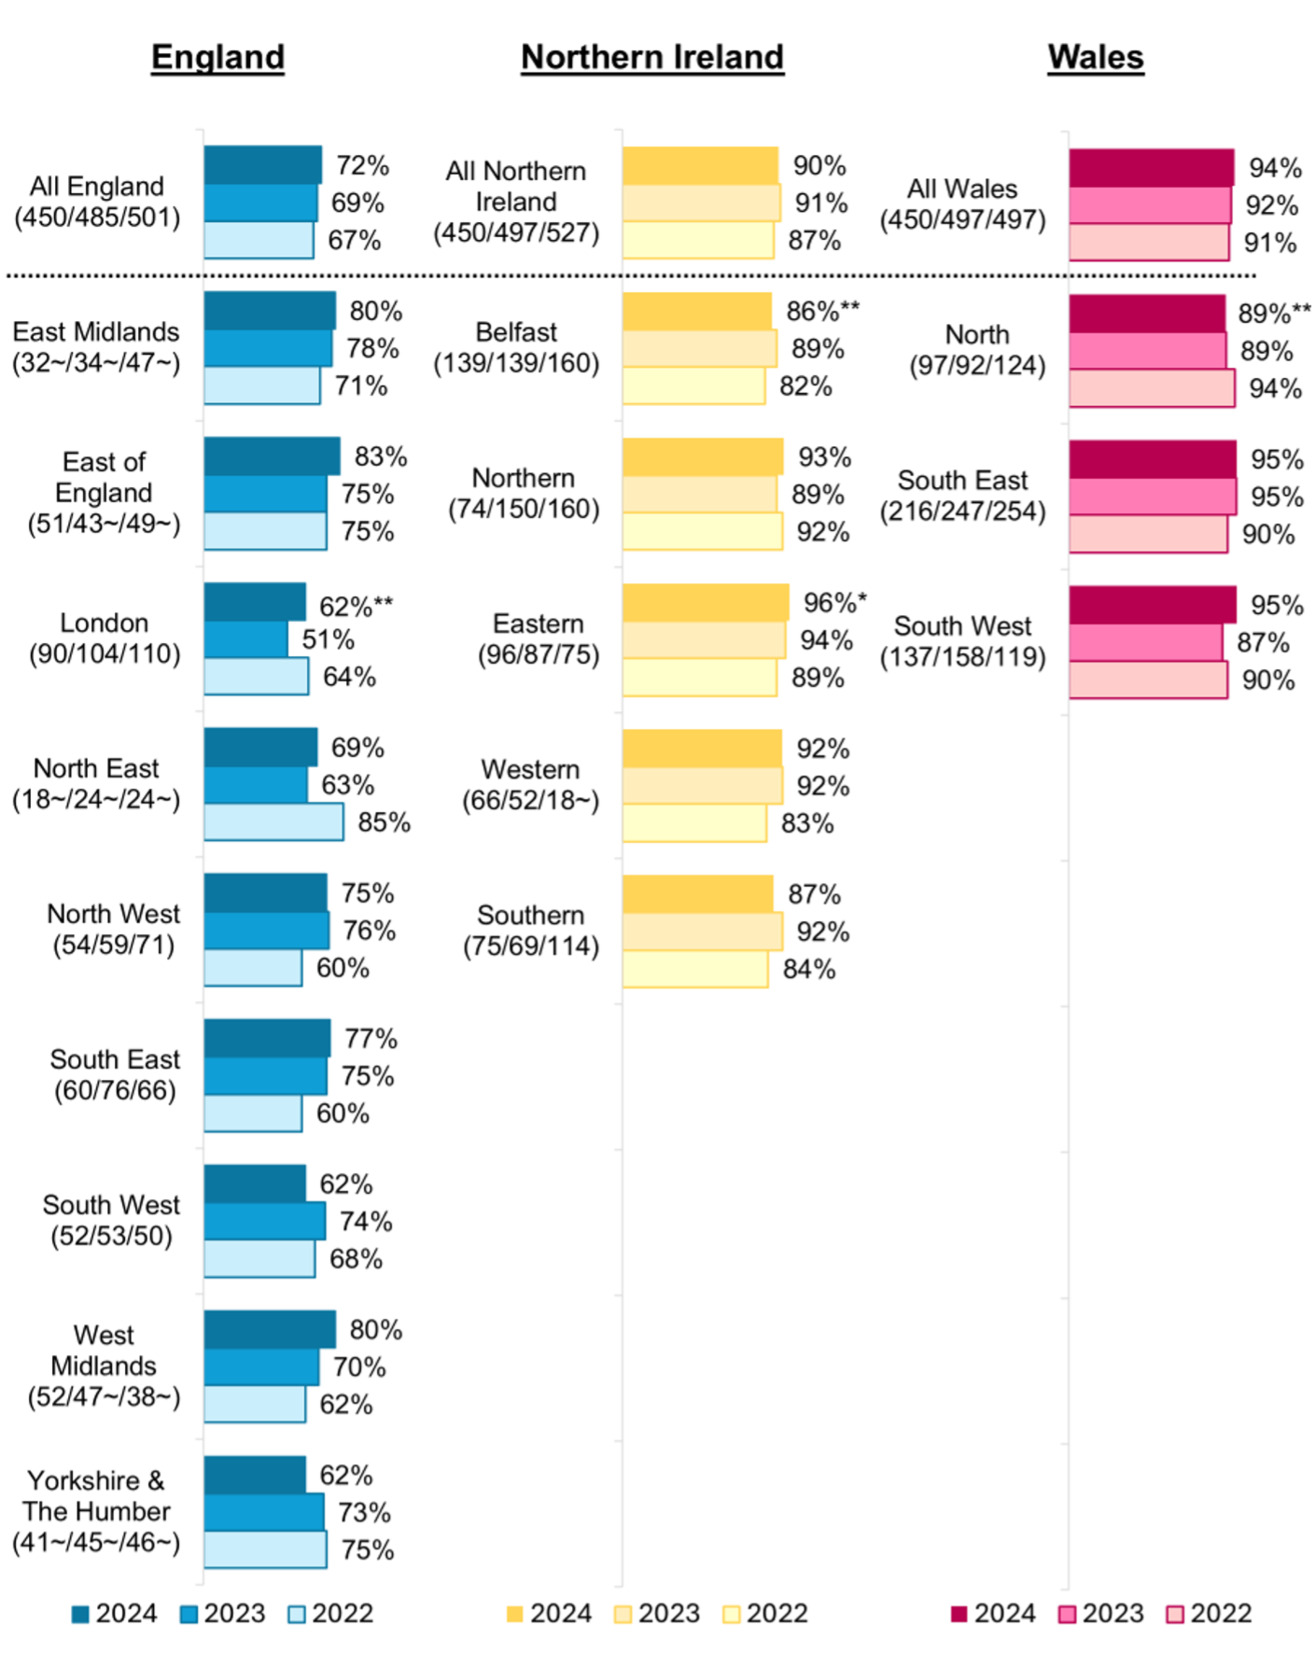
As shown in Figure 3.3, there was limited variation in rates of display between different regions. However, there was evidence that rates of display were lower in larger urban areas in England and Northern Ireland. For example, the rate of display in London (62%), and in Belfast (86%) were both lower than their respective national averages.
3.2. Whether rating sticker was clearly visible
The physical audits also captured whether FHRS rating stickers were visible from outside business premises and whether they were clearly visible to customers (either inside or outside).[5] As in previous years, the vast majority of FHRS stickers observed were clearly visible.
In England, 66% of businesses had a sticker on display that was visible from outside the premises. As presented in Table 3.2, this figure has steadily increased over the last few years, though not to a statistically significant degree. Around one in 20 businesses in England (6%) only displayed a sticker inside their premises, meaning their rating was not visible from outside. Irrespective of the location of display, around seven in ten businesses displayed a sticker in a location deemed ‘clearly visible’ by auditors (69%). Restaurants, cafes and other catering businesses (79%) and those with a rating of 5 (77%) were more likely to have an FHRS sticker displayed in a clearly visible location.
In Northern Ireland, 82% of businesses had a sticker visible from outside the premises, while 8% of displayed a sticker that was visible from inside only. This represents a notable shift from 2023, when 88% of businesses had a sticker visible from outside and only 3% displayed their sticker solely indoors. This change is partly due to a higher number of audited outlets without their own entrance in 2024 (15, compared to 5 in 2023). These outlets (such as kiosks and cafés within larger establishments) were not included in the “visible from outside” statistic, as they do not have a distinct entrance. Regardless of placement, around nine in ten businesses displayed a sticker in a location deemed ‘clearly visible’ by auditors (89%). Accommodation businesses and pubs, bars and nightclubs were less likely to have an FHRS sticker displayed in a clearly visible location (79%). There was no difference in terms of rating.
As presented in Table 3.4, the proportion of food businesses in Wales that had a sticker visible from outside increased slightly between 2023 (88%) and 2024 (91%), but not to a statistically significant extent. The number of businesses displaying a sticker only visible from inside (3%) and not displaying a sticker (6%) remained broadly consistent with findings in 2023. Overall, more than nine in ten businesses displayed a sticker in a location deemed ‘clearly visible’ by auditors (92%). There were no statistically significant differences in the likelihood to have an FHRS sticker displayed in a clearly visible location by outlet type or rating in Wales.
As depicted in Figure 3.4, businesses in England with a rating of 5 were more likely to display their sticker in a location visible from outside the premises (73%) compared to those rated 4 and below In contrast, there was no statistically significant variation by FHRS rating in Northern Ireland and Wales. While figures for businesses with a rating of 3 and below are included in Figure 3.4, they should be treated with caution due to the small sample sizes.

3.3. Whether the outlet displayed the correct rating
As shown in Figure 3.5, the vast majority of outlets displaying an FHRS sticker in England, Northern Ireland and Wales were displaying a rating that matched the FHRS database at the time of audit (England: 93%; Northern Ireland: 94%; Wales: 96%). This is consistent with recent waves of the research.[6]
As may be expected, of outlets displaying a sticker, almost all with a rating of 5 in England, Northern Ireland and Wales were found to be displaying a rating that matched the FHRS database (99% in England and Northern Ireland, and 98% in Wales).

A minority of outlets across England, Northern Ireland, and Wales were found to display an incorrect rating during the audit (England: 7%; Northern Ireland: 6%; Wales: 4%). Examining outlets from all three countries together, among those displaying an incorrect rating[7]: around two-thirds (65%) displayed a higher rating than recorded in the database, a fifth (21%) displayed a lower rating, and 8% displayed an awaiting inspection sticker (rating awaited in Wales)[8]. Additionally, four outlets were found to be displaying multiple stickers with different ratings. Of the 60 outlets displaying an incorrect rating sticker, the most common issue was outlets rated 4 displaying a rating of 5. Table 3.5 shows the incorrect stickers displayed by outlets across the three nations, split by their actual rating on the FHRS database at the time of audit.
4. Online display
This chapter explores both observed and self-reported usage of online platforms by food businesses, examining the extent to which they are used to facilitate orders and prevalence of FHRS rating display. It provides a comprehensive overview of various online platforms, including businesses’ own websites, social media, and food delivery aggregators. The chapter concludes with an assessment of attitudes towards FHRS ratings being displayed in readily seen locations on food delivery aggregators[9] and mandatory online display.
In this wave, auditors conducted a more thorough online audit than in previous years, with the aim of better understanding the online presence of food business operators, the facilitation of online orders, and the display of FHRS ratings on three prominent online platforms: Facebook business pages, Instagram profiles and businesses’ own websites. The audit also involved an assessment of the use of online food delivery aggregators.
Auditors focused on the immediate landing page on social media profiles (e.g., the Facebook business profile page, or the Instagram profile page). This approach differs slightly with the methodology used in 2023, which involved a more extensive search across social media profiles. By focusing on the landing page, the findings more accurately reflect the consumer experience when visiting online platforms. Methods of facilitating online orders through social media varied by platform but generally included a dedicated food order button, prominent links to food delivery aggregators, and written references to ordering via the platform’s messaging service. The audit of outlet’s own websites remained consistent with the methodology used in 2023, with auditors navigating to through the site to verify the online ordering function where applicable, and check for a rating. Further detail of the methodological approach to be online audit can be found in the technical report.
4.1. Display on social media and websites
Across all three countries, in line with findings from 2023, around three quarters of businesses (74% in England, 75% in Northern Ireland and 75% in Wales) were observed to be active on one of the three online platforms of interest (Facebook business pages, Instagram profiles, and businesses’ own websites).
Despite most audited businesses in all three countries using either Facebook, Instagram or their own website, only a small proportion of these outlets were found to be facilitating online orders through these channels (England: 13%; Northern Ireland: 12%; Wales: 18%) and even fewer displayed an FHRS rating online (England 3%, Northern Ireland 2%, Wales 4%). The rate of display increased slightly among businesses facilitating online orders through these channels, but was still low (England 6%, Northern Ireland 13%, Wales 7%). Among the limited number of businesses displaying a rating online, the most common methods were on the home page of their website or in the header image of their Facebook business page.
4.1.1. England
In England, most businesses were observed to have a presence on social media, with three fifths (60%) using a Facebook business page, and around two fifths (37%) using an Instagram page. While many had a page on either social media platform, very few were using them to facilitate online orders. As presented in Table 4.1, only 5% of those with a Facebook business page facilitated orders on this platform and only 4% of those with an Instagram page facilitated orders on this platform.
More than half (55%) of businesses had their own website. It was more common for outlets to offer online ordering through this platform. Around one in six (17%) businesses with a website allowed customers to complete orders online, making it a more frequently used platform for transactions compared to social media. This equates to 9% of all audited FBOs in England who allow online orders.
Overall, 7% of all audited FBOs in England only used their website to facilitate online orders (i.e. using no other platforms for online orders), alongside 1% who only facilitated orders via social media platforms.
Certain types of businesses in England had a notably stronger online presence. Almost all audited accommodation businesses, pubs, bars and nightclubs were active online (95%) and were more likely to operate on at least one of the three platforms (78% had a Facebook business page, 73% had a website, 58% had an Instagram page).
As may be expected, takeaways and sandwich shops stood out for their use of online ordering. Those with their own website were more likely to facilitate online orders (39%) than other types of outlets (e.g. vs 9% for accommodation businesses and pubs, bars and nightclubs). Additionally, a notable proportion (20%) with a Facebook business page enabled online orders through this platform, although the base size for this group was relatively low (n=39).
Among outlets in England with an online presence, just 1% displayed their rating on their Facebook business page, 3% on their website, and 1% on their Instagram page. Considering instead only those that were found to be facilitating online orders (n=45), 6% were displaying a rating online on any of the three platforms.[10]
4.1.2. Northern Ireland
In Northern Ireland, most businesses were observed to be using social media. Around two-thirds (65%) used a Facebook business page and around a third (30%) used an Instagram page. Among those with a presence on either social media platform, facilitation of online orders was uncommon (6% through Facebook and 6% through Instagram). Takeaways and sandwich shops (n=46) were more likely to facilitate online orders through their Facebook business page than other outlet types, though this still represented a relatively small proportion (13%). Compared to the use of social media, a smaller proportion of outlets (38%) in Northern Ireland had their own website, though it was more common for businesses to take online orders through this channel (21%).
In addition, there were 5% of all audited FBOs in Northern Ireland who only used their website to facilitate online orders (i.e. using no other platforms for online orders), alongside 1% who only facilitated orders via social media platforms.
Very few outlets with a presence on any of the three audited platforms were found to be displaying an FHRS rating online. None of the outlets with an Instagram page were displaying a rating on the site, while just 1% displayed their rating on their Facebook business page, and 2% on their website. Looking instead at only those that facilitated online orders (n=40), the proportion displaying a rating online (on any of the three platforms) increased to 13%.[11]
4.1.3. Wales
In Wales, most businesses had a social media presence; 62% of audited businesses had a Facebook business page, while 28% had an Instagram page. A small proportion of outlets were facilitating online orders on either social media platform (5% through Facebook and 5% through Instagram). Accommodation businesses, pubs, bars and nightclubs were more likely to have a presence on social media (81% had a Facebook business page, and 42% had an Instagram page). Half (51%) of the audited businesses in Wales had their own website, of which a quarter (24%) had online ordering functionality built in.
In addition, 10% of all audited FBOs in Wales only used their website to facilitate online orders (i.e. using no other platforms for online orders), alongside 1% who only facilitated orders via social media platforms.
As was the case in England and Northern Ireland, very few businesses in Wales were displaying a rating online. Among those present on each platform, an FHRS rating was visible on 2% of Facebook business pages, 2% of websites and 1% of Instagram pages. Considering only those that facilitate online orders on any platform (n=59), 7% were found to be displaying a rating on any of the three audited platforms.[12]
4.1.4. Reported use of online platforms to facilitate food orders
Businesses in the telephone survey were also more likely to report facilitating orders through an online ordering function on their own website than taking orders via social media. Three in ten (30%) outlets in England, two in ten (20%) in Northern Ireland and a quarter (26%) in Wales reported taking orders from customers on their website. Only a minority (England: 5%, Northern Ireland: 8%, Wales: 8%) reported that they facilitate orders through any of their social media accounts.
4.2. Use of online food delivery aggregators
4.2.1. Observed use of online delivery aggregators
As part of the online audit, checks were also conducted on the presence of businesses on three major online food delivery aggregators: Just Eat, Deliveroo and Uber Eats. A third (32%) of businesses in England, a fifth (19%) in Northern Ireland, and around a quarter (23%) in Wales used at least one of these platforms. The observed use of delivery aggregators in 2024 was comparable with the observed use in 2023, the first year this element of the audit was included.[13]
As shown in Figure 4.1, across all three countries, Just Eat was the most widely used food delivery aggregator (used by 23% of all audited businesses in England; 18% in Northern Ireland; and 19% in Wales), followed by Uber Eats (England 20%; Northern Ireland 8%; Wales 14%) and Deliveroo (England 14%; Northern Ireland 4%; Wales 8%).

As may be expected, the rate of use of online delivery aggregators varied considerably by outlet type. In England and Northern Ireland, takeaway and sandwich shops were more likely to use aggregators, with 57% in England and 39% in Northern Ireland present on at least one of the three platforms. Interestingly, in Wales, it was restaurants, cafes and canteens that were most likely to be using aggregators, at 30% compared to 23% on average.
4.2.2. Reported use of online delivery aggregators
In the telephone survey, online delivery aggregators were the most common platform that businesses reported using to facilitate online food orders. The reported use of aggregators to facilitate food orders was closely aligned to the findings from the online audit (England: 34%, Northern Ireland: 20%, Wales: 25%). Businesses that reported using online delivery aggregators were asked which platforms customers could order from. As shown in Figure 4.2, the survey results aligned with the online audit, confirming Just Eat as the most commonly used platform, followed by Uber Eats and then Deliveroo.

4.3. Attitudes towards online display
4.3.1. Attitudes towards mandatory online display
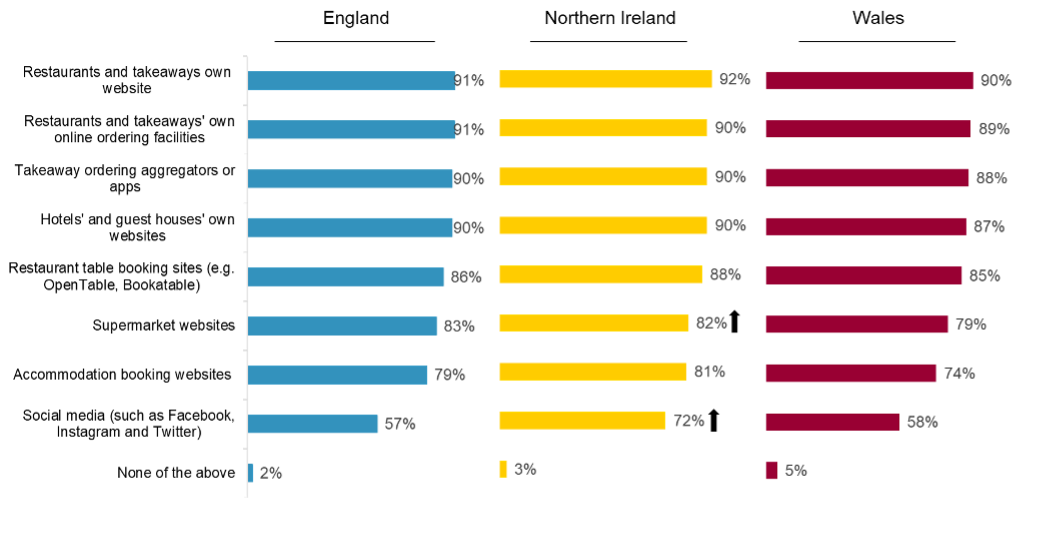
In the telephone survey, businesses across England, Northern Ireland and Wales were asked which online platforms they felt it should be required by law to display food hygiene ratings on. As shown in Figure 4.3, the majority of businesses agreed that it should be mandatory to display ratings on at least some online platforms, (96% in England, 95% in Northern Ireland and 93% in Wales).
Although there was an increase since 2023 in Northern Ireland, overall businesses were notably less supportive of mandatory display on social media than other platforms across the three nations (England 57%, Northern Ireland 72%, Wales 58%).

Support for mandatory display on online platforms varied between different outlet types. Retail businesses in England (100%) and takeaway establishments in Wales (100%) were more likely to be in support of mandatory online display while this was less likely to be the case among restaurants, cafés and other catering outlets across three nations (93% in both England and Northern Ireland and 90% in Wales).
Businesses that were supportive of mandatory online display typically felt it would benefit customers by providing them with information to inform purchasing decisions, while others said that it would be beneficial to their business as it would promote their high standards. Some noted that as a customer, using a digital platform should be no different to ordering from a physical premises.
“I would feel fine about it because we take our hygiene very seriously. That is why I wouldn’t accept anything less than 5 for our business, so I’m very proud to share it with our customer in any outlet.”
Retail, England, FHRS rating of 5
“It gives people confidence in the establishment, and it widens your audience. If they see it online, they will be inclined to use your establishment.”
Restaurant/café/canteen & catering, Northern Ireland, FHRS rating of 4
“It would be a fair thing to do. It would be just like walking into an establishment and seeing the FHRS score on the door.”
Accommodation & pub/bar/nightclub, Wales, FHRS rating of 5
The minority of businesses that were not supportive of mandatory online display often had concerns about the cost and complexity of implementing this change to their websites, social media platforms and other online platforms. Others took issue with mandatory online display because of reservations about the efficacy and fairness of the FHRS.
“Honestly that sounds like a lot of work for us, for not a lot of benefit. I don’t think it would make much difference with regards to how many customers come to us. Also, with regards to social media, trying to keep it visible without constant updates from us, would require a lot of work.”
Accommodation & pub/bar/nightclub, England, FHRS rating of 5
“I wouldn’t be happy about that because it would become almost like a league table of competition amongst businesses. There are a lot of implications associated with those numbers, for the businesses, and those implications do not always accurately reflect the quality of service provided. It doesn’t cover all bases. I mean my customer base is strong. The fact that I have a 1 does not put my customer base off as they like my service and the food that I serve here.”
Restaurant/café/canteen & catering, Wales, FHRS rating of 1
4.3.2. Attitudes towards display on online food delivery aggregators
In the survey, regardless of whether they currently used them, businesses were asked how they would feel about online food delivery aggregators displaying their food hygiene rating in a readily seen location, rather than behind a ‘click-through’ location.
Consistent with findings from 2023, businesses continue to think that displaying FHRS ratings more prominently would be a positive change. As shown in Figure 4.4, the majority of businesses considered this a good idea (72% in England, 72% in Northern Ireland, and 66% in Wales), with very few reporting that this would be a negative change (3% in England, 4% Northern Ireland, and 5% in Wales).

In England and Wales, businesses that already facilitate online ordering were more likely to be supportive of FHRS ratings being available in readily seen locations on aggregators (England: 80%, Wales: 78%) compared to businesses that did not facilitate online orders. Furthermore, takeaways and sandwich shops in England were more likely to have a positive perspective (82% reported this would be a good thing), likely because a larger proportion of this group allowed online orders (25%, compared to the average of 16%).
Across England, Northern Ireland, and Wales, support for the proposed change to make FHRS ratings more visible was closely linked to a rating. Businesses rated 5 were the most likely than average to have a positive perspective (76% in England, 75% in Northern Ireland, and 72% in Wales).
4.4. Reported online display
In the telephone survey, as in previous waves of this research, businesses reported higher rates of online rating display than the findings from the online audit (England: 29%, Northern Ireland: 26%, Wales 30%). This refers to the display of a rating on any online platform, which likely explains the difference between the self-reported rates of online display and the rates recorded in the online audit which only considered Facebook, Instagram and the businesses’ website. Businesses that reported displaying their rating online were asked to specify the platforms they used. As shown in Table 4.4, around half of these businesses reported displaying a rating on their own website with online ordering capabilities. Among the few businesses that both accepted orders through social media and reported displaying a rating online, most indicated that their FHRS rating was displayed on their social media page. However, due to the small sample size, these findings are indicative only.
4.5. Attitudes towards online display in the future
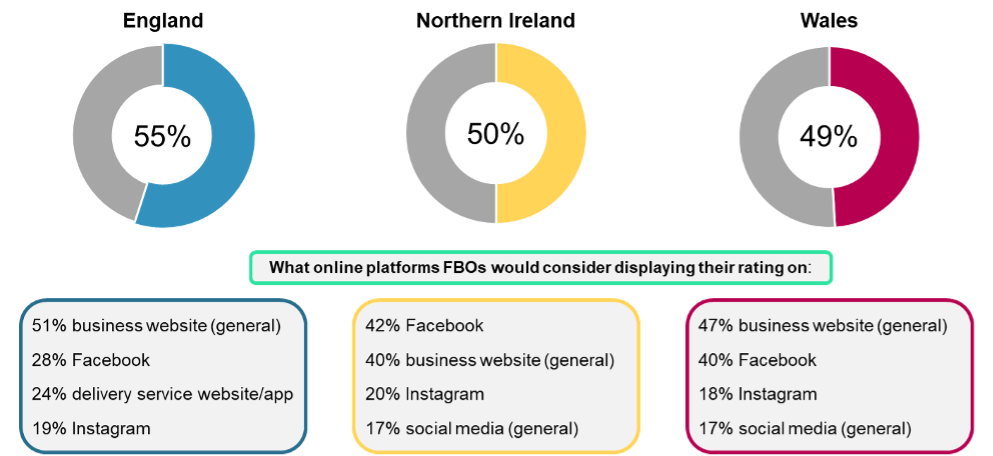
Businesses in the survey that reported not displaying their rating online were asked if they would consider doing so in the future. As shown in Figure 4.5, 55% of businesses in England, 50% in Northern Ireland and 49% in Wales said they would consider doing so. This is a significant increase in Northern Ireland and Wales since 2023 (both 40%).

Among businesses that would consider displaying their FHRS rating online in the future, the most common online platforms where they would consider display were their websites (England: 51%, Northern Ireland: 40%, Wales: 47%), Facebook profile (England: 28%, Northern Ireland: 42%, Wales: 40%) and third-party websites and apps (England: 24%, Northern Ireland: 16%, Wales: 14%). Across all the three countries, Instagram was also mentioned by 19% of businesses, alongside 15% that mentioned social media more generally.
5. Awareness of the scheme and satisfaction with ratings
Awareness of the FHRS among businesses is important to drive and maintain compliance with food hygiene standards. This chapter covers awareness of the scheme in England, Wales and Northern Ireland and explores businesses’ satisfaction with their ratings.
5.1. Awareness of the scheme
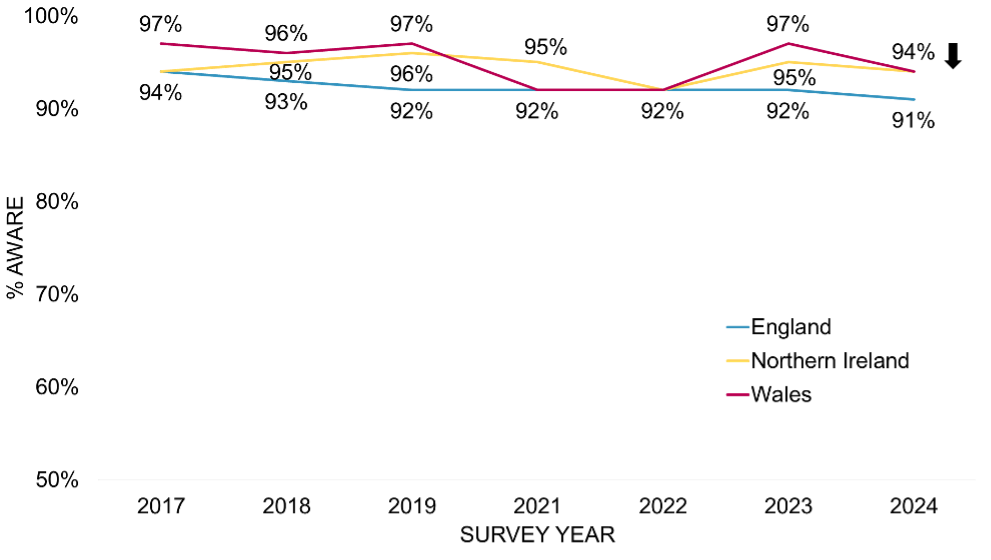
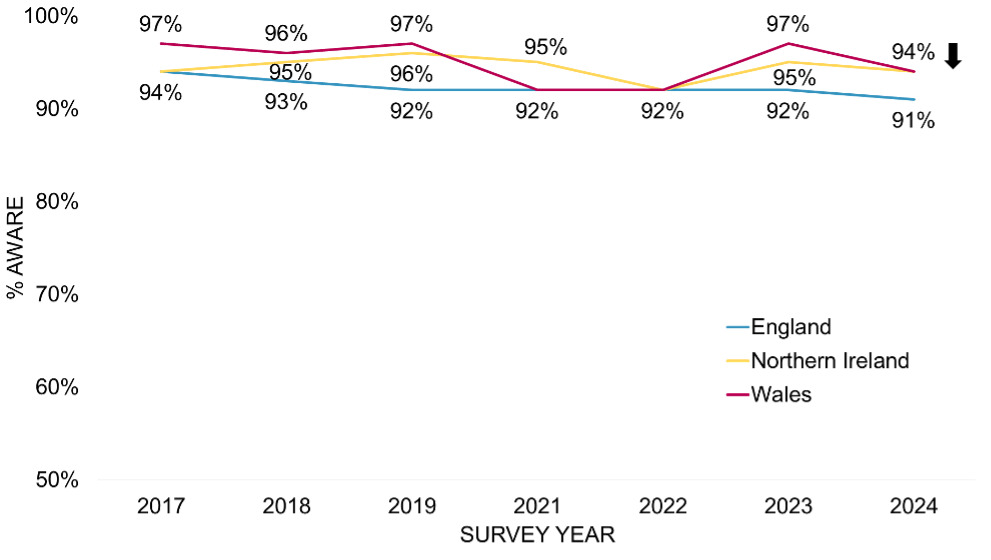
Awareness of the FHRS was very high, with 94% of establishments in Wales and Northern Ireland, and 91% in England reporting that they had heard of the scheme. Historically, awareness of the scheme has been slightly higher in Wales and Northern Ireland than in England (see Figure 5.1), likely reflecting their different legal requirements.
While awareness of the scheme is consistently high over time, there has been a slight drop in awareness in Wales this year, from 97% aware in 2023 to 94% in 2024. The apparent changes in Northern Ireland and England are not statistically significant.
Awareness of the scheme was high across food businesses, so there were only a handful of subgroup differences of note:
-
In England, awareness was lowest in London (81%), compared to average awareness across the country.
-
There were no subgroup differences of note in Northern Ireland.
-
In Wales, awareness was particularly high among independent businesses that are not part of a chain (96%, vs 92% of chain businesses).
As in previous years, slightly more businesses could recall receiving a food hygiene rating after interviewers referenced the green and black rating stickers (in England 95% vs. 91%, and in Northern Ireland and Wales both 97% vs. 94%). This suggests that a small minority were aware of the scheme but were unfamiliar with its official title.
5.2. Satisfaction with food hygiene rating
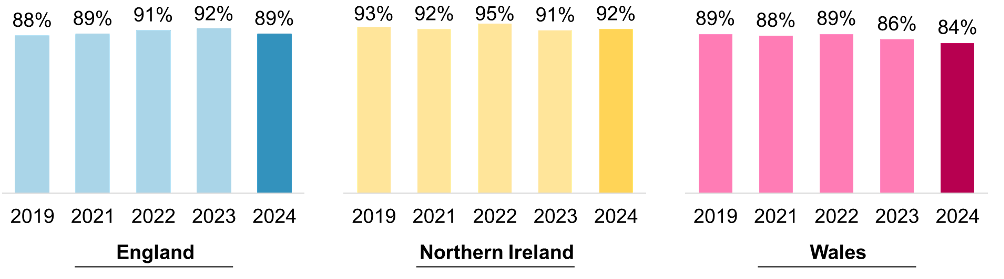
98% of businesses were aware of their food hygiene rating, and of those, most were satisfied with it, particularly in Northern Ireland (92%) and England (89%), as shown in Figure 5.2. In Wales, 84% were satisfied with their rating, which was the lowest level seen in the past few years. While not a statistically significant change compared with 2023, it did continue a gradual downward trend seen since 2022.[14]
Satisfaction with their food hygiene rating was lower among businesses with a rating lower than 5. Among food businesses rated 0-4, 65% of businesses in Northern Ireland were satisfied with their rating, with equivalent figures of 57% in England and 47% in Wales.
Across all ratings, a small number of businesses were not satisfied with their rating: 10% in England, 7% in Northern Ireland and 16% in Wales. The most common explanation in England and Wales was that the rating was lower than they expected. In Northern Ireland, the most common response was that they were marked down due to issues with their building or equipment. Other responses across all three countries included that they received a low rating, they felt the inspector or the rating was unfair, and that their rating had gone down.
5.3. Minimum satisfactory rating
Businesses were asked to specify the lowest food hygiene rating they would be satisfied with. As shown in Figure 5.3, around six in ten businesses in England (61%) and Northern Ireland (58%) reported that they would only be satisfied with a rating of 5, while half of businesses in Wales (50%) would only be satisfied with a rating of 5. Around a third of businesses considered a rating of 4 to be the minimum they would be satisfied with (England 33%; Northern Ireland 37%; Wales 36%). Very few in England and Northern Ireland would be happy with a rating of 3 (both 4%), while in Wales, 13% said they would be satisfied with this.

In all countries, businesses currently rated 5 were more likely to say they would only be happy with a rating of 5: this was the case for 75% in England, 68% in Northern Ireland and 66% in Wales, compared to 61%, 58% and 50% overall respectively.
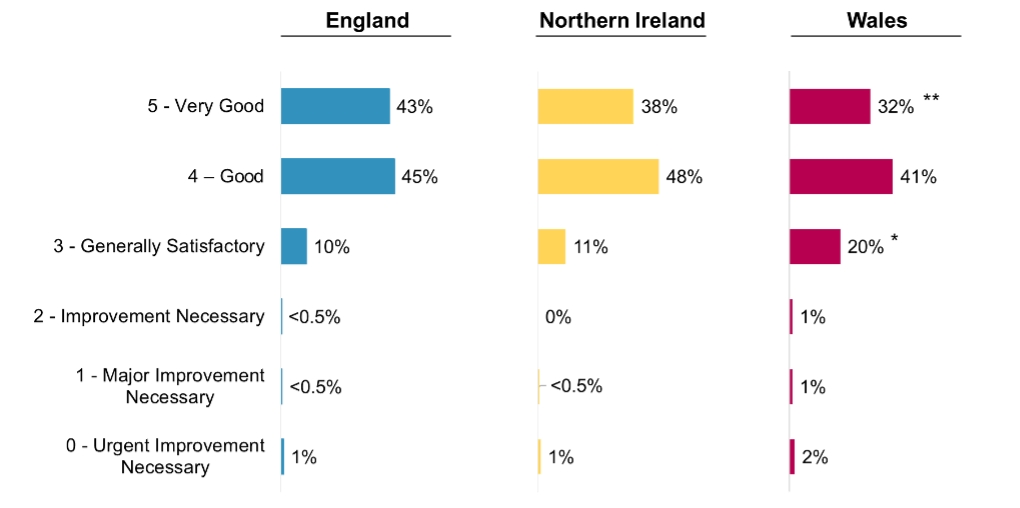
The survey also asked businesses what is the lowest Food Hygiene Rating that they would consider ‘good enough’ to display. As shown in Figure 5.4, most businesses considered only a 4 or 5 rating to be good enough. In England, 43% considered only a 5 to be good enough, and a further 45% would be happy to display a rating of 4. In Northern Ireland, these figures were 38% for a rating of 5 and 48% for a rating of 4.
Businesses in Wales appeared more willing to display lower ratings than those in England and Northern Ireland. While one in three (32%) in Wales said they would only consider a rating of 5 good enough to display, a further 41% would be happy to display a rating of 4, and one in five (20%) respondents in Wales considered 3 to be good enough. This compares to just one in 10 businesses in England and Northern Ireland (10% and 11% respectively) who would consider a 3 good enough to display. It was also higher than the proportion who said they considered a 3 good enough in Wales in 2023 (15%).

Across all countries, those currently rated 5 were more likely to say they considered only a 5 good enough to display (53% in England, 44% in Northern Ireland and 43% in Wales). In England and Wales, businesses that are part of a chain were also more likely to say that only a 5 is good enough to display (49% and 42% respectively, compared to 43% and 32% overall).
6. Reported display of rating and reasons for non-display
This chapter covers food businesses’ self-reported display of FHRS stickers according to survey findings. This includes reported display in a location that is clearly visible from outside the premises and (in Northern Ireland and Wales) and reported display of stickers at all entrances. The chapter also reports on the reasons some businesses do not display stickers and possible actions that could motivate businesses to start displaying their sticker in England, where display is not mandatory.
6.1. Stated display of stickers
Businesses that have a food hygiene rating were asked if their FHRS sticker is displayed somewhere where it is clearly visible to customers. As in previous years, reported display of FHRS stickers was higher among businesses in Northern Ireland and Wales (both 97%), compared to those in England (86%), where it is not a legal requirement to display it – see Figure 6.1. In England there was however an increase compared to 2023 (86% compared to 82% in 2023), bringing the reported display of stickers back in line with 2022 (87%). There were no changes in Northern Ireland or Wales, where reported display of FHRS stickers has been close to universal in all recent years in which the survey has run.

In England, visible display was strongly associated with the business’ FHRS rating. Over nine in ten (92%) with a rating of 5 reported displaying their FHRS sticker in a clearly visible location. This compared to 79% with a rating of 4, and 64% with a rating 3 or under. In Wales and Northern Ireland, there were no differences between businesses with different FHRS ratings as reported display was very high across the board.
Consistent with previous waves, reported display of stickers in the survey was higher than observed in the audit across all countries, where 72% of businesses in England, 90% in Northern Ireland and 94% in Wales were found to be displaying their rating.[15]
Examining the outlets that both completed the telephone survey and were visited in the physical audit across all three countries (n=574)[16], 84% that reported displaying a rating were confirmed to be doing so in the audit. In Northern Ireland and Wales, where display is mandatory, the proportion that reported displaying their FHRS rating and were found to be displaying during the audit was notably higher (91%). In contrast, only 70% of businesses in England reported displaying and had this confirmed in the audit.
Exploring the 16% where the survey and audit data conflicted:
-
8% of outlets reported displaying their rating but were found not to be displaying one when audited (this is reduced from 14% in 2023). This figure rose to 15% among businesses in England.
-
4% cent of outlets were unsure of their rating or whether they displayed it during the survey. However, nine of these 21 outlets were found to be displaying their rating when audited.
-
4% of outlets reported non-display, but five of these 25 businesses were found to be displaying when audited.
Businesses that reported clearly displaying their FHRS sticker were also asked whether their sticker could be clearly seen by customers from outside their premises. As shown in Figure 6.2, amongst those that reported displaying a sticker, 96% of businesses in Wales, 92% in Northern Ireland and 91% in England reported that the sticker could be seen before entering the premises, which is broadly consistent with the rates reported in 2023.
Businesses in Northern Ireland and Wales who stated that they displayed their sticker in a clearly visible location were also asked whether they had stickers at all entrances to their premises, providing they had a customer entrance. As shown in Figure 6.3, most of these businesses reported having an FHRS sticker at every entrance (89% in Northern Ireland and 86% in Wales). Around one in 10 businesses said they had a sticker displayed at some of their entrances but not all (10% in Northern Ireland and 12% in Wales) while very few reported not having a sticker displayed at any entrance (1% for both).

In both Northern Ireland and Wales, retail businesses who said they displayed a sticker were more likely to report having one clearly displayed at all entrances (97%). In Wales, accommodation and bars were much less likely to say this was the case (76%).
When looking at all surveyed businesses in Northern Ireland and Wales with multiple customer entrances, self-reported display at all entrances dropped quite considerably, to 54% in Wales and 57% in Northern Ireland.
6.2. Reasons for not displaying stickers
Businesses stating that they were not currently displaying their FHRS rating in a clearly visible location were asked why not and what might encourage them to do so.
As shown in Figure 6.4, the most common reason for non-display among businesses in England was having nowhere suitable to show it (17%). This was followed by never having received a sticker, stating that it was not relevant to their business and having a business policy not to display ratings (all 11%).
.svg)
Owing to higher rates of public display in Northern Ireland and Wales compared to England, the volume asked for their reasoning behind non-display was low, and therefore findings should be treated indicatively. Nevertheless, the most common reasons in Wales and Northern Ireland for non-display included: there was nowhere suitable to show the sticker; the sticker was only displayed inside the premises; and that the rating was not relevant to their business.
6.3. Actions to encourage display
As shown in Figure 6.5, there were a variety of responses when businesses in England not currently displaying their rating were asked what might encourage them to do so.
While the most common response was a better food hygiene rating (18%), others said they had not yet received their sticker (8%) or had lost it and would display it when they have received it (7%). A further 7% said the rules of their premises did not allow them to display their sticker.
.svg)
7. Mandatory display at food business premises
In Northern Ireland and Wales, food businesses are legally required to display their food hygiene rating sticker in a prominent place that is visible at every entrance. In England, businesses are not legally required to display their rating but are encouraged to do so. This chapter explores awareness and attitudes towards mandatory display.
7.1. Awareness of and attitudes towards mandatory sticker display in Northern Ireland and Wales
Almost all food businesses in Northern Ireland (97%) and Wales (98%) that were aware of their FHRS rating reported being aware of the legal requirement to have their food hygiene rating sticker on display, in line with previous years.
As illustrated in Figure 7.1, at least nine in 10 food businesses in Northern Ireland (94%) and Wales (90%) who were aware of their rating felt that the legal requirement to display their food hygiene rating sticker was ‘a good thing’, and most believed it was ‘very good’ (Northern Ireland: 78%; Wales: 75%). The proportion of businesses in Northern Ireland that considered mandatory display to be a good thing was the highest it had been since 2017, while the figure in Wales was in line with previous years’ findings.

In both Northern Ireland and Wales, those with a rating of 5 were more likely to consider mandatory display a good thing (96% in Northern Ireland and 92% in Wales), as were businesses who were part of a chain (98% in Northern Ireland and 96% in Wales).
The main reason for feeling positive about mandatory display in Northern Ireland and Wales was transparency with customers about food hygiene (32% in Northern Ireland and 35% in Wales). Other reasons – as shown in Figure 7.2 – included showing customers that the business has high standards, helping customers decide where is safe to eat or buy, and ensuring trust or confidence among customers.

Amongst the small number of businesses in Northern Ireland and Wales that did not think mandatory display was a good thing, the main reasons were because they felt customers do not pay attention to the ratings, or because they thought there were flaws in the way businesses are scored:[17]
-
In Northern Ireland, 20 businesses did not think mandatory display was a good thing. This included 8 who said customers don’t pay attention to the scores, 5 who thought the mandatory nature made no difference as they do it anyway, and 7 who gave a variety of other responses or said they were unsure.
-
In Wales, 36 businesses did not think mandatory display was a good thing. This included 10 who said there are flaws in the way businesses are scored, 10 who thought it is unfair to some businesses, 8 businesses who said it makes no difference as they display their rating anyway, 7 who said customers don’t pay attention to the scores, and 6 who thought people don’t understand the scores.
7.2. Attitudes towards introducing mandatory sticker display in England
As presented in Figure 7.3, more than four in five businesses in England (86%) agreed that the introduction of a scheme where they are required by law to display their food hygiene rating sticker was a ‘good thing’, with the majority (64%) considering it to be a ‘very good’ concept. Although this appears to be an increase from 82% in 2023, the difference is not statistically significant. However, there has been an overall upward trend in positive sentiment towards mandatory display in England over the time that the survey has been running.

Businesses in England with the highest rating of 5 were more likely to consider mandatory display to be a good thing (91%), compared to 77% with a rating of 4 and 67% with a rating of 3 or less (this is made up of 21 out of 36 with a rating of 3 and 9 out of 14 with a rating of 0-2[18]). There was a similar finding for those taking online food orders (89%, compared to 82% who do not).
Positive attitudes towards introducing mandatory display in England typically centred around the themes of transparency, maintaining or improving business standards, and consumer empowerment. As presented in Figure 7.4, the most common reason for support of mandatory display was helping customers decide where is safe to eat or buy (33%), followed by transparency with customers about hygiene (17%). The only significant change in businesses’ views since 2023 was that driving standards and maintaining high standards was mentioned by just 11% this year, slightly fewer than the 16% who gave this response last year.
.svg)
Among the 49 businesses that were either neutral or had negative perspectives towards mandatory display, the most common reasons for these perceptions were that customers do not pay attention to them (23%), that it is unfair to some businesses (18%), and that it is not necessary because they display their rating anyway (13%), as shown in Figure 7.5.
.svg)
8. Awareness and ease of use of safeguards
Once businesses have been inspected by a local authority, they are sent a letter to notify them of their rating and the improvements required if their rating is less than the top rating of 5 (very good). If a business is dissatisfied with their rating, they can exercise their right to appeal, right to reply or apply for a re-rating inspection.[19]
This section covers food businesses’ awareness of the inspection report letter, and of the options available if they wish to challenge their given rating. It also presents the proportion of businesses who reported using the safeguards, their experience of using them and barriers of safeguard usage.
8.1. Recollection of inspection report letter
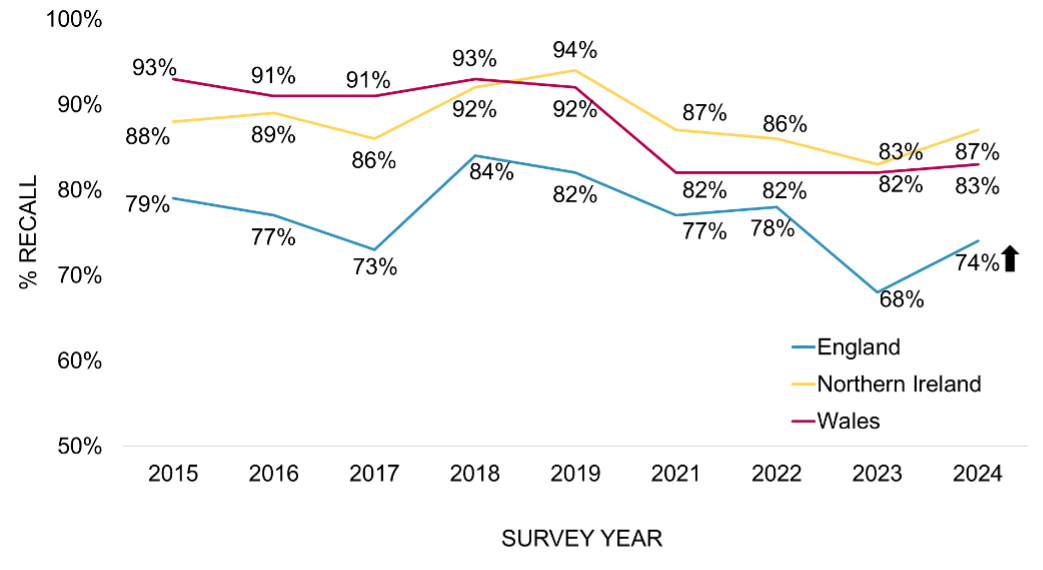
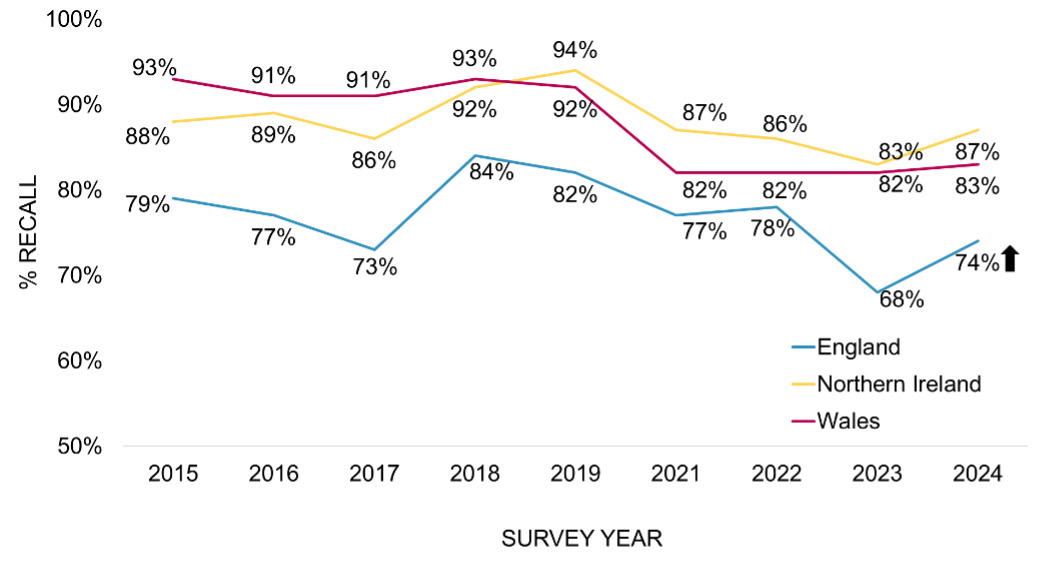
The majority of businesses recalled receiving an inspection report letter, although this varied by country. As shown in Figure 8.1, more than four fifths (83%) of businesses in Wales recalled receiving an inspection report letter, and this figure remains almost consistent since 2021. In Northern Ireland recall increased to 87%, bringing it back in line with 2021 and 2022 after last year’s dip; this increase was not statistically significant however. Three quarters (74%) of businesses in England recalled receiving an inspection report letter, higher than in 2023 (68%).
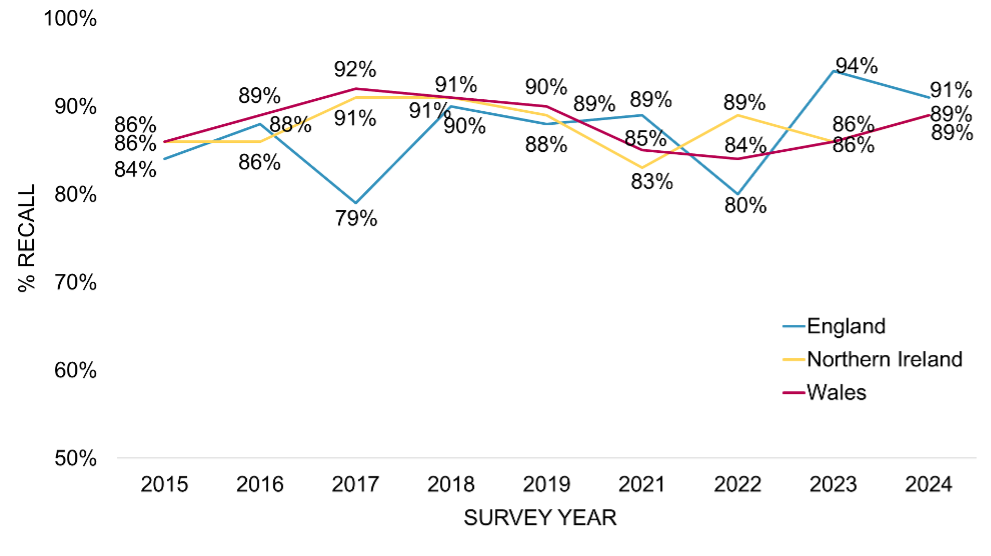
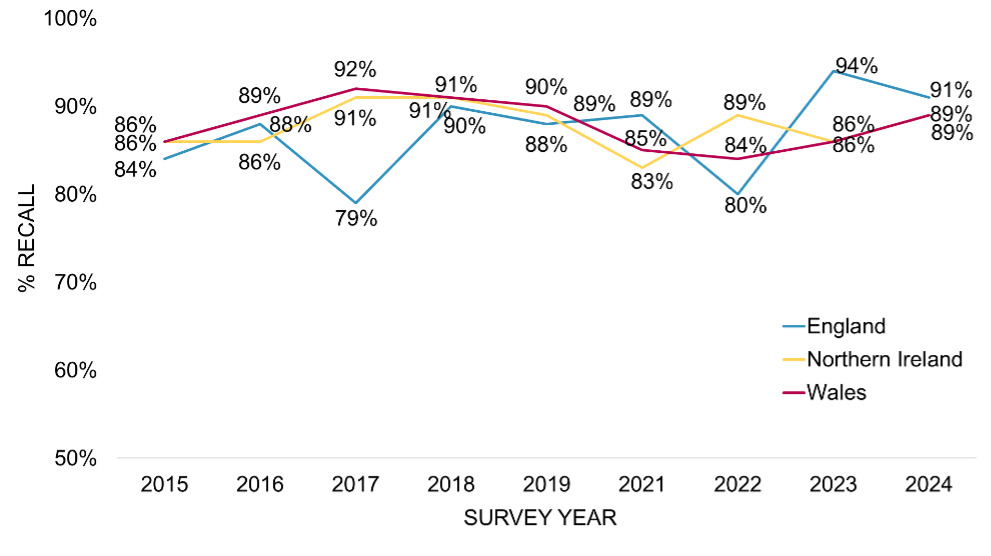
Of businesses that had received an inspection letter and had an FHRS rating of less than 5, the majority were able to recall the letter that informed them of the necessary improvements to achieve a food hygiene rating of 5 (England 91%; Northern Ireland 89%; Wales 89%), as seen in Figure 8.2. Businesses in Northern Ireland and Wales both saw slight increases in recall, whilst FBOs in England saw a slight decrease; no changes in recall were significant.
8.2. Awareness of safeguards
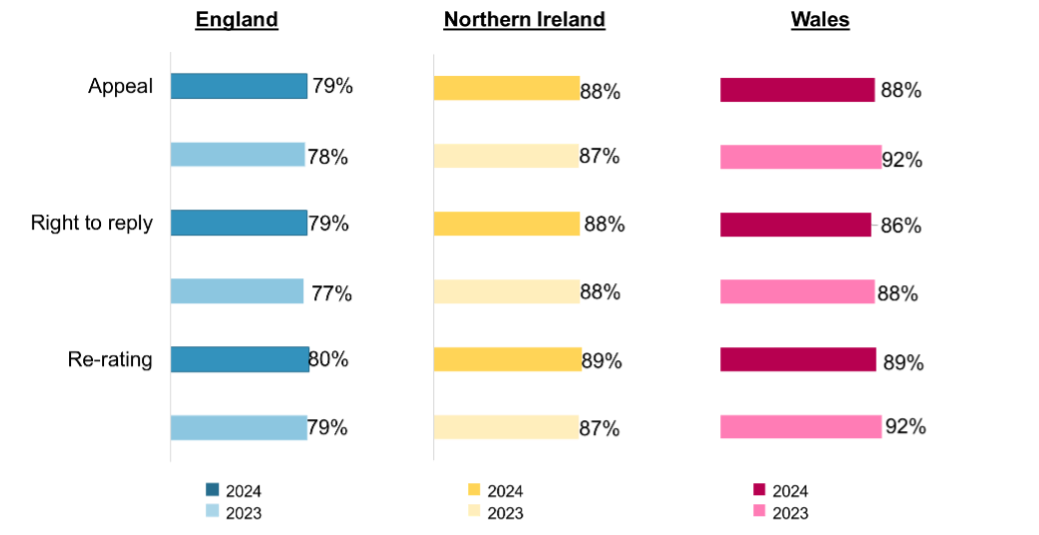
Overall awareness of the three safeguards (appeal, the ‘right to reply’ or requesting a re-rating) available to food businesses with ratings of 0-4 was relatively high across all three nations (see Figure 8.3). Around eight in 10 of businesses with any rating in England were aware of each option (79% for appeal, 79% for ‘right to reply’ and 80% for re-rating), all up from the awareness levels reported in 2023. Close to nine in ten were aware in Northern Ireland (88% for appeal, 88% for ‘right to reply’ and 89% for re-rating) and Wales (88% for appeal, 86% for ‘right to reply’ and 88% for re-rating).

8.3. Use and experience of safeguards
All food businesses that reported being aware of the ability to appeal ratings, exercise a ‘right to reply’ or apply for a re-rating were asked if they had used any of these safeguards following their most recent inspection. The following results are reported amongst only those businesses who received a rating of 0-4.
8.3.1. Appealing ratings
Despite high levels of awareness of the ability to appeal ratings, only a small proportion of businesses actually reported appealing their rating (England 11%; Northern Ireland 2%; Wales 9%) (see Table 8.1).
Businesses with ratings of 0-4 in England and Wales were significantly more likely to report appealing their rating than those in Northern Ireland. Of the few businesses with a rating of 0-4 who had requested an appeal of their rating, most were either still waiting to hear about the outcome of their appeal, or their rating was unchanged.
-
In England, 12 businesses appealed their rating. Of these, four were awarded a higher rating, two said their rating remained the same, two were still waiting to hear the outcome of their appeal and one was awarded a lower rating. The other three businesses were unsure on the outcome.
-
In Northern Ireland, of the nine businesses who appealed, six were awarded a higher rating and three were still waiting to hear the outcome of their appeal.
-
In Wales, of the 18 businesses who appealed, eight were awarded a higher rating, three had their rating stay the same and one business was given a lower rating. Three awaiting an outcome and a further three were unsure of the outcome.
8.3.2. Exercising right to reply
The ‘right to reply’ is the safeguard most reported to have been exercised across the three nations, with one in five doing so in England (19%), Wales (21%) and Northern Ireland (15%) – see Table 8.2. Although England and Wales appeared to see an increase in the proportion of businesses who reported exercising their right to reply compared to 2023, none of the changes since last year are statistically significant.
8.3.3. Applying for a re-rating
Despite having the highest awareness levels of the three safeguards overall, only just over one in 10 businesses across the three nations reported applying for a re-rating (England 13%; Northern Ireland 12%; Wales 13%) (see Table 8.3).
8.4. Non-use of safeguards
For those businesses who reported not using any of the safeguards available, they were asked why this was the case. Sample sizes by each country were low for non-use of appeals (England n= 24; Northern Ireland n= 25; Wales n= 41), right to reply (England n= 19; Northern Ireland n= 17; Wales n= 31) and re-ratings (England n= 26; Northern Ireland n= 22; Wales n= 40), so the following results are presented for all three countries combined. The following results are also reported amongst only those businesses who received a rating of 0-4.
8.4.1. Appealing ratings
As shown in Figure 8.4, the main reason given for not appealing the rating awarded was they were already making the changes required, cited by a quarter (25%) of businesses rated 0-4 across England, Wales and Northern Ireland. Around one in eight (13%) reported that either it did not matter enough, or that they did not consider their rating to be low enough to apply for an appeal. In addition, 5% of businesses rated 0-4 also mentioned cost as a reason for not appealing, implying that there is a lack of understanding from a small number of businesses around the appeals process as there is no associated cost.
.svg)
8.4.2. Exercising right to reply
Around one in seven (15%) businesses rated 0-4 across the three nations who were dissatisfied with their rating but did not exercise their right to reply said that they did not think it was necessary to do so – see Figure 8.5. Other primary reasons businesses gave included that they were making the required changes (14%) and that they had accepted their given rating (11%).

8.4.3. Applying for a re-rating
The most common reasons for businesses rated 0-4 not applying for a re-rating were because the fees were too high (15%), there being no point until relevant changes were made (13%), and waiting until the next inspection (12%), as shown in Figure 8.6. A further one in 10 said they had other priorities, or that it didn’t matter enough (both 10%).

9. Impacts of the scheme
This chapter explores businesses’ perceptions of the impact that the scheme has on them and their customers. It starts by reporting businesses’ attitudes towards the FHRS and their use of food hygiene ratings for promotion. It then goes on to explore changes made by businesses with a food hygiene rating of less than 5 in order to improve their rating at the next inspection.
9.1. Business and customer perceptions of food hygiene ratings
Most businesses reported being motivated to maintain or improve their food hygiene rating. They felt that displaying their rating had a range of positive impacts on customers’ perceptions of their business.
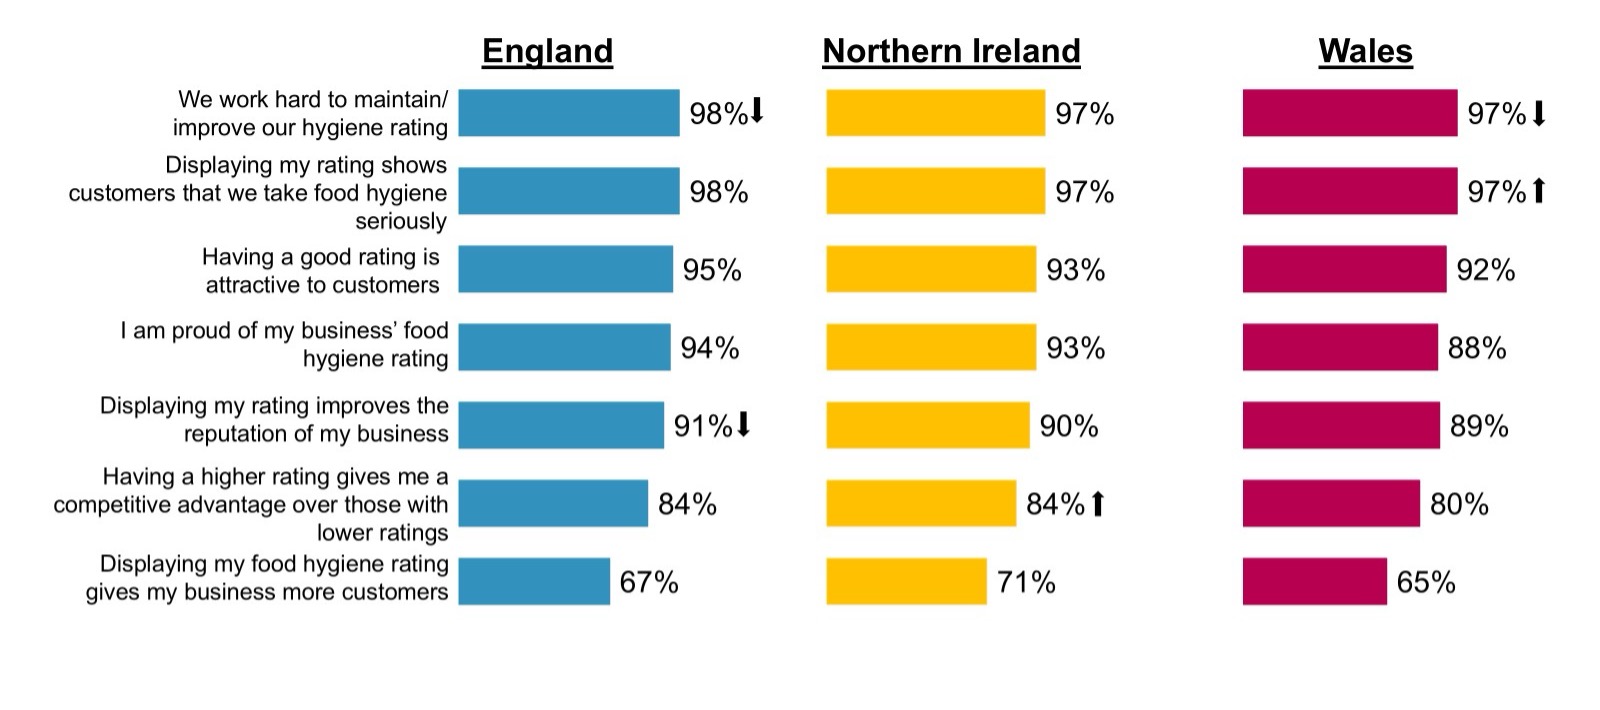
As shown in Figure 9.1, nearly all food businesses agreed that they worked hard to maintain or improve their food hygiene rating (England 98%; Northern Ireland 97%; Wales 97%). While these figures have fallen slightly in England and Wales since 2023 (England 100%; Northern Ireland 98%; Wales 99%), it still represents almost universal agreement. Indeed, at least three-quarters strongly agreed with this statement (England 80%; Northern Ireland 77%; Wales 76%). Most also felt proud of their business’s food hygiene rating (England 94%; Northern Ireland 93%; Wales 88%).

In terms of more customer-facing impacts, almost all businesses also agreed that displaying a food hygiene rating proved to consumers that the business takes food hygiene seriously (England 98%; Northern Ireland 97%; Wales 97%). Similar proportions agreed that having a good rating was attractive to customers (England 95%; Northern Ireland 93%; Wales 92%) and improved the reputation of their business (England 91%; Northern Ireland 90%; Wales 89%).
Eight in ten businesses agreed that having a higher rating gives them a competitive advantage over those with lower ratings (England 84%; Northern Ireland 84%; Wales 80%), with the proportion who strongly agreed ranging from 43% to 51%. Meanwhile, around two-thirds agreed (80% to 84%) and one-third strongly agreed (31% to 33%) that displaying their rating gave their business more customers.
9.2. Use of food hygiene ratings for promotion
Despite two-thirds reporting that displaying their food hygiene rating gave their business more customers, only a minority actively used it as a promotional tool. Around one in ten food businesses in each nation said they used their food hygiene rating sticker to promote their business, for example through display in advertising on posters, or on menus (England: 11%; Northern Ireland: 10%; Wales: 12%).[20]
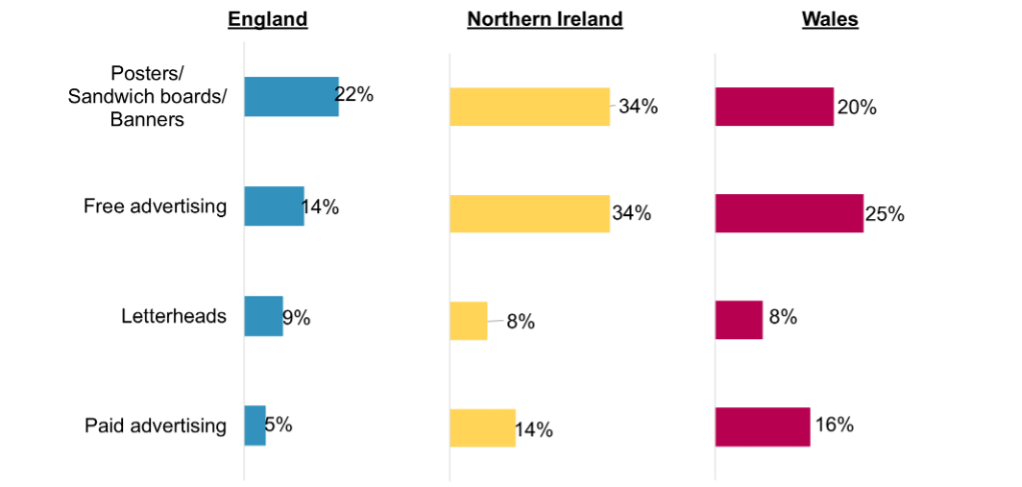
Among those that used their food hygiene rating sticker to advertise, there were variations in the methods used by country, as shown in Figure 9.2:
-
In England, the most common method used was posters/sandwich boards (22%). Paid advertising was used by only 5% in 2024, much lower than in 2023 when 27% of those who used their food hygiene rating sticker to promote their business used paid advertising.
-
In Northern Ireland, one third of businesses who advertised used posters/sandwich boards and one third used free advertising (34% for each).
-
In Wales, free advertising was the top method used (25%), followed by posters/sandwich boards (20%).

Relevant businesses were also asked about the use of takeaway menus and table menus for advertising, both of which were more likely to be used than some of the methods above. Table menus were used for advertising by 19% of businesses in England, 25% in Northern Ireland and 27% in Wales among relevant businesses who advertise, while takeaway menus were used by 16%, 18% and 25% respectively[21].
9.3. Changes made as a result of ratings
Across all three nations, most food businesses that had received a food hygiene rating of 4 or less, reported making changes to try to improve their rating (England 89%; Northern Ireland 78%; Wales 80%). This showed no change since 2023.
Table 9.1 shows the most common changes made by country. The top actions in England were undertaking repairs or improvement works and purchasing additional equipment (both 26%). In Northern Ireland, the top action was also undertaking repairs or improvement works (29%), while in Wales it was improving documentation (21%). The variations in prevalence of specific changes by country were generally not statistically significant, except for implementing or improving staff training which was more common in Northern Ireland (23%) compared to England and Wales (6% and 12% respectively), and purchasing additional equipment, which was less common in Northern Ireland (9%) compared to 26% in England and 19% in Wales.
In England, the proportion saying they had purchased additional equipment was higher than in 2023 (26% this year compared to 8%). In both Northern Ireland and Wales, businesses were less likely to say they had improved their documentation or record keeping this year (17% and 21% respectively, compared to 2023 figures of 35% and 42% respectively).
10. Limitations
The 2024 wave of the FHRS telephone survey and audit achieved the research objectives as set out in the introduction of this report. However, some challenges were encountered during project fieldwork and analysis:
-
Where possible, comparisons between the telephone survey and the audit findings have been made in the report. However, a degree of caution is needed when looking at these comparisons due to the survey findings relying on self-reported information provided by respondent food businesses and audit findings being derived from direct observations by the auditors. Both data sources, but particularly survey data, may be subject to biases or inaccuracies. While comparisons provide valuable insights, they should be made with careful consideration of the unique strengths and limitations associated with each data collection method.
-
As experienced in previous waves of the research, takeaways and sandwich shop outlets were harder to reach than other outlet types. Owing to prior experience of this issue, this outlet type was deliberately oversampled to ensure that a shortfall was not experienced. Ultimately, this decision proved beneficial and targets for this group were met.
-
Owing to adverse weather conditions across the UK in early December 2024, audit mainstage fieldwork was extended by an additional week. This meant that for a small number of businesses included in both strands of the project, their audit occurred at a slightly later date than their telephone survey, meaning any comparison of results is slightly weakened.
-
The online audit focused on three online platforms of interest: the businesses’ own website, Facebook Business Pages and Instagram profiles, as these are commonly used platforms by food businesses. This meant however that the presence of food businesses on other online platforms and how their ratings may be displayed here was not considered. In addition, this means that the online audit data is not comparable with reported online display figures from the telephone survey.
11. Conclusions
The study demonstrated that engagement with the FHRS remains high. In Northern Ireland and Wales, where rating display is mandatory, at least nine in ten audited businesses had a sticker on display at their premises (94% in Wales and 90% in Northern Ireland). While high, this still indicates that a small proportion of FBOs – notably accommodation businesses, pubs, bars and nightclubs in Northern Ireland – are acting in a non-compliant fashion in these nations. Furthermore, a small proportion who displayed a sticker (England: 7%; Northern Ireland: 6%; Wales: 4%), were displaying an incorrect rating at the time of the audit.
Non-compliance is not necessarily driven by businesses seeking to be covert with their rating: in Wales, of the 29 audited businesses not displaying their sticker, 18 had a rating of 5; in Northern Ireland, the equivalent figure was 32 out of 44. The most common self-reported reasons for non-compliance included that there was nowhere suitable to show the sticker, and that businesses did not think the sticker was relevant for them.
In England – where rating display is voluntary – the proportion of businesses displaying their rating at their premises has continued to grow. By 2024, 72% of audited businesses were found to be displaying their rating, representing a steady increase from 55% in 2017.
There is clear evidence that businesses are supportive of making rating display at premises mandatory in England. Almost nine in ten (86%) businesses in England felt mandating rating display would be a ‘good thing’; this represented a gradual upward trend since 2015 (65%). Attitudes of businesses in England are now nearly in line with those of businesses in Northern Ireland (94%) and Wales (90%).
Positive attitudes towards introducing mandatory display at premises in England typically centred around themes of transparency, maintaining or improving business standards and consumer empowerment. Furthermore, the audit provided evidence for how mandatory display can encourage good practice. In England, rating display was strongly linked to having a higher rating. This pattern was not observed in Northern Ireland and Wales. To maximise the impact of the FHRS, therefore, the study’s evidence strongly suggests that mandated display compels businesses with low ratings to publicly display their rating, thus providing transparency to the customer.
Satisfaction levels with FHRS ratings were generally very high across all nations. However, satisfaction among businesses in Wales was lower than the other nations and has reduced slightly over time (84% compared to a high of 89% in 2019 and 2022). This could be linked to fewer businesses in Wales having a rating of 5 (as a percentage of the population) compared to England and Northern Ireland, according to the latest FHRS population data. Attitudes are also different, with a higher proportion of businesses in Wales (13%) stating they would be satisfied with a rating of 3 (compared with 4% in England and Northern Ireland).
This research study has increasingly explored businesses’ use of online mechanisms to sell food. Despite the widespread use of Facebook, Instagram and business websites (around three quarters of businesses reported using one of these channels), only a small proportion of businesses facilitated online orders through them (England 13%, Northern Ireland 13%, Wales 13%) and even fewer displayed an FHRS rating on these platforms (England 3%, Northern Ireland 2%, Wales 4%). It was most common across all three countries, for businesses to facilitate food orders through their own websites compared to Facebook business pages and Instagram profiles.
Online display is not currently mandatory; however, around half of businesses in the survey that reported not displaying their rating online reported that they would consider doing so in future (55% in England, 50% in Northern Ireland and 49% in Wales). Meanwhile, the majority of businesses felt that third-party delivery sites displaying their rating in a more prominent position would be a positive change (73% in England, 72% in Northern Ireland, and 66% in Wales).
Scotland operates its own food hygiene scheme called the Food Hygiene Information Scheme (FHIS) which is regulated by the food safety authority Food Standards Scotland (FSS).
Number of employees was only collected from the telephone survey.
In Northern Ireland and Wales, businesses are legally required to display their ratings at or near each customer entrance. Stickers must be displayed in a location where they can be readily seen and easily read by customers before entering the establishment.
Findings among businesses rated between zero and two should be treated with caution and are not representative of the wider population due to low base size.
‘Clearly visible’ is defined as not obscured by any other stickers or posters and not blocked from view by any furniture or objects.
Where ratings observed at the time of audit did not match the published data in August 2024, which was used for audit selection, the FSA conducted an internal review to verify the valid rating at the time of the audit.
This refers to outlets displaying a sticker that did not match their valid rating in the FHRS database at the time of audit.
Findings among outlets displaying the incorrect rating have been aggregated across all three nations due to small sample sizes.
Examples of food delivery aggregators are Deliveroo, Just Eat, UberEats.
Sample sizes for individual platforms were not robust enough for meaningful analysis.
Sample sizes for individual platforms were not robust enough for meaningful analysis.
Sample sizes for individual platforms were not robust enough for meaningful analysis.
It should be noted that the rate of display on aggregator platforms was not audited. This is because it is already known how FHRS ratings information is provided on these platforms.
This is likely – in part – linked to the distribution of ratings within each nation. Businesses in Northern Ireland are more likely to have a rating of 5, while those in Wales are least likely to have a rating of 5.
This discrepancy between stated and observed display rates can likely be attributed to social desirability bias. Businesses may report displaying their FHRS sticker even if they do not to align with perceived norms or avoid potential scrutiny. Additionally, some respondents may genuinely believe their sticker is on display, unaware that it is no longer visible.
It should be noted that these proportions are based on unweighted data. This is because the weights applied to survey and audit data were designed to make results representative of the target population within each country, rather than the full population of England, Northern Ireland and Wales.
Integer figures below are presented unweighted due to the very low base sizes.
Note: this is a small base of 14.
A ‘right to reply’ allows businesses to tell customers how their business has improved its hygiene standards or if there were unusual circumstances at the time of inspection. This response is published online, alongside the rating, by the local authority. Businesses can ‘appeal’ an FHRS rating if they think that the rating does not reflect the hygiene standards at the time of inspection. If a business makes the improvements to hygiene standards that food safety officers raised at their last inspection, businesses can request a ‘re-rating’ visit.
The Food Hygiene Rating Wales Regulations 2016 states that all establishments must include information on their publicity materials about where to find the food hygiene rating for that establishment. Establishments may choose whether or not they display the rating itself on publicity materials. https://www.legislation.gov.uk/wsi/2016/429/made/data.pdf
The higher figure in Wales may be down to the requirements that takeaway food establishments in Wales must include a bilingual statement on their menu leaflets and flyers. The Food Hygiene Rating (Promotion of Food Hygiene Rating) (Wales) Regulations 2016 state that a business may also choose to display the establishment’s rating on its publicity materials, however this is not a ‘must’.