

Introduction
The National Diet and Nutrition Survey (NDNS) reported that between 2012-2017 children aged 11-18 years in Northern Ireland (NI), exceeded recommended intakes for saturated fats, trans fats and free sugars, and had low average intakes of fibre, vitamin A, vitamin D, folate, iron, calcium, magnesium, potassium, iodine, selenium and zinc. The most recent obesity statistics from the Northern Ireland Health Survey (2019/20) stated 26% of children aged 2-15 were classified as living with overweight (20%) or obesity (6%). The Health Inequalities Annual Report also reported that in 2022/23 the percentage of Year 8 pupils in the most deprived areas living with obesity was 94% higher in the least deprived areas. Such health disparities may be driven by dietary intake and nutritional status, with National Diet and Nutrition Survey finding that those with lower equivalised income were associated with an increased consumption of free sugars, red and processed meat and sugary, fizzy drinks.
The Eatwell Guide recommends that the public should restrict consumption of foods and drinks high in fat, salt or sugar (HFSS) by eating them less often and in smaller amounts. The National Diet and Nutrition Survey includes dietary intake data from food commonly purchased from takeaways, showing that 6% of children in aged 11-18 years’ energy comes from chips and other fried potato products and 6% of their saturated fat consumption comes from burgers, kebabs or sausages.
Research has indicated that the food environment may have an impact on food that we consume. Systematic reviews investigating the relationship between the community food environment and diet-related health outcomes have reported that availability and close distance to food outlets with less healthy options was associated with increased HFSS consumption, higher body mass index (BMI) and obesity (Atanasova et al., 2022; Pineda et al., 2024). Studies have also indicated that the distance of fresh fruit and vegetable stores and supermarkets was associated with a lower risk of obesity (Pineda et al., 2024). Research in England has indicated that those in impoverished areas may have a less healthy food environment. In 2017, Public Health England (now the Office for Health Improvement and Disparities (OHID)) conducted research investigating the relationship between the density of fast food outlets and deprivation by local authority. This project utilised data from the FSA’s Food Hygiene Rating Scheme (FHRS) to create the density of fast-food outlets map. The fast-food outlets map was then compared to English indices of deprivation in 2015. OHID have since updated this research based on data collected in 2024. Both research projects in 2017 and 2024, showed that local authorities with a higher deprivation score in England had a greater density of fast-food outlets. The Food Standards Agency in Northern Ireland (FSA) commissioned CADA Consulting Limited to investigate the availability of fast food outlets and grocery retailers in Northern Ireland both at a country level and specifically close to secondary schools; and further to investigate the relationship with local deprivation. This study provides an evidence base to engage stakeholders across Northern Ireland including local councils and academic institutions to support the food industry as part of the FSA’s Making Food Better programme.
Aims of the study
The aims of the study were:
-
To map the availability of fast food outlets and grocery retailers in Northern Ireland, particularly at Local Government District level.
-
To investigate if there are any trends in the availability of fast food outlets and grocery retailers with local deprivation.
-
To map the availability of fast food outlets and grocery retailers close to secondary schools.
-
To investigate if there are any trends in the availability of fast food outlets and grocery retailers close to secondary schools with local deprivation.
Methodology
The high-level methodology followed was:
-
Identify relevant businesses (fast food outlets and grocery retailers)
-
Assign each business to associated geographic regions
-
Calculate business rates per 100,000 population (fast food outlets and grocery retailers separately)
-
Identify secondary schools in scope
-
Create 400m radius circular buffer zones around secondary schools and count businesses within the buffer zones (fast food outlets and grocery retailers separately)
-
Explore trends against regional deprivation
Data sources, filtering and transformation
The data used in this study are detailed in the following sections, along with discussion of any limitations if applicable.
Geographies
In this study, Local Government Districts (LGD) and District Electoral Areas (DEA) were assessed, as these are the two largest region sizes used in the most recent Census 2021. For conciseness, this report focuses on the presentation of results at the LGD level.
As deprivation is highly localised, Northern Ireland Statistics and Research Agency (NISRA) present deprivation rankings for Super Output Area (SOA) and Small Area (SA) boundaries. The larger SOA boundaries have been used in the assessment of deprivation in this study to extract generalised conclusions.
Businesses
Fast food outlets and grocery retailers were captured from the FHRS. Mobile retailers, or those with no address were excluded from this study. Spatial analysis was undertaken to assign each business to the relevant geographic area for the three geographic boundary types (LGD, DEA, SOA).
It was noted that the use of specific categories for the same or similar businesses was not strictly adhered to. Hence, where possible this study captures relevant businesses across multiple categories. Further, the coordinates and/or postcodes stated do not always accurately capture the business premises. This is not likely to significantly alter the conclusions of this study, however, should be considered when exploring specific regions in detail.
Fast food outlets
Fast food outlets were identified by searching for 12 well known chains, alongside 19 key search terms:
burger, chicken, chip, fish, pizza, kebab, india, china, chinese, pizzeria, grill, diner, bbq, street food, kitchen, dogs, thai, mexican, burrito
Businesses with the term ‘coffee’ were excluded from the dataset, as they are not typically associated with significant provision of fast food.
Grocery retailers
Grocery retailers were identified by extracting all businesses in the FHRS category ‘Retailers – supermarkets/hypermarkets’ with the exclusion of 4 well known chains that do not sell significant amounts of food.
In addition, businesses in the FHRS category ‘Retailers – other’ were included by searching for 17 well known chains, in addition to 3 key search terms:
grocer, fruit, veg
Population
Population estimates for LGD and DEA geographies were taken from NISRA Census 2021 person and household estimates for Data Zones in Northern Ireland.
Population estimates for SOA do not exist for Census 2021 and were therefore taken from NISRA 2020 Mid Year Population Estimates for Northern Ireland.
Secondary schools
School data was downloaded from the Department of Education online school database. This was subsequently filtered to only include schools with types detailed as ‘Secondary’ or ‘Grammar’. Independent schools were not included in this study.
Coordinates for each of the schools were provided separately by the Department of Education. Note that these are point locations that are not necessarily at the centre of a school.
To assess businesses close to secondary schools, 400m circular buffer zones were created using the above coordinates as the centre of the buffer zones. These were used to represent an approximate 5-minute walk from each secondary school. It is noted that this is a simplistic representation and doesn’t account for specific access/egress locations and roads/pathways. However, it provides an efficient and pragmatic method to assess the country-wide variations of businesses close to secondary schools.
Deprivation
Deprivation data was sourced from the NISRA Northern Ireland Multiple Deprivation Measure 2017 (NIMD2017) study that details the ranks for SOA and SA regions (where the lowest rank represents the most deprived area). In particular, the Multiple Deprivation Measure (MDM) was used in this study, as this provides an overall picture of deprivation based on the constituent deprivation indicators.
Note that deprivation is extremely localised and highly variable. When investigating businesses close to secondary schools with deprivation, consideration should be given that children may reside in a different area to the school location which could have a significantly different deprivation rank.
Results
Across Northern Ireland, the total number of fast food outlets identified was 2,223 and the total number of grocery retailers identified was 938, i.e. on average there were 2.4 times more fast food outlets than grocery retailers.
The mean rate of fast food outlets across Northern Ireland was 116.8 per 100,000 population. The mean rate of grocery retailers across Northern Ireland was 49.3 per 100,000 population.
190 secondary schools were assessed, with a mean of 2.2 fast food outlets and 0.8 grocery retailers found within 400m radius.
Regional variations
This section details the fast food outlet and grocery retailer availability and rates per 100,000 population. Spearman’s rank-order correlation was used to assess relationships between variables.
-
Fast food outlet rates increase with increasing grocery retailer rates at the DEA region level, i.e. there is a positive correlation between the rates of fast food outlets and grocery retailers (rs=.60, p<.001, n=78).
-
The number of fast food outlets tends to increase with increasing deprivation at the SOA level, however the trend is not particularly strong, i.e. there is a weak positive correlation between fast food outlets and deprivation (rs=.28, p<.001, n=888).
-
The number of grocery retailers tends to increase with increasing deprivation at the SOA level, however the trend is not particularly strong, i.e. there is a weak correlation of increased rates of grocery retailers with increased deprivation levels for SOA regions (rs=.19, p<.001, n=888).
-
When assessing the most and least deprived 25th percentiles, it was observed that there are on average 1.8 times more fast food outlets in the most deprived areas compared to the least. However, it was also observed that there are on average 1.4 times more grocery retailers in the most deprived areas compared to the least.


Availability close to secondary schools
This section details the assessment of fast food outlets and grocery retailers within a 400m radius of secondary schools.
-
The largest number of fast food outlets located within 400m of a secondary school is 21.
-
50% of secondary schools have no fast food outlets within 400m.
-
56% of secondary schools have no grocery retailers within 400m.
-
Of the secondary schools with no grocery retailers within 400m, 20% have at least one fast food outlet within 400m.
-
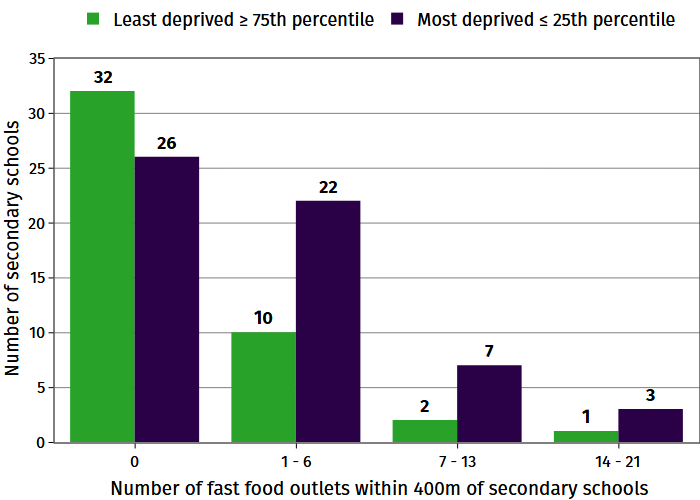
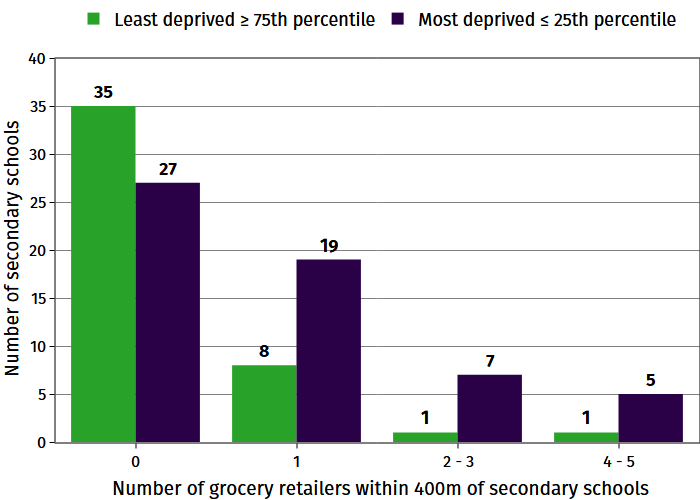
40 secondary schools were located in the most deprived 25th percentile regions; and 53 secondary schools were located in the least deprived 25th percentile regions.
-
When assessing the most and least deprived 25th percentiles, it was observed that there are typically more fast food outlets and grocery retailers within 400m of a secondary school in the most deprived areas compared to the least.
-
Across Northern Ireland, there are approximately 2.5 times as many secondary schools with one or more fast food outlets in the most deprived areas compared to the least; and approximately 3.3 times as many secondary schools with one or more grocery retailers in the most deprived areas compared to the least.


Limitations and further considerations
While this study provides a useful evidence base on a country-wide scale, there are several methodological limitations that should be noted:
-
All fast food outlets were considered to have an equal impact, however each will provide various food options and therefore have a wide range of health impacts on the consumer.
-
Grocery retailers were used to assess the availability of healthier food options, however they also typically sell unhealthy food and some may sell limited healthier options.
-
Businesses that are not specified in FHRS under the category ‘Retailers – supermarkets/hypermarkets’ and are not part of a large chain or affiliated to a large franchise were not included in the grocery retailers data. This may mean a small number of businesses such as convenience stores were not captured, however these are not expected to provide significant healthier options.
-
Food options that are located along main walking/cycling routes for school children may be more accessible than those closer to schools which are away from these routes.
-
The use of a circular buffer zone around secondary schools is simplistic and does not account for the location of access/egress points into each school.
-
Business location coordinates in the FHRS data are of varying accuracy and were not provided for all businesses. Where coordinates were not available, the centroid location of the business postcodes were used to identify approximate locations of businesses.
-
Deprivation is extremely localised and highly variable. When investigating businesses close to secondary schools with deprivation, consideration should be given that children may reside in a different area to the school location which could have a significantly different deprivation rank.
Further, the following should be considered if this study is utilised for wider assessment:
-
Health outcomes may not be directly related to the specific number of fast food outlets, for example a single large fast food establishment could have a similar effect to multiple smaller fast-food outlets.
-
This study did not investigate the rates at which school children visit fast food outlets or grocery retailers, or indeed their reasons for visiting them. There are multiple factors other than distance to secondary schools which may encourage young people to visit fast food outlets, including but not limited to; accessible and affordable food options, a warm environment or free amenities such as Wi-Fi. Such factors should be investigated in future work.
Discussion
This study has shown that there are on average 2.4 times more fast food outlets than grocery retailers in Northern Ireland. Additionally, in some areas of Northern Ireland, there are a high number of fast food outlets within 400m of secondary schools, with a limited number of grocery retailers in comparison.
Evidence suggests that meals eaten out of the home such as in restaurants or takeaways, tend to be larger in portion size, higher in energy, saturated fat, sugar and salt and lower in fruit, vegetables and micronutrients compared to meals prepared at home (Blackham et al., 2015; Ziauddeen et al., 2018). FSA research (What’s on the children’s menu?) has demonstrated that there are limited healthy options for children when they eat out of the home, in restaurants, cafes or takeaways. The Eatwell Guide recommends that consumers limit their intake of HFSS foods. Findings from NDNS from 2012-2017 have shown that chips contribute to a high percentage of energy and saturated fat intake for 11-18 year olds and red and processed meats contribute to a high percentage of salt and saturated fat intake, both of which are commonly sold in fast-food outlets. Therefore, a high number of fast food outlets within close distance to secondary schools in Northern Ireland could be a driving factor for children’s high intakes of energy, saturated fat and salt.
The findings from this study therefore highlight that with a high number of fast food outlets within close distance to secondary schools, children, particularly those aged 11-18 years, are potentially being exposed to a less healthy food environment with a lack of healthier food options. This may have a significant impact on the dietary health and nutritional status of young people in Northern Ireland.
This study found a slight general trend of increasing number of both fast food outlets and grocery stores as deprivation increased, however there was only a weak relationship. When assessing the most and least deprived regions, it was found that the most deprived areas have on average 1.8 times more fast food outlets than the least deprived areas. However, it was also found that the most deprived areas have on average 1.4 times more grocery retailers. It should be noted that the type of settlement (rural/urban) may also be a contributing factor to both the number of businesses and the levels of deprivation.
However, there are many other factors that may be at play alongside the food environment, and it should be noted that this study has not assessed any specific links between availability of food choices and health outcomes such as BMI and obesity. It should not be assumed that the availability of food choices alone is the predominant factor driving negative health outcomes. Moreover, future work should investigate both the rate and the reasons that school children are visiting fast food outlets and grocery retailers to fully understand all factors that may be contributing to use of these businesses among children.
The FSA’s Making Food Better programme supports Northern Ireland food businesses to make the food environment healthier. Noting the high levels of fast food outlets in Northern Ireland, this study will inform the FSA’s work with industry to improve children’s meals in the out of home sector.
Acknowledgements
FS900542
We would like to acknowledge the contributions of the following people and organisations to the delivery of this research project:
-
Dr Gareth Davis
-
Steve Pimlott
-
Dr Brídín Nally
-
Dr Aoibheann Dunne
-
Ellie McCrea
-
Jennifer McGonagle