

Executive Summary
Background
Our overall vision was to use citizen science to identify the best ways of supporting people with food hypersensitivity (FHS) to make safe and informed choices when they are eating food prepared outside the home. The project had two aims:
-
to collect key information from citizens with a FHS about how they assess allergen risk when eating food prepared outside the home.
-
to assess the feasibility of engaging those with FHS as citizen scientists, including understanding the viability of recruiting citizen scientists, engaging them as co-producers of data collection protocols, data and research outputs and their and other stakeholders’ experiences of engaging in citizen science.
Methodology
This project used citizen science research approaches and engaged with FHS consumers and stakeholders (e.g., charities, representative organisations) to inform the project design and support recruitment and dissemination. By its nature, citizen science is iterative and relies on the co-production of research materials and outputs. During the research, aims and methods were refined based on citizen scientists’ views and feedback. The following describes the overall approach that was taken:
-
Recruitment of potential citizen scientists: The project team engaged with FHS stakeholders to promote awareness of the project and seek expressions of interest from potential citizen scientists. In total, 121 people with FHS read information about the project and completed an eligibility survey providing information about their FHS and consented to take part in the project.
-
Co-designing with stakeholders and citizen scientists: One workshop with 5 stakeholders and two workshops with a total of 16 participants were held to shape the design of our data collection tool – a survey that was administered through Qualtrics.
-
Citizen scientists collecting information: 66 participants contributed data about 241 eating out experiences. Over the 4-month period that the survey was open, regular project updates were provided by email newsletters and participants were invited to contribute to a project Facebook™ group.
-
Reflecting on findings: At the end of the project 9 interviews were conducted with participants to capture their views about their experience of taking part as citizen scientists. Final workshops were held with citizen scientists and the project stakeholders to capture their reflections about the project.
Key Findings
This research aimed to identify what contributed most to a positive eating out experience for FHS consumers, with citizen scientists choosing to focus on the whole eating out ‘journey’ from pre-planning to being served. We found the most consistent predictor of FHS consumers being happy with the eating out experience was having a positive experience at the pre-planning stage. The most important indicators of a good experience at the pre-planning stage were whether the information found was felt to be sufficient by FHS consumers to make a confident decision concerning the allergen(s) that needed to be avoided and whether the allergen information given was accessible or understandable. Being unable to find allergen information had a negative effect on FHS consumers’ experiences.
Seeking information online was FHS consumers’ key pre-planning strategy, with establishments’ websites being the main source of online information. The availability and accessibility of allergen information on websites provided FHS consumers with reassurance there would be suitable meal options available for them and was believed to indicate, and act as a proxy for, the venues’ overall attitude towards FHS consumers. FHS consumers’ confidence was often based on a more general appraisal of how much information on allergens was available (e.g., its visibility, the prominence given to allergens) rather than from the presence of allergen filter and selection tools (although these were valued when they would filter dishes based on allergens).
FHS consumers also sought online information once they had selected and arrived at an eating out establishment. This was facilitated by the venue and their provision of website links or QR codes on the menu. The provision of online information at the venue was not favoured by all, although others were more positive noting the benefits of the allergen filter option. Once in the venue, seeking information in person from staff was sometimes combined with online information seeking. By virtue of taking part in this study, all citizen scientists in this study can be considered as digitally literate. However, given the importance of digital information seeking especially at the pre-planning stage, it is important to consider the possibility that those that are unable to access or use online information sources are less able to make informed and confident decisions about where to eat out safely.
Outcomes of and Reflections on Citizen Science
Some citizen scientists found providing detailed accounts of eating out experiences personally beneficial as it enabled them to reflect on how they assess risk and make decisions. Collaborating in the project design promoted a positive sense of being involved in the project. The regular project updates that also contained interim findings from the project promoted a sense of ongoing involvement and a sense of making a valued contribution. Citizen scientists also appreciated being able to hear other people’s views and eating habits through the workshops and the newsletter updates and these enabled them to reflect on how similar or different those were from their own patterns.
Conclusions
This project has contributed some unique insights to the research around eating out with a food hypersensitivity from both a findings and methodological perspective.
The key role played by the pre-planning stage for FHS consumers to feel confident in choosing a venue suggests food businesses should invest in and optimise their online content, particularly their websites, to reassure and attract FHS consumers. The importance of this online and unmediated information to consumers also has implications for what information and guidance the FSA provides to both FHS consumers and food businesses to support consumers safety. Particular attention could be given to how online information might best be linked to information provision practices – both written and via food business staff – within the venue.
From a methodological perspective, the approach appears to have provided near real-time observations about multiple specific instances of eating out. This represents a shift from global retrospective observations more common in traditional research approaches.
Compared to other citizen science projects the relatively high conversion from registrant to participants suggests the important role of intrinsic motivations of citizen scientists with FHS and their appreciation of having the opportunity to contribute evidence in an area of great importance to them. These values suggest there is considerable promise for moving beyond pilot projects to integrate citizen science in other projects that address this FSA Area of Research Interest.
That said, it is challenging to truly embed co-creation in funded projects. The project design commitments required before funding is obtained constrain this. Research ethics committees too – especially when unfamiliar with citizen science – often require considerable detail before a favourable ethical opinion is provided. Such detail is, by definition, unavailable in the context of research co-creation.
Making the citizen scientists feel actively part of the research and ensuring reciprocal benefits requires not only planned opportunities to do so (i.e.: setting up workshops) but consistent ongoing engagement that promotes two-way communication from start (creation of materials) to the end of the project (dissemination of results) rather than simply from start to end of data collection period.
This work has also been published in Citizen Science: Theory and Practice (Thornhill et al., 2024). The data from this project is available here.
Background
Our overall vision was to use citizen science to identify the best ways of supporting people with food hypersensitivity (FHS) to make safe and informed choices when they are eating food prepared outside the home. The project had two aims:
-
to collect key information from citizens with a FHS about how they assess allergen risk when eating food prepared outside the home.
-
to assess the feasibility of engaging those with FHS as citizen scientists, including understanding the viability of recruiting citizen scientists, engaging them as co-producers of data collection protocols, data and research outputs and their and other stakeholders’ experiences of engaging in citizen science.
In the remainder of this introduction we will first define what we mean by food hypersensitivity, before we provide a short overview of recent key research projects that have explored the experience of eating out with a FHS in the UK.
What is food hypersensitivity and why does it matter?
Food hypersensitivity causes “objectively reproducible symptoms or signs, initiated by exposure to a defined stimulus at a dose tolerated by normal subjects” (Johansson et al., 2001). This can be divided into food allergy and non-allergic food hypersensitivity (formerly referred to as food intolerance). Food allergy can be sub-divided into IgE mediated food allergy (for example to milk, eggs, and peanuts) and Non-Ige mediated food allergy such as coeliac disease which does not have an immunological basis. There is no cure for food hypersensitivity and management means constant vigilance to avoid trigger allergens and treating the symptoms.
Food hypersensitivity (FHS) is one of the Areas of Research Interest of the Food Standards Agency (FSA) where the associated question is: How can the FSA protect the UK consumer from the health risks posed by food hypersensitivity (including allergies and intolerance)? The aim of the FSA is to "improve the quality of life for people living with food hypersensitivities and support them to make safe and informed choices to effectively manage risk’ (Sudworth, 2020).
In the absence of exact numbers, the FSA (2022) estimates “800,000 people are living with a clinically diagnosed food allergy, 300,000 with coeliac disease and 1.2 million living with food intolerance and other FHS conditions in the UK”. It is a significant health issue that has extensive impacts on quality of life and mental health, causing stress, anxiety, depression and anxiety (Cummings et al., 2010; Knibb et al., 2019). Food allergy brings additional risks of hospitalisation: in the UK there were over 30,000 hospital admissions related to a food allergen trigger between 1998-2018 and over the same period hospital admissions for food related anaphylaxis saw an annual increase of 5.7% (Baseggio Conrado et al., 2021). As well as physical and psychological impacts there are social, and financial implications for individuals with FHS.
One setting that has been particularly associated with compromising quality of life and causing stress and anxiety – as well as an increased likelihood of accidental or unwanted consumption of allergens – is eating food that is not prepared in the home for those with food allergy, food intolerance and coeliac disease (Barnett et al., 2020; Begen et al., 2018; Leftwich et al., 2011). A systematic review concluded that eating out in cafés and restaurants account for 21-31% of accidental allergen ingestion with a further 13-23% linked to other eating out environments (Versluis et al., 2015). Recent additional challenges for regulation are posed by the rise of the business’ own and third-party ordering and delivery platforms (e.g. Just Eat and Deliveroo) that add to the chain of required communication around allergens. Additionally, since October 2021, products that are ‘pre-packed for direct sale’ (PPDS) need to be labelled with the name of the food, to list all ingredients with the inclusion of any of the 14 key allergens[1] highlighted in the list.
What do we know about eating out with a food hypersensitivity?
The challenges of eating out with FHS have been addressed in various projects, some of which have been commissioned by the FSA. Before outlining how addressing this question in line with the principles and practices of citizen science might add to our understanding of the area, we will first outline recent research findings in this area and the methods that have been used to understand the concerns and experiences of those with FHS when they are eating out.
One key study in this area explored the impact of EU legislation on the eating out experiences of food allergic consumers (Begen et al., 2018). This longitudinal study had two data collection points either side of the implementation of the legislation (EU Food Information for Consumer Regulation No. 1169/2011, (EU FIC)) introduced in December 2014. This regulation specified that food businesses providing non-prepacked foods had to make information available – either in writing or verbally – about any ingredients in their foods that contained one or more of the 14 allergens. Survey and interviews were conducted before and after the implementation of the legislation in order to explore how the legislation may have had an impact on experiences of eating out and to understand the information preferences of FHS consumers. Drawing on both the pre- and post surveys and interviews, participants considered the availability and adequacy of allergen information to have improved. The interviews identified that the core preference for information about allergens was for this to be conveyed in written form and then ideally confirmed by staff (Begen et al., 2016). Subtle social cues relating, for example, to the perceived cleanliness of the venue or the perceived competence of service staff were used to gauge the reliability of verbal information. This overall preference for written information was supported in more recent survey studies conducted for the FSA which found that 60% (n= 549) were confident that they could identify foods that cause a reaction based on the written information provided by the venue (Knibb et al., 2021, 2022). It is worth noting that confidence in written information in the second wave of the survey (2021) was less than in the first wave (2020): 60% compared with 62%. The inverse pattern was seen for confidence in verbal information – there was greater confidence in the second wave 52% (n= 475) compared with 43% in the first wave. The reasons for these changes are unclear.
A further issue that the studies above have in common is an attempt to consider the eating out ‘journey’. This is most clearly exemplified in the longitudinal study conducted pre- and post- the EU FIC legislation (Barnett et al., 2017). This contained a graphic, reproduced below, that aimed to characterise range of options for seeking and obtaining information about allergens through from ‘planning to eat out’ through to the ‘arrival of the food’. This work formed the basis for the input of citizen scientists in this project about the best way of conceptualising the eating out journey (see figure 1).
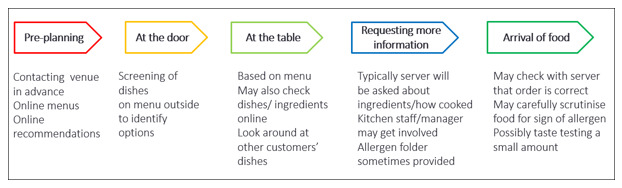
It is important to note in both of these projects (and others that the FSA has commissioned relating to FHS) that the observations that participants make about their experiences at these stages are global – that is, that they are reflecting back on the sum of their experiences. Although some of their reflections may be illustrative of specific memorable experiences, the research is not structured around capturing particular discrete experiences. . We will consider how the contribution of citizen science focusing in near real-time on particular instances of eating out might bring a different perspective to understanding experiences of eating out with a FHS.
Why citizen science?
Citizen science relates to the production of knowledge outside traditional scientific institutions (Strasser & Haklay, 2018); “through citizen science, people can directly engage with and monitor issues that affect them” (Pateman et al., 2020). Citizen science can be broadly considered as three types of practice: contributory, collaborative or co-created (Bonney et al., 2016). As the field of citizen science has evolved, there has been an increasing emphasis on co-creation (Hecker, Bonney, et al., 2018).
Prior to the pilot project being reported here, there have been no projects using citizen science specifically related to food hypersensitivity. In fact, there have been limited applications relating to food systems in general (Reynolds et al., 2021) although this is gradually changing (Aylward et al., 2022; Oakden et al., 2021; Pomeroy et al., 2017).
This project focuses on capturing information about the information seeking practices of FHS citizens when they eat out in hospitality settings (e.g., restaurants); a key part of the food system which, as we have seen above, embodies particular challenges for those seeking to avoid allergens.
Aims and Objectives
Using qualitative and quantitative methods framed by a citizen science approach, the aim of this research was to identify what most contributed to a positive eating out experience for FHS consumers. The early engagement with our citizen science and stakeholder communities indicated the value of reframing this question in terms of the citizen science ‘journey’ ranging from the pre-planning stage through to the food being served to and received by the food hypersensitive consumer. Accordingly, the aim of the study was refined to consider the stages and components of the eating out journey that are most formative of a good eating out experience for those with FHS. A subsidiary aim is to consider what, if any has been the added value of a citizen science approach to considering eating out experiences for those with a food hypersensitivity.
Definition of citizen science
The ‘citizen science for food standards challenges’ required projects to ‘be a collaboration between researchers, a specific group of citizens and, where appropriate, relevant partners from outside academia’ and for citizens and partners to be involved in co-creating the projects.
Returning to the tripartite categorisation of citizen science noted above, the focus of this project was strongly collaborative and also involved some elements of co-creation. The expertise of our citizen science participants was central to the project and is reflected in how they shaped the methodology.
The citizen scientists had the choice to engage with different parts of the project. Many had a contributory role by collecting data (with varying degrees engagement regarding the number of eating out experiences they contributed) with others taking roles that ranged from collaboration to co-creation inputting on the various parts of the project depending on their willingness and availability. There was no financial incentive for these citizen scientists to participate in this project, although it became evident that some were motivated by their engagement with the scientific process, their interest in learning about the perspectives and strategies of others, and the personal reflections that their engagement with the project occasioned.
Although it was a researcher-led project, this study involved the food hypersensitivity community by not only working with our citizen scientists but also by engaging with our project partners: five charities and organisations which represent different food hypersensitivities (Coeliac UK, Anaphylaxis UK, Allergy UK, The Natasha Allergy Research Foundation, Allergy Action). We worked with our project partners in terms of design of the data collection tool, recruitment, and reflection on and dissemination of findings.
Methodology
Methodology
The research addressed the defined aims through a mixed methods approach. This research was framed in terms of citizen science as outlined in the introduction above and, as such, participants variously collaborated in the following activities over a period of 9 months. This project ran over three phases: (1) co-designing with stakeholders and citizen scientists, (2) citizens scientists collecting information, and (3) reflecting on findings. Within these three phases citizen scientists could engage with our project through multiple methods in which we outline below.
Phase 1: Co-designing with stakeholders and citizen scientists
As the citizen scientists know better than any of the research team what the experience of eating out with a FHS is, we took their views as to how best to structure our data collection tool very seriously and responded to the feedback they provided us with. This input allowed us to move away from global assessments of eating out experiences. Rather, aligned against the co-created structure of the eating out journey, we sought to enable the contribution of detailed single experiences of eating out with a FHS that were captured in near-real time. Drawing these accounts together to form an overall picture being reported here was led by the University research team and citizen science participants and professional project stakeholders providing further comment to shape our accounts and conclusions. The rest of this section describes how this collaboration and co-design was achieved.
A total of 31 citizen scientists were invited to take part in online workshops to help design the data collection tool facilitated by Zoom (California, USA). For pragmatic and time-related reasons, the selection of those 31 invited citizen scientists was on a first-come first-serve basis. Of those invited, 16 citizen scientists attended a workshop (split into two workshops of 8 citizens on the 12th and 13th of May 2022) (see supplemental files in journal publication for workshop presentation). Within these 16 workshop participants excluding a range of allergens were represented (peanuts [1], other nuts [1], cow’s milk [2], cereals [13], eggs [1], crustaceans [1], soya [1], lupin [1] and meat [1]), where five people were avoiding multiple allergens). Ten people reported to always react upon contact with the allergen. Participant ages were between 25 and 75+, with the most represented categories being aged 45 to 54 and 65 to 74, each with five representatives. Twelve participants identified as women, and four men, while 15 were white British and one preferred not to say.
Prior to the citizen scientist workshops, an initial draft of the information we hoped to capture was developed by the research team. It was then further developed with the project partners in a similar co-design workshop designed to discuss what information should be captured from a decision-maker perspective (held 23rd February 2022). The survey design was also informed by contributions on twitter via #allergyhour convened by @allergyhour. During the workshops, participants had the opportunity to contribute their views of the drafted survey. Their input was gathered through Mentimeter in the form of multiple choice questions, Likert-scale responses, word clouds, and free text as well as through the online conference platform (chat messages or microphone). Of the 16 workshop attendees, 13 participated through Mentimeter and the Zoom chat. All the information collected was then transferred to Microsoft Excel.
As a result of the citizen scientist co-design workshops, 17 changes were made to the survey ranging from minor alterations (e.g., adding an option within a multiple-choice question) to more major ones such as altering our ‘eating out journey’ template. A section designed to capture observations ‘at the venue but before arriving at the table’ was seen as redundant by the citizen scientists and so was removed.
Phase 2: Citizen scientists collecting information
After the co-design process was complete, the Qualtrics survey (see supplemental files in journal publication) comprised of five components: i) a preliminary stage that asked about prior knowledge of the establishment, the type of establishment and cuisine, ii) a pre-planning stage that gathered information about the steps taken prior to visiting an establishment, iii) a stage upon arrival at an establishment, iv) questions about the ordering process when at the table, and v) an overall reflection of the eating out experience. The survey was delivered online through Qualtrics© and included questions with fixed and free-text responses. The questions asked for input on participants’ information seeking activities, risk assessment and decision-making strategies that FHS citizens used at each stage, how positive or negative their experiences were and why. Participants also had an opportunity to upload photos. There were separate sections of the survey to gather information about eating-in and take away services. The survey was open for 4 months (May-August 2022). The survey could be completed through a smartphone or web-browser online. Participants were encouraged, but not required, to fill out their experience as close to real time as possible.
During the 4 months of data collection, citizen scientists could enter the survey multiple times to record information about discrete eating out experiences. Out of the 121 citizen scientists who provided their demographic information and consented to take part in the original survey, 66 (55%) went on to provide information about their eating out experiences: 30 (45.5%) contributed once and 36 (54.5%) contributed more than once. When the option was available, qualitative information to supplement their ratings was provided by 93% of participants. In total, information about 241 eating out experiences was provided.
During this data collection period, citizen scientists had the option to join a private Facebook group (n = 23) created by the researchers. Furthermore, to encourage continued interest and engagement the researcher sent fortnightly newsletter emails to participants with project updates and preliminary results.
Phase 3: Reflecting on findings
After the survey period was completed, a second round of post-project workshops were held to gain views from the project participants (seven attendees from 16 invites, 23rd November 2022), and the decision-makers (2nd December 2022) (see supplemental files in journal publication for workshop outline). Furthermore, semi-structured interviews were completed with nine citizen scientists from the projects between 4th of October 2022 and 7th of November 2022 (see supplemental files in journal publication for interview schedule). These nine were those who responded from an invite of 25 that had low (submitted one observation) or high participation (submitted more than one observation) and attended the initial citizen scientist workshop or not whilst trying to maintain a range of allergy status. In-depth feedback was provided by citizen scientists during the semi-structured interviews. They provided feedback on what they valued about the experience such as actively being involved in the research process.
Citizen Scientist profile and recruitment
For this project with the help of our project partners we recruited individuals with a food hypersensitivity (self-reported) over the age of 16 (or adults caring for children with a food hypersensitivity) residing in the UK. Recruitment of the citizen scientists ran from April 21 to August 1 2022 finishing two months prior to the end of the project. A total of 121 individuals with food hypersensitivities registered as citizen scientists. 58 (47.9%) of the citizen scientists were recruited within the first two weeks of May and 36 (29.8%) were recruited between June 24 and July 13 2022. The peaks in the timeline reflect the promotion of our study by our project partners’ newsletters and their social media accounts. Half of the project participants registered via Coeliac UK (n = 44; 36.4%) and Allergy UK (n = 19; 15.7%), while others were recruited via Twitter (18; 14.9%), Facebook (17; 14.0%), Instagram (10; 8.3%), word of mouth (6; 5.0%), The Natasha Allergy Research Foundation (5; 4.1%) and Anaphylaxis UK (known as Anaphylaxis Campaign at the start of the project) (2; 1.7%).
The goal for recruitment was to obtain data primarily from people with a diverse range of food hypersensitivity characteristics, and secondarily across socio-demographic gradients. To this end, we did not apply any quotas on, for example, age groups. More important was to capture a wide range of allergy statuses regarding the allergens people reacted to, their reaction upon exposure, and the timing for the reaction to occur after contact. This information was gathered through our eligibility survey (administered through Qualtrics once they had consented to take part in the study). To take part in the project, citizen scientists had to be over the age of 16 years old and either have a food hypersensitivity or be caring for someone under the age of 16 with a food hypersensitivity. Out of the total 121 that completed the registration process, 33 (27.3%) were aged between 16 and 34, 53 (43.8%) were aged between 45 and 54, 32 (26.5%) were aged between 55 and 74, and 3 (2.5%) were aged 75 and over. Most of the participants identified as women (105, 86.8%), with 15 (12.4%) identifying as men and one as non-binary. Of those who disclosed their ethnicity (119), most were white British, Irish or other white background (105, 88.3%), and the remainder including mixed white and Asian or Caribbean, and Asian-Indian. Most participants (from 120 who disclosed information) were employed full time (54, 45.0%), part-time (20, 16.7%), or were retired (19,15.8%), self-employed (13, 10.8%), students (10, 8.3%), homemakers (2, 1.7%), on disability allowance (1, 0.8%), or not applicable (1, 0.8%). Fourteen (11.6%) were answering on behalf of a child’s experiences of eating out.
The 121 citizen scientists had sensitivities to a range of allergens. Some citizens had multiple trigger foods with a median of 2 allergens (max. 11) avoided per participant. Seventy-five (62.0%) were avoiding cereals, 33 (27.7%) cow’s milk products, 31 (25.6%) peanuts, 27 (22.3%) other nuts, 23 (19.01%) eggs, 22 (18.18%) fruits and vegetables, 15 (12.4%) soya, 15 (12.4%) sesame, 14 (11.6%) crustaceans, 13 (10.74%) molluscs, and the remainder avoiding lupin, fish, legumes, mustard, sulphur dioxide, celery, meat, alcohol or other unstated. A range of potential reactions were reported that ranged from stomach cramps (70, 57.9%), other digestive symptoms (70, 57.9%), tiredness (63, 52.1%), diarrhoea (47, 38.8%), as well as vomiting, itching/swelling, urticaria, anaphylactic shock, migraines/headaches, and a further eight reactions. These reactions could occur whilst eating out at the venue (70, 57.9%), or having left the venue (51, 42.2%). Sixty six of these participants went on to contribute information about their eating out experiences.
Participant engagement
The extent and depth of participant engagement was assessed in several ways. First, a conversion rate was calculated as the percentage of registered people who went on to submit at least one observation. Secondly, the distribution of observations per participant was analysed and compared to other citizen science projects to consider the strength of engagement with the project over time. The returned observations were also assessed in relation to the stages of the eating journey. This was achieved by i) calculating the average proportion of optional responses given per stage, and ii) calculating the proportion of missed responses at two critical junctures of the survey, whether or not any pre-planning was undertaken, and whether or not any information about allergens was sought upon arrival at the destination. Qualitative data was gathered regarding informal engagement with the project via the Facebook group, email communications, and the post-project focus group and interviews.
Open access data repository
Citizen scientists’ anonymity was ensured through a unique ID provided for them to log-in with at the beginning of each survey entry. This allowed personal information to be detached from each survey response and securely stored in a different file on University of Bath servers. Therefore, there was no personal information of citizen scientists in the data files. Additionally, all identifiable information (e.g., relating to eating out venues) was deleted from the survey file. This anonymized data will be made openly accessible through the data repository available at the University of Bath (Pure). To ensure guidelines are correctly followed, the open access team at University of Bath will be consulted.
Data analysis
The survey, workshop and interview data were analysed to address our research questions. Qualitative analysis of interviews, workshop, and open-ended survey questions was in line with a reflexive approach to thematic analysis (Braun & Clarke, 2021).
The survey analysis focused on which stages of the eating out experience best explained overall happiness with the participant eating out experience, and how welcome the participant felt at the venue.
The happiness variable was constructed by coding the qualitative responses to the question, “Overall, were you happy with the allergen-related experience of eating out? Was there anything you would have liked to be different?” into a 3-point scale with end points of (1) unhappy and (3) happy.
Feeling welcome at the venue was measured with an eight-point scale ranging from 0 to 7 where the end points were not at all welcome (0) to very welcome (7). There was a strong correlation between overall happiness and how welcome participants felt (Spearman’s Rho 0.70, P < 0.001). However, 30% of variance remained unshared and as the mode by which each variable was derived differed (i.e., happiness was semi-qualitative and welcome was direct), both were analysed for added robustness.
To identify specific factors that were indicative of experience, a summary score was created for each stage of the customer journey. For pre-planning and arrival at the venue, this was calculated from 10 responses reflecting the perceived availability and sufficiency of information at those stages. An index for ordering and receiving the food was calculated from 6 responses regarding staff interactions, handling of allergen information and menu choice. (Details of the construction of the 3 indices can be found in the supplemental files in journal publication, alongside a full description of each of the components of the pre-planning, arrival, ordering/receiving indexes). Participants were not forced to enter responses during any stage. Other responses about the eating out experience were unrelated to the specific stages of the eating out journey (e.g., the type of cuisine, familiarity with the establishment, whether reaction occurred) (See supplemental files in journal publication).
Linear discriminant analysis (LDA) was used to predict whether a participant was more or less likely to be happy with their eating out experience. LDA is a multivariate technique used to separate two or more groups of observations based on a set of predictors and find the contribution of each predictor in separating the groups. Here, two LDAs were run whereby the first included a simple binary variable – was pre-planning carried out or not (n = 140). The second included the pre-planning index, providing a more granular level of detail about this stage. There are fewer observations as it only included those that had done some pre-planning (n = 69). In each case the LDA models were trained on 80% and tested on 20% of the data (See supplemental files in journal publication).
Multiple linear regression was used to predict how participants rated their welcome at the establishment with the welcome rating transformed (log n + 1) to account for a negative skew in the data (many high scores). A model-averaging approach was employed to identify the most parsimonious model (according to AIC) and the most important predictors for each instance of linear regression (R package MuMIn, REF). All statistical analyses were carried out in R Statistical Software.
For quantitative citizen science outcomes, binary and logistic regression was used to test whether two-level, or more than two-level factor predictor variables respectively, were statistically important predictors of whether a registrant would go on to participate i.e., affecting conversion rate. Regression was carried out in R Statistical Software (R Core Team, 2022).
Ethics
A favourable ethical opinion for the research was obtained from the University of Bath Social Science Research Ethics Committee on the 4th of April 2022 (ref: S22-036). The focus of our ethics application was on ensuring that clear information was provided to enable informed consent. Subsequent amendments to our original application were made to recruit participants through social media and (outside of the funded project) to conduct additional interviews exploring the decision-making process behind not eating somewhere.
Project evaluation
The project was evaluated alongside an external evaluator with whom an evaluation framework was created before the implementation of the project to capture the outcomes, outputs and impacts of the project. The evaluation framework indicated the appropriate measures and tools for capturing the impact and a report was subsequently created and sent to the external evaluator. The evaluated outputs range from citizen science engagement (interaction richness and frequency), diversity of citizens scientist sample (rate of recruitment, characteristics of citizen scientists), characteristics of co-producing the data collection tool, citizen scientists’ enthusiasm for collecting data, feedback from citizen scientists, and dissemination.
Alignment with citizen science principles
This project followed the ten principles highlighted by ESCA of what constitutes citizen science (Robinson et al., 2018). The project actively involved citizens as contributors and collaborators by providing input to the design of the data collection tool and collecting data to gain a new understanding on the experiences of citizen scientists with FHS consuming food prepared outside the home. This citizen science project was conducted to increase understanding surrounding risk assessment and decision-making of citizens with food hypersensitivities when eating out. The findings will help inform our project partners who are charities representing citizens with FHS who in turn engage with other relevant business, health and retail stakeholders.
Citizen scientists could, if they wished, participate in multiple stages of the scientific process, this helped design an appropriate data collection tool to capture their experiences of eating out. Recorded information about multiple instances of eating out instances provided granular detail about discrete experiences. Lastly, citizens had the opportunity to reflect on the findings and on the experience of being a citizen scientist. This helped shape the subsequent analysis and write-up.
Opportunities to take part in the project were designed to allow citizen scientists to benefit from participation. The feedback we had suggested that people enjoyed taking part, valued the opportunity to hear the views of others that were facing similar challenges, and contributing to a project that would provide evidence to the FSA and that gave them an opportunity to reflect on their own allergen management strategies. This was partly achieved through fortnightly newsletters where citizen scientists received feedback about the project and also through the opportunities to take part in interviews and workshops.
Furthermore, following the citizen science principles, this project was evaluated for scientific output, data quality and participant experience. It followed ethical guidelines relating to participant consent and duty of care, data sharing agreements, and confidentiality, with a focus on making the anonymised data available and in an open access format.
Research Findings
The following research finding compiles results from and citizen scientists’ engagement with the multiple components of our project. The presentation of these findings is divided according to our two aims, those related to the (1) experiences of eating out and (2) citizen science outcomes.
Experiences of eating out
Results
The 66 participants contributed 241 experiences of eating out. 100 of these experiences (42%) involved pre-planning activities. Accounts of pre-planning experiences were provided by 42 of the 66 citizen scientists, that is, 64% of the citizen scientists recorded eating out experiences involved pre-planning at least once. Sixty two (94%) provided at least some data about arrival at the venue, 60 (91%) about ordering/receiving their food.
Experiences of happiness and feeling welcome when eating out
Our analysis found that FHS citizen scientists more commonly had a positive eating out experience at a venue when they had greater confidence before they visited it. Not preparing for a visit (e.g., not doing research online, not contacting a venue) was more likely to result in a less positive experience. We found the most consistent predictor of FHS consumer happiness with eating out was their experience at the pre-planning stage.
The first LDA of overall happiness focused on a binary indicator of whether any pre-planning was carried out (n = 140). This correctly predicted 55.6% of observations in the test dataset into the correct categories. The model predicted 88% of very happy observations (14 out of 16 of the very happy responses) but only 25% of unhappy observations (1 from 4) and no nuanced responses (0 out of 7). Thus, the models performed well for those who experienced a happy eating out experience, moderately for those who were unhappy, but poorly for more nuanced experiences. The second LDA of overall happiness included the more detailed pre-planning index (n = 69)[2]. This model correctly predicted 69.2% of test data into the correct classes. Of these, the most predictable class was very happy (category 3), where 88% (7 out of 8) were correctly classified. There were fewer test data for categories 1 (unhappy) or 2 (nuanced), which where correctly predicted 100% (2 out of 2) and 0% (o out of 3) of times respectively.
For the first LDA, almost all of the variation was explained by axis 1 (99.5%), most positively correlated with the confidence the participant had in the establishment prior to visiting. Similarly, an absence of preparation was likely to result in a less happy experience. For the second LDA, the predictors most correlated with linear discriminant axis 1, which accounted for 90% of variation in overall happiness were the pre-planning index, the on-arrival index and the confidence the participant had in the establishment prior to visiting. (The full LDA outputs can be viewed in the supplemental files in journal publication).
Model-averaged multiple linear regression of how welcome participants felt further validated the importance of a priori value judgements of the venue. The most parsimonious model (F(3,75), = 20.03, p < 0.001, adj. R2 = 0.42) included the confidence the participant had in the establishment prior to visiting (β = 0.15, P < 0.001) and the pre-planning index (β = 0.11, P = 0.011).
Indicators of a good experience at pre-planning and arrival stages
Given the importance of the pre-planning stage in predicting overall happiness with the eating out experience and the assessment of how welcoming the venue is, we looked in more detail at what the most important elements of the pre-planning experience were. We found that whether the information found during pre-planning was sufficient to make a confident decision concerning the allergen(s) that needed to be avoided, whether the allergen information given was understandable or accessible and, to a lesser extent, the confidence the participant had in the establishment prior to visiting positively contributed to the eating out experiences; happiness was lower when allergen information was wanted but unable to be found.
A model-averaging approach was used to identify important indicators of a good experience at the pre-planning (n = 82)[3]. A total of 20 variables related to the experience of planning and information accessed in advance of a visit to an establishment, and knowledge and familiarity with the venue, were included in the multiple linear regression procedure (See supplemental files in journal publication for the 20 variables). Four pre-planning variables were identified as significant predictors within the most parsimonious model (F(4, 77) = 59.45, P < 0.001, adj. R2 = 0.74). Positively associated with the index was whether the information found was sufficient to make a confident decision concerning the allergen(s) that needed to be avoided (β = 2.81, P < 0.001), whether the allergen information given was understandable or accessible (β = 2.28, P < 0.001). The confidence the participant had in the establishment prior to visiting (β = 0.43, P < 0.003) was of marginally lower power, while there was a significant negative association when allergen information was wanted but unable to be found (β = -1.29, P = 0.005).
The qualitative data that was provided in the survey also indicated the importance of pre-planning and the constraints that having a FHS places on the possibility of spontaneity. Participants said that eating out events that were not pre-planned were memorable and rare events, noted the necessity to carry suitable snacks to avoid unplanned eating out occasions, and recounted the range of pre-planning options – phone and in person conversations, emails websites and other online information sources.
So, I feel like I was, because I was already in the mode of, ‘I need to prep because I need to speak to them beforehand, I’ll speak to them when I’m there, I’ll have everything all ready’ it was almost like it became part of that sequence so that I already had my very over-the-top plan of what I needed to do to make sure that there was something safe for me to have, that I had my designated leg stabber ready with me when I was having the meal but yeah. – Interviewee P007
Yeah, you know, I have to, well as with anybody with something like this, you do have to plan. You can’t just do the, oh I’ll go out and we’ll go here and go to the pub. You can’t. You’ve got to think, ‘well is that pub likely to do gluten free food or not’… – Interviewee P008
The discussions in the workshop suggested that the pre-planning process was not simply geared to finding out what the meal options were. At a more basic level it was about discerning if it was a suitable venue to eat in at all. Even if some signals were positive were good – for example if allergens were listed on the menu, this could be negated by other signs, for example if there was no response from the venue to an email asking an allergen related question. An ideal pre-planning process meant arriving at the venue being confident which dishes were available that were suitable and thus being able to arrive at the venue being confident about that a suitable meal could be ordered.
Pre-planning strategies: The use of online information
In the survey participants were asked about their pre-planning strategies and the sources of information that they used to plan. Of the 100 instances in which participants pre-planned prior to eating out[4], allergen information was sought online in 80% of them. Table 1 shows the reliance on online information compared with information gathered verbally from others. Expert accreditation was also selected and of course this information too may have been accessed online. Of the 80 instances in which allergen information was obtained from an online source, 69 (75%) only used online information and did not report complementing this with other person-to-person strategies. In contrast only 19 (19%) of those that pre-planned only used information gathered through interacting with others i.e. not referring to online information at all.
Overwhelmingly the main source of online information was the website of the establishment that was being considered (n = 76) with other sources of online information being online reviews (n = 13) or asking the community through social media (n = 11) or by emailing the venue (n = 8).
Responses to open ended questions in the survey and interview and workshop data suggest that the menu on websites of the potential eating out venue were a key source of information not least as they provide the most definitive information as to whether there were any or many meals that were suitable for those trying to avoid single or multiple allergens. More detailed information was welcomed by some – for example full ingredients lists were helpful for those seeking to avoid allergens beyond the regulated 14 allergens. A table of the 14 allergens with a filter option was considered especially useful for those seeking to avoid multiple allergens. Participants also gave examples of how the pre-planning that they did through venue websites also informed them about the likelihood of cross contamination.
It was given as a drop-down section within the allergen menu, stating that cross contamination with certain allergens may occur. Very clear and used symbols for each allergen (eg gluten was a sheaf of wheat and milk was a glass of milk) – Survey response 91, Sit-in
The online menu said that there was little gluten containing items on the menu and cross-contamination was ‘actively avoided’. In an email exchange with the restaurant I was informed that there was very low risk as there was so little gluten on the menu and that cross contamination was very unlikely. – Survey response 201, Sit-in
Venue websites were considered as more reliable and easily accessed source of information than emails that were not answered or phone calls that felt less conclusive and definite. The availability and accessibility of allergen information on websites was not simply a means to reassure whether there would be suitable meal options. It also served as an indication of and a proxy for the overall stance that the venue had to welcoming those with a food hypersensitivity. If information about allergens was difficult to access or unclear on venue websites, or there were differences in the online and in-venue menu information, for some this served as a signal that negotiating an allergen-free meal could well be problematic.
Eighteen citizen scientists (18%) said that the allergen information they accessed during the pre-planning phase was not understandable and/or accessible. The main reasons for this in relation to websites was difficulty locating it, inconsistency between different presentations of allergen information, too much complexity or too little clarity, all of which constrained confident decision making.
Their allergy menu is a separate booklet (or digital PDF) to the main menu and rather than have a list of dishes listed and then their allergens, it is done by allergen. So for example there is a page of ‘Egg free dishes’ with a list of dishes not containing egg, then one for ‘Fish’, ‘Milk’ etc. This may seem helpful, but for anyone who has two or more allergies, you have to awkwardly flick back and forth to cross reference. Also, this menu does not have the dish description as the main menu does, so you would still want to look at the main menu as well. – Survey response 121, Sit-in
The website had menu information in two formats - a downloadable PDF and a HTML version of the PDF. Only the PDF had an explanation of what Gluten Free meant. The main menu had asterisks by gluten free items but no explanation of what this meant. I had to search to find the downloadable menu. – Survey response 164, Sit-in
Twenty nine citizen scientists (29%) said that they could not find information they wanted on the website to inform their preplanning. Details about the desired information was provided by 27 of these participants. This ranged from wanting more allergen information e.g. detailed ingredients lists (especially crucial if the index allergen is not one of the regulated 14 allergens), more efficient ways to search for information, different formats for information (such as an allergen matrix), and ‘may contain’/cross-contamination information. Lack of staff awareness of the information provided on the websites of their establishment compounded concerns.
There was no allergen information online, so I had to use the menu to assess if there was likely to be something available that I could eat. – Survey response 175, Sit-in
Pub restaurant had an online menu which allowed you to select allergen filters and only suitable dishes were displayed. But it didn’t seem to work and/or there was no confirmation that it was working. Later on, in the restaurant, it was clear that the online menu wasn’t the same as the actual menu. Starting to get a bit worried. – Survey response 110, Sit-in
I was informed by staff that there may be cross contamination due to gluten containing products being prepared in the kitchen. I tried to find further details, but staff were unable to give me any more information. – Survey response 128, Sit-in
Seventy six participants (78%) said the information they were provided during pre-planning was sufficient to enable them to make a confident decision and 22% said it was not sufficient. Eighty eight people provided additional qualitative detail as to why or why not the information was sufficient to make a confident decision.
Comprehensive website menu options that enabled a clear and confident appraisal of which dishes to select to avoid the index allergens were ideal. It was noted that an on-line tool that allowed exclusion of dishes with particular allergens was preferable to choosing a dish in person where no such selection process was possible. Confidence sometimes derived from a more general appraisal of the extent of the visibility of information and attention that was given to allergens rather than from the presence of allergen filter and selection tools. For example, looking at the menu online can indicate (e.g.) how simple the dishes are, the amount of choice available, how much attention is given to allergens in general. This information enables a baseline assessment of risk which can precede decisions about the presence or absence of allergens in a particular dish. In addition to pre-planning online - for some, visiting or seeing the venue, either as part of pre planning or when arriving at the venue to eat, contributed to assessments of suitability and safety. In the first quote below the willingness to adapt an existing menu highlighted in the online information served to indicate that this was an establishment that was willing to cater for FHS – at least in respect of those avoiding gluten. The subsequent quotes serve to illustrate a key finding that allergen filters that recommend all the dishes that exclude particular allergens (from the regulated 14) were particularly valued.
Looked at menu online. Gluten free meals and “can be made gluten free” clearly marked. Appeared to be a good choice of reasonably priced traditional pub food that was gluten free. I think you can sometimes get the measure of a restaurant if they have a vegan/gf offering - like mushroom risotto. It’s a signal that the menu has been designed to offer something for everyone. – Survey response 195, Sit-in
I had to select ‘allergen to avoid’ options on their website menu online. If I went in person this information would have been unavailable on their menu. – Survey response 4, Sit-in
The allergy filter was useful because you could tick boxes to exclude allergens and then be shown dishes which do not contain these foods. There is also an allergy matrix which even has a symbol to show when dishes can be altered to remove allergens, which will increase the number of options for allergy sufferers. This is all the main 14 allergens so anything beyond would need to be inquired about with staff at the venue. – Survey response 180, Sit-in
The [venue] website has a full allergen matrix so you can click to only show dishes without those allergens which makes it so much easier to then have options beforehand and only request info about those dishes for the ‘may contain’ info and the other allergens outside of the 14. – Survey response 256, Sit-in
We can also consider what happened in the pre-planning process to undermine participants confidence to make good decisions. This included where a lack of information, a lack of clear information, inconsistent information or mistakes were perceived. Confidence was also undermined when the online interface was not easy to navigate.
One dish I was interested in was a steak, but the allergen filter said this contained milk. It was unclear whether this was just the sauce (i.e. could be taken out), or whether this was preparation of the steak itself. – Survey response 15, Sit-in
There was no allergen info available on their website at all, but other gluten avoiders had written TripAdvisor reviews which helped. – Survey response 72, Sit-in
Information was patchy and interactive website reduced menu to minimal choices. – Survey response 110, Sit-in
There was not allergy information on the website but there was a message about allergies which implied that I would be able to get this information at the restaurant. – Survey response 136, Sit-in
Some of the food items did not appear on the menu that were on the website. – Survey response 142, Sit-in
As noted earlier, sometimes during preplanning online information from the venue is combined with other on or off-line information to inform decision making. For example, the reputation and accreditation of the venue, how busy and popular, clean and professional it appears to be may affect inferences that are made about their likely ability to cater well for those with a FHS. This information may be inferred first-hand from early viewing or engagement with the venue, from a previous visit or from others (again on- or off-line) that have some experience with the venue. It is worth noting here that the participants were more likely to pre-plan if they had never visited the venue before although many without previous experience of the venue did not report any pre-planning activities. The quotes below illustrate a range of information sources that people accessed which served to build their trust in the venue and increase their confidence that there were safe and enjoyable menu options: friends, online recommendations, social media sites, engagement with staff at the venue all played a role.
My friends who had eaten there before reassured me and there was a message about allergies on the website implying their awareness and that they would have allergy information on site. – Survey response 136, Sit-in
Recommendations on Find Me GF, and on Facebook group. Menu was marked with gluten-free items clearly. Website said owner was coeliac so seemed safe due to first hand experience. – Survey response 241, Sit-in
Phone and email contact with management was excellent. They didn’t sound fearful and were keen to find something for me to have and have an enjoyable night, explained several times that the manager would handle bringing food for me that they oversee it, that the chef was prepping it specifically for me, that they use many processes to eliminate the risk of cross contamination - interestingly enough the manager also said he has food intolerances - but nothing severe like mine - but perhaps this is why they were so on it. – Survey response 256, Sit-in
Signals during pre-planning that undermined trust and confidence included witnessing mistakes, lack of information online or in-person, no information beyond the regulated 14 allergens, the venue not being able to guarantee 100% allergen-free dishes, the online interface not working properly, and controversial online reviews.
Not sure allergen filters worked properly. – Survey response 110, Sit
There was little information online and having to phone in for details was not ideal. – Survey response 114, Sit-in
No allergen information online, and no email response. – Survey response 175, Sit-in
Participants also noted the opportunities on-line that they had to inform the venue of their dietary requirements and disclose their FHS at the pre-planning stage. This was enabled either through the booking system itself with a section asking if there were any special dietary needs/requests or through an email directly to the restaurant.
Arriving at the venue: the use of on-line information
Once at the venue, engaging in-person with staff around meal choice and the presence of allergens is arguably the default option. Indeed, we saw that on arrival 127 (71% out of 178) did engage in-person. However, 57 (32%) also searched for information on-line upon arrival and 38 (21%) said that they only used on-line information once at the venue. This was facilitated by the venue and their provision of website links or QR codes on the menu.
The fact that they had a little allergen sheet on every table made it very useful and trustworthy. Even for those who may have been scared or worried of asking, this made it easy with not hassle as all they had to do was to scan a QR code and it would take them straight to a website with all the information they’d need. – Survey response 23, Sit-in
Allergen notification listed on menu directing me to a dedicated website [link of website provided]. – Survey response 20, Sit-in
The main menu has a QR code which you can scan to give you a detailed allergen menu (even providing ingredients and break downs of certain dishes). – Survey response 120, Sit-in
As was the case at the pre-planning stage, the online allergen exclusion matrix was considered as a valuable way of being able to visualise available options.
Was able to clearly filter out allergens from the menu using website, and it showed me safe meals/options. – Survey response 20, Sit-in
Information provided at the end of project workshops suggested that some disliked having to go on-line when at the venue to look at the allergen information finding it hard to interpret the information in the moment. Others were more positive, again noting the benefits of the allergen filter option. The motivation for checking the venue website post arrival can include accessing more allergy information than is present on the paper-based menus and provides a way of checking how consistency of the information the venue is providing.
Colour coded menu online matched the photocopy menu I was given with allergen info, meant I could choose beforehand and felt confident seeing the same dishes on online menu and in person that there weren’t any new surprises in the menu / new risk. – Survey response 250, Sit-in
They seemed to be having a bad day. It became clear that the online menu was not same a printed table menu. But on line menu was the source of allergen information through the allergen filters. – Survey response 110, Sit-in
The use of on-line information in the venue was sometimes integrated with the provision of in-person information. Firstly, participants noted that staff at the establishment may use on-line sources of information when responding to in-person queries. Secondly, seeing customers using menu information on-line can prompt queries from members of staff.
An allergen guide on a small piece of paper separate to main menu. Also communicated directly from Manager using his iPad. – Survey response 22, Sit-in
Manager had an iPad with all relevant information about every dish and ingredient used. – Survey response 79, Sit-in
Staff saw I was looking at allergen website, asked if she could help and also made a note on our order. – Survey response 20, Sit-in
I was using the online menu which triggered the staff member to ask what the allergy was i advised it was coeliac and she very happily provided a proper physical menu for me. – Survey response 204, Sit-in
We also had examples of the use of screen kiosks for ordering where the engagement with venue staff is likely to be much more minimal. It is in-venue online engagement where decisions about allergens and orders are implemented.
At this establishment when ordering on the screens (which is the procedure since the pandemic), the menu allows you to view a list of ingredients for each item. Allergens are in bold like normal, but you can also see every ingredient, which is extremely helpful. – Survey response 119, Takeaway
Finally, when reflecting on how satisfied they were with the overall eating out experience, it was interesting that the lack of provision of on-line information that could be checked at the pre-planning stage was raised as a source of dissatisfaction.
I would have liked to have had the allergen list on the website so that I felt less rushed looking at the information and could have gone through it in more detail. – Survey response 136, Sit-in
Allergen info on the website would be a big help, and allergen information with the menu would enable me to have more choice, instead of choosing the thing I thought would be safe and then checking that. – Survey response 175, Sit-in
If I had not checked the menu before visiting I would of had great difficulty checking available meals. Menu only indicated vegan/vegetarian options. Did not indicate which I ingredients or allergens each dish contained. I would prefer the menu stated GF next to a menu item. – Survey response 240, Sit-in
Overall, the information that participants provided about their experiences of arriving at the venue further emphasised the value that was given to online information seeking. Information seeking strategies once at the venue did not simply switch to paper-based information and/or to in-person interactions. Rather on-line information sources continued to be used, sometimes explicitly prompted by the venue provision of links or QR codes or by staff using on-line information as part of their service provision. As well as providing information about the available meal options, noting discrepancies between the various sources of information – or indeed their absence - provided a more general indication of the extent to which the venue might be trusted.
Citizen science outcomes
Results
A total of 241 observations were collected about people’s eating out experiences. Of these, 44 (18.3%) regarded pre-packed, take-away meals for consumption at home, and the remaining 197 (81.7%) reported on a dining experience. 127 people indicated a willingness to participate in the project by at least beginning the registration process. As part of the registration process, citizen scientists were asked to provide unique identifiers (ID). Six failed to provide a unique ID. Data was submitted by 66 unique IDs (with seven observations submitted without a unique ID). Thus, the conversion rate from registrant to participant was at least 52.0%.
No factor gathered during the registration process was a good predictor of whether a registrant would go on to submit data (i.e., ‘convert’). However, the age and gender of the allergen sufferer were both of marginal significance (P < 0.1), as was how people heard about the project. Citizens answering on behalf of a child they care for were poor converts as well as those aged between 16 and 24 and aged 25 to 34, and females were more likely to contribute observations than males. Those people who registered having heard about the project via Twitter, Instagram or Anaphylaxis UK website were less likely to convert whereas those who heard about the project via Facebook or Coeliac UK website were more likely to go on to submit data Citizen scientist engagement
Quantitative assessment
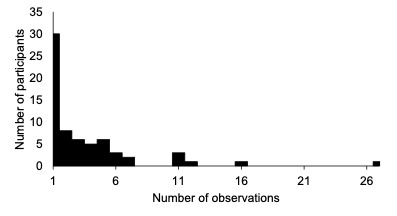
The median survey contribution from the 66 participants who submitted at least one observation was 2 (min. 1, max. 27), with 30 (45.5%) contributing once and 36 (54.5%) contributing more than once (Source: Qualtrics eating out survey Figure). Half (49.85) of the observations were submitted by 11 participants, with one super-responder contributing 27 observations (11.2%).
From the 118 citizens who responded when asked whether they would be happy to take part in the post-project interviews, 100 (84.7%) agreed to be contacted. Out of the 115 who responded with regards to the end of project workshop, 101 (87.8%) agreed to be contacted and, out of the 117 who responded to their willingness to take part in future research on this topic, 115 (98.3%) agreed to be contacted.
When reviewing the completeness, or degree of error across the stages within the eating out journey there was some evidence of question skipping. When asked whether any pre-planning occurred, or whether any further allergen information was sought upon arrival at the venue, four (2.0%) and six (3.0%) responses were empty. The average completeness of five non-mandatory questions at pre-planning, where pre-planning was stated as undertaken, was 98.9%, meaning questions were rarely skipped. By contrast, an average of 1.4 questions (17.5%) were skipped from eight posed during the arrival phase. On average less than one question was skipped from eight at the ordering stage (completeness = 93.1%). Each observation also included eight preliminary, non-mandatory questions, of which one question (11.6%) was usually skipped. Most people responded to the three questions asked once the eating out experience was complete (completeness = 86.0%). The opportunity to leave qualitative answers was taken on 93% of occasions across all stages of the survey.
Alongside the survey component, relatively few interactions were observed through the dedicated private Facebook group (n = 23; 19% of project participants). The types of interactions were 11 posts (3 of which were made by the participants and one of which was a picture displaying cross contamination), seven comments (4 of which were made by participants), and 41 reactions (23 of which came from participants).
Advantages of the citizen science method
Some of the post-survey interviews demonstrated how the citizen science approach allowed for a more detailed reflection of the eating out process:
…and I quite liked being able to put the photos in and just say what sort of places were suitable for me and the reaction of the people in those restaurants and things because I’ve had some very, very good people that I’ve encountered and others who look absolutely terrified. So, I think it was good to be able to put across not just what was available on the menu or the allergy list that was available but also what the people were like there and the ongoing contact and the back and forth that we have to do… – Interviewee 007
Similarly, the detailed account of eating out experiences facilitated by the method was found to be personally beneficial for some participants. Here, participants expressed how it aided reflection of the participants own methods of assessing risk and making decisions:
I found it very interesting because it made me realise patterns in my own behaviour and certain things about myself that, because I’ve had food allergies all my life, I’ve just not thought about because it’s just normal to me to do those things, and so I found it really interesting […] especially with the repeated experiences, you’re getting trends and so I feel like a bit like how I said I felt trends in my own behaviour, if you are getting people to put in their data multiple times and multiple experiences, you’re going to get a more balanced view over a period of time, what people’s experience is like… – Interviewee P001
That said, I also found the process illuminating for myself, I never remember who knows what about me now abut I have celiac disease which is one of the reasons I was asked to be part of it. I was quite struck in thinking about being part of the survey and then thinking about eating out and filling in the survey, actually how little I now eat out as a result of my condition and how it kind of illuminated for me, how frightening out can be and the process and how socially stifling it all is. – Interviewee P002
I suppose it probably made me stop and think a bit, because I got diagnosed what, 10 years ago, just over 10 years ago, and I’m probably quite used to going out and eating in restaurants […] So yeah, it made me more aware of what the restaurants offer, but also I probably didn’t realise how much I rely on my own knowledge of what goes into dishes, and being able to make an informed decision. – Interviewee P008
There were also some indications of the communal nature of the project that reflected the coordination and co-design process and degree to which participants felt involved:
I’m normally on the other side of this but it did feel like part of the project, yes because of the regular updates, because of the Facebook group. I participate in several projects where I feed in data on a regular basis for various things and I feel less part of it but on the other hand, I don’t feel that changes how I feel I should be involved, if that makes sense. – Interviewee P003)
I also liked the fact that some of the things that we suggested became part of the questionnaire, I know something I suggested was there and a couple of other people said things that I then saw in the questionnaire when it was finalised. It was nice to feel that we weren’t rubberstamping something but that we were an active part of it, which I liked. – Interviewee P002
So I think that was really useful and the survey ended up being what people had said would be useful to ask. I think just kind of listening to the things that you wanted to know about was really helpful and other people’s views on ask a question about whether they identify food by flags, different plates, whatever, that if you haven’t eaten out with an allergy probably wouldn’t ever notice. I felt very listened to. There was a lot of listening in the sessions and a lot of kind of cross-checking about what people had said that you’d got it right, that’s that what they meant and I think that’s why those sessions, it felt quite structured but also very free to say what you wanted to say and people didn’t judge each other. – Interviewee P005
Sense of importance and community
In addition to the more extrinsic benefits highlighted above, more direct evidence was demonstrated that expressed more intrinsic motivations to take part in the project:
…it’s [food hypersensitivity] something that as I say, has affected me my whole life, we have to eat food every day so it’s something that is with you all the time and it’s also something that while it’s on the increase and there are a lot of organisations talking about it, there’s also still a lot of real lack of awareness around and so for me, any time where there’s something like a survey or something going on, it’s like ‘wow, people are listening to us, people are interested in the problems we have’, I like it and I want to engage with it because someone wants to listen. – Interviewee P001
But yes, and I can totally see that that would encourage people to be involved, especially also in this case because it’s a relevant research study, most of the other ones I’m involved in are generic ones where I’m a healthy control. – Interviewee P003
Furthermore, the interviews highlighted the importance of receiving outputs from their contributions by being updated on results through fortnightly newsletters which made them feel continuously part of the research:
I liked the fact that it said about how many contributions they’ve had and they talked about specific parts of the survey because [a] I found it interesting and [b] it makes you feel like what you’re doing is helpful and is helping someone. – Interviewee P001
We were getting the bi-weekly emails and seeing the graphs and stuff and also, another thing that was really nice about the bi-weekly emails was the fact that it quoted specific things because then I’d be like, “Mum, look, they’ve quoted something that I wrote”, which was quite nice! It was like “Ah look, my data’s doing something”, that was nice because it felt like what you were doing wasn’t going into a robot somewhere, it was actually being looked at and I think I would have [inaudible 00:15:21] doing it anyway but I think if you had been unsure, that would be something that keep you putting things in. –Interviewee P001
Citizen scientists also appreciated being able to hear other people’s views and eating habits through the workshops and the newsletter updates to reflect on how similar or different those were from their own patterns:
It was really interesting to hear other people’s views of their experiences and what they expect and what they don’t want, what they do want and I was like, ‘I’m not like that, I think something different’. – Interviewee P005
I thought they were interesting, I liked seeing like how it was developing in terms of how many things had been registered as well because I was interested in like I guess how many other people were reporting this stuff. But it was, I think I liked seeing what we knew so far, like and the areas of interest were good because it was sometimes things I hadn’t thought about and things I started looking out for. – Interviewee P009
Opportunities for improvement
Interviewees also provided more pragmatic feedback in terms of the survey design and implementation such as enjoying the Qualtrics software, appreciating the use of multiple choice and free text and photos to provide answers, and enjoying the different opportunities for elaboration. They provided feedback on what could have been improved in terms of question design (possible repetitiveness, length), use of alternate methods to implement the project (using WhatsApp to provide reminders, creating an app space where everything is available), Facebook not working (preferring other types of social media platforms), appreciating the length of time (4 months) to re-enter data, etc. Some examples are provided in the following quotes:
On the whole, the interface was quite easy, there were some questions where I wasn’t really sure what they were for, they seemed to be duplicates of questions that were already there. I would have really liked an option to save a place so I could just fill in the same experience again. – Interviewee P003
…if there was like an app or something that you could log it in on there, if that would have made it a little bit easier for most people. Because then, if you could put all the bits in beforehand, like the restaurant and the place, then you would just do a bit afterwards, maybe that would have made it a bit easier or more accessible for a lot more people. –Interviewee P007
Being able to go back to, say enter a profile the same place, questions like, “When you first heard about this, did you hear about how allergy friendly it was?” etc., that’s always the same for the same restaurant and to be honest, the experience is usually the same, that’s why I go back there. That would have been convenient. No, not really, there were some questions that I found slightly, I’m sure they were there for a reason but the how did you, there was a question of “Are you sure this was the right dish?” and “what made you sure of this?”, it was like, it was the right food, I asked for this thing, it was this thing, I find it a slightly odd question to answer. – Interviewee P003
I joined the Facebook group because I wanted to get involved but then to be honest, there were maybe two people who asked questions in there and not much happened with it, which was a shame although obviously, slightly hypocritical, I also didn’t post in there at all so I’m not really sure. I think maybe that would have been nice but at the same time, I’m not really sure what you could have done with it. I suppose in theory, the bi-weekly emails, did they get posted in there because I don’t think they did, did they? –Interviewee P007
The emails certainly reminded me, partly because they tended to come towards the end of the week and if I do eat out, I tend to eat out at the weekend. The Facebook group, less so, partly I think Facebook is kind of dying technology, social media wise but actually, maybe something like a text message or a WhatsApp message where again, email doesn’t, I know partly because of my work in IT, emails are actually usually ignored these days, a text message or a WhatsApp message saying, ‘Don’t forget to do your survey this week’ or ‘Did you eat out over the weekend? Remember to tell us’, that sort of, a bit of variance would have helped trigger that, encourage it. – Interviewee P002
Conclusions and Implications
The participation of citizen scientists with FHS has addressed two broad aims. The first sought to identify the stages and components of the eating out journey that are most formative of a good eating out experience for those with FHS. A second aim was to identify any added value of embedding citizen science in our consideration of eating out experiences for those with FHS.
Eating out with FHS
One unique benefit of working with citizen scientists to explore their experiences of the eating out journey is the possibility of focusing on detailed accounts of discrete eating out experiences with the data being captured in near real time. Taking this approach has contributed to the allergy related research literature in two main ways. It indicated the particular importance of the pre-planning phase to a positive eating out experience. It also identified the importance of on-line information not only to pre-planning but also within the venue itself. Recommendations can also be developed for food businesses as to optimising the content of their website and how this might best be linked to information provision practices - both written and via their staff - within the venue.
The primacy of pre-planning
Compared with the phases of arriving at the venue and ordering/food arrival engagement with pre-planning was the most important predictor of how happy they were with the eating out experience and how welcome they felt. A closer look at the pre-planning index enabled identification of the most important indicators of a good pre-planning experience. The quality and sufficiency of the information identified was key. Finding no information was considered as heralding a bad experience. A good pre-planning experience meant finding sufficient information to make confident decisions about what to avoid and that allergen information was understandable or accessible. It is instructive to consider these results in line with previous research that found that greater confidence in the information provided by eating out venues was associated with better quality of life (Barnett et al., 2017) and that frequent checking of information predicted poorer quality of life. It seems reasonable to suggest that insofar as frequent checking results from dissatisfaction with the information provided, being able to access detailed, relevant, understandable and consistent information about allergens as part of pre-planning activities will provide some assurance of the ability of the venue to cater effectively for those that need to avoid particular allergens. In turn this will help ensure further checks at later stages of the eating out journey are proportionate rather than excessive.
Information seeking on-line
The other notable finding which advances our understanding of the nature of information seeking practices concerns the importance of online information. Access to and use of online information resources has rarely been considered in the relevant literature (Begen et al., 2016, 2018). Certainly this work established that those seeking to avoid allergens generally preferred written information in the first instance. However there was little mention of online information and where there was, it was referred to in a very general and non-specific way, for example “I usually look online - thank God for the internet – at what their menu is”; " If you are going in a few days, you can Google what the recipe sort of thing… so you know it is basically Googling things" (Begen et al., 2016).
Before reflecting in more detail about the ways in which online information about allergens was sought and used by citizen science participants, it is important to bear in mind that since this work was conducted there has been a considerable acceleration in the digitisation of business-customer interactions (McKinsey, 2020) primarily due to the restrictions of COVID-19 pandemic. It is therefore important to acknowledge that the possibilities of information capture and exchange in online settings has increased since the studies noted above were conducted.
Against this backdrop we have noted the extensive reliance of those with FHS on online information sources. This was mainly evident at the pre-planning stage of the eating out journey. Three quarters of those using online information at this stage did not supplement this with other information. The website of the eating out venue was the main source of information.
Two particular - and quite different aspects – of the information that was provided are useful to consider in more detail here. One was the ‘allergen filter tool’. This is particularly useful for those seeking to avoid more than one allergen. When the index allergens (from the regulated 14) were selected, all of the possible meals that fit the allergen requirements are then listed. This provides more useful written information than is often available within the venue itself where the opposite process is involved: a possible meal is selected which leads to a consideration and confirmation of the allergen content.
In contrast to the value of tools such as the allergen filter or matrix, it is important to note the more general signals that online information provides can serve as a ‘diagnosis’ of how likely it is that the venue will be willing and able to provide a safe meal. If there is information missing, or inconsistent, or unclear this undermines confidence. In contrast written information simply conveying a willingness to adapt a meal was a signal of attentiveness to allergens and indicative of good service. This chimes with previous work indicating the characteristics of the venue (such as how clean it is) and the staff (how professional they are) are taken as proxies for the likely care that will be taken around allergens (Barnett et al., 2013).
The experiences of citizen scientists when eating out also highlighted the role of online information after arriving at the venue. They recounted examples staff at the establishment using on-line sources of information when responding to in-person queries. This included tablets being provided to help select a suitable meal, meal selection in fast food restaurants being done via screen kiosks, and staff pointing them in the direction of web links or QR codes that enable customers to select a meal with acceptable ingredients.
This citizen science exploration of the experiences of food hypersensitivity has highlighted the importance of the preplanning phase of the eating out journey and the way in which online information, particularly from venue websites can support confident meal choices and trust in the venue to provide safe choices. Information on venue websites should be accessible, clear, accurate, consistent with other information provided in the venue and straightforward to access and use.
Reflections on Citizen science
Evidence of participant engagement
Drawing comparisons of participant engagement between projects is complex, however, there is evidence here to suggest that the nature of this project resulted in high levels of engagement. A conversion rate from registrant to contributing citizen scientist of 52% appears high. There are examples from citizen science in the natural sciences, where 43% of engaged citizens submitted data on precipitation around Lake Tahoe (Arienzo et al., 2021), 38% of registrants went on to submit ecological data to Evolution MegaLab (Worthington et al., 2012). Of those that undertook training for FreshWater Water, a global citizen science water quality programme, only 20% went on to submit data (August et al., 2019), and only 10% of survey packs distributed by the Open Air Laboratory Project (OPAL), were ever returned (Lakeman-Fraser et al., 2016), with several other projects having conversion rates of less than 10% (Brodie et al., 2023; Cohnstaedt et al., 2016). Although it should be noted that the definition of conversion rate varies.
According to the activity ratio, the volunteer engagement profile was comparable to those across three well established UK biodiversity recording schemes (Boakes et al., 2016), with a very similar distribution to iRecord. However, there was a relatively high proportion of dabblers in the present project (84.8%), especially when compared to a project on the popular crowdsourcing platform Zooniverse (Anhalt-Depies et al., 2022) where 65.7% were classed as such (short or long term). However, activity ratio is only one of four engagement metrics that might be applied if more information on participation was available (Ponciano and Brasileiro 2014). To this end, the availability of opportunities for participation in the present project is unusually constrained when compared to conventional citizen science projects whereby the relative period for participation is restricted to eating out opportunities. Decisions to eat out are influenced by financial freedom, logistics, work commitments and social factors. Moreover, there is added caution applied by those eating out with a FHS (Leftwich et al 2010; Worsfold, 2007). Consequently, a number of participants labelled as dabblers may have a higher activity ratio if the project duration was longer.
A reason for such apparent high conversion from registrant to participant, and also for the high degree of completeness demonstrated by the participants carrying out the surveys, is likely due to intrinsic motivations; the desire to volunteer because it is in some way inherently interesting or satisfying (Finkelstien, 2009). Intrinsic motivations are anticipated to be positively related to contribution quantity (Nov et al., 2014) and are a well-established driver of volunteerism (Deci & Ryan, 2000). Intrinsic motivations can be divided into egoistical (i.e., caring for oneself) and altruistic (i.e., caring for others or the world around you). Here, the personal nature of the topic likely drives a strong level of egoistical intrinsic motivation and agrees with previous findings in environmental monitoring that there is a strong desire to be driven by self-directed and/or altruistic motives (Kragh, 2016).
Here, egoistical intrinsic motivations were also evidenced by interviewees expressing how taking part encouraged self-reflection on their own eating out experiences. However, more altruistic intrinsic motivations were also indicated by feelings of community and that they were contributing to something important. Supporting science has previously been identified as an important motivating factor in community driven research (Davies et al., 2011), and biodiversity recording (Hobbs & White, 2012). Social networks and community have similarly been shown to be an effective driver of participant engagement in several other citizen science projects (Asah & Blahna, 2013; August et al., 2019).
Resourcing
There were fundamental logistical barriers to achieving co-creation in the present project due to the established funding proposal process that required project specifics prior to any co-design process could be undertaken, and the need to provide a detailed ethics assessment before engaging with prospective citizen scientists. Thus, critical stakeholders could only be engaged after the research aims and general method were decided. Therefore, to an extent the project environment could not accommodate that co-creation requires time, resource and needs to involve all relevant groups to increase the chance of balancing interests and maximizing impact (Hecker, Haklay, et al., 2018).
Fostering relationships
Co-design of projects can increase the social relevance of citizen science projects by ensuring that they address topics of societal interest and enhancing in-depth participation and ownership (Ballard et al., 2017; Shirk et al., 2012). Although often used interchangeably, co-design and co-creation contrast. Central to the concept of co-creation is the belief that all people are creative and seek outlets for creativity in their lives (Sanders and Simons, 2009), and occurs at all project stages (Vargas et al., 2022).
Nevertheless, the co-design process employed here that attempted to represent a diverse set of stakeholders was generally applauded by active participants and did allow for some collaboration. However, the effect of not being able to undertake a thorough co-creation process upon conversion and participant engagement cannot be assessed.
Ensuring reciprocal benefits
Making the citizen scientists feel actively part of the research requires not only planned opportunities to do so (i.e.: setting up workshops) but consistent ongoing engagement that promotes two-way communication from start (creation of materials) to the end of the project (dissemination of results) rather than simply from start to end of data collection period.
Conclusion
This citizen science project addressed two aims. First, citizen scientists collected information about the ways in which they assess allergen related risks when they are eating out. This allowed the exploration of discrete and near real-time experiences of eating out to help assess what information is valued by those with FHS when eating out, what sources of information are most valued at what stages in the eating out journey. We learnt the importance of pre-planning in contributing to a good experience and the importance of accessing online information from the venue as part of pre-planning as well as whilst being at the venue. Second the project activities allowed us to assess the feasibility of engaging those with FHS as citizen scientists. We were able to recruit citizen scientists with appropriate profiles of FHS and to engage many of them in collaborating and co-producing data collection protocols, collecting data and capturing their reflections both about their experiences of being a citizen scientist and about the additional insights they had into eating out with FHS.
Both the conduct and results of this project have provided important insights into the potential value of citizen science within FHS research in the future as well as how best to do this. This project focused considerable attention on maintaining close links with the citizen scientists, inviting participation in planned events such as workshops at the start and end of the project, as well as providing regular feedback via fortnightly newsletters on the progress of data collection and what was being learnt from their accounts of eating out. Such engagement requires resource and commitment on the part of the project team. In response our citizen scientists indicated that they felt listened to, that their input was valuable, that it was acknowledged and were gratified that their experiences were being taken seriously.
Peanuts, tree nuts, milk, soya, mustard, lupin, eggs, fish, molluscs, crustaceans, cereals containing gluten, sesame seeds, celery, and sulphur dioxide
This sample included only responses where pre-planning occurred and where a happiness score was provided
Sample includes instances where there are some responses to the 20 variables (but does not necessitate a happiness score to be included in sample)
The sample includes all those who responded ‘Yes’ to the binary question *“*did you do any pre-planning before ordering”