


Abbreviations
GLM Generalised Linear Model
HSC Health and Social Care
ITS Interrupted Time Series
NPS Non-Implementing Pilot Site
PS Pilot Site
SKU Stock-Keeping Units
SSB Sugar Sweetened Beverage
VMO Vending Machine Operator
Introduction
The FSA’s Making Food Better programme supports Northern Ireland food businesses in improving nutritional quality, reducing portion sizes and delivering responsible promotions. The FSA has worked with partners to develop and implement nutritional standards for vending in a range of settings, including health and social care, local councils and wider public sector. The Nutritional Standards in Health and Social Care (HSC) includes guidance for vending machines which has been implemented throughout HSC Trust premises in Northern Ireland. The FSA recently published Healthier and more sustainable vending guidance, which was developed with input from local councils, and can be used to guide any public facing premises or workplace on introducing healthier vending.
Implementation of vending nutritional standards contributes to the Northern Ireland obesity prevention strategy which commits to creating a healthier food environment and aligns with the FSA’s strategic pillar of promoting healthier, more sustainable food.
Vending machines, common in public and workplace settings, offer a practical opportunity to influence and create a healthier food environment. Implementing nutritional standards in vending helps rebalance offerings, making healthier, lower-calorie and lower-sugar options more visible and accessible without removing choice.
A phased implementation approach, as demonstrated in studies in Northern Ireland and Leeds City Council, allows for gradual reformulation, reduced portion size and product swaps, supporting consumer acceptance and supplier adaptation. Evidence from these papers shows that consistent, modest calorie reductions at scale can support the creation of a healthier food environment. Even small shifts in purchasing behaviours, from higher- to lower-calorie options, can reduce overall energy intake and support efforts to tackle obesity and diet-related diseases.
Table 1 below outlines the criteria for both sets of vending standards.
Evaluation aims and questions
This evaluation aimed to assess the impact of implementing vending nutritional standards in local council and public sector settings (using two sets of nutritional standards as outlined above). The primary focus was to explore the impact on sales and nutrition outcomes.
This evaluation also explored consumer experiences using vending machines both prior to and after the implementation of the nutritional standards, providing insight into attitudes and behavioural changes. Feedback from vending machine staff offered further insight on the implementation process. These findings will inform the future roll out of the nutritional standards and enhance FSA’s understanding of stakeholder behaviour.
The key evaluation questions were:
-
How effectively did Vending Machine Operators (VMOs) implement the nutritional standards for vending throughout the duration of the pilot?
-
Was there a change in sales volumes and the nutritional content of vending machine products, such as cold drinks and ambient snacks, post-implementation of the nutritional standards for vending?
-
Were there any changes in attitudes and behaviours of the public with regards to the products sold in vending machines?
-
What are the attitudes and behaviours of the VMO staff with regards to the vending guidance?
Methodology
This evaluation utilised a mixed-methods approach to assess the impact of implementing nutritional standards in vending machines across three public sector pilot sites, following the Joint Code of Practice. The evaluation process had the following stages:
-
Project initiation and scoping: A feasibility assessment was conducted with pilot sites to confirm viability. An evaluation protocol, pilot implementation plan and manual were co-developed with the FSA.
-
Pre-implementation data collection: Pre-implementation sales and nutritional data were collected. Consumer surveys were distributed to gather insights on vending usage and attitudes.
-
Implementation and follow-up data collection: Nutritional standards were introduced at each site and implementation was monitored. Follow-up data collection included post-implementation sales and nutritional data, consumer survey, consumer focus group, four consumer interviews and three group interviews with implementing and non-implementing VMOs.
-
Data analysis and triangulation: The collected data were analysed, including thematic analysis of stakeholder insights and statistical analysis of primary and secondary outcomes. Triangulation ensured consistency across data sources.
The evaluation included three pilot sites: Pilot Site 1 (PS1), a leisure centre located in a city, adhered to the FSA’s Healthier and more sustainable vending guidance; Pilot Site 2 (PS2), a public sector office building located in a city, adhered to the Nutritional Standards for HSC; and Pilot Site 3 (PS3), public courts located in a city centre, adhered to the Nutritional Standards for HSC.
Two Vending Machine Operators (VMO) were involved: VMO A, a large multinational vending company, responsible for PS1, and VMO B, a family run vending business, responsible for both PS2 and PS3.
Additionally, a non-implementing pilot site (NPS1), a local council located in Northern Ireland that chose not to implement the nutritional standards, took part in this evaluation to provide insights into implementation barriers and alternative perspectives.
The rest of the section presents a detailed overview of the agreed evaluation activities.
Sales and nutritional data
The aim was to collect up to one year of weekly historical sales data containing the type of product, sales quantity and price per product type for each vending machine from PS1, PS2, and PS3. Although it was initially agreed to run analysis on data obtained eight weeks pre-implementation and then follow up analysis on data obtained eight weeks post-implementation, delays in implementation at PS2 and PS3 meant that the eight weeks post implementation data period was only available for PS1.
Table 2 below shows the data collected for each pilot site, highlighting pre- and post-implementation periods, the length of continuous historic data shared by each pilot site and any gaps in this data.
Nutritional information for vending products was sourced from supermarket and manufacturer websites and validated by two team members. Metrics including energy in kcals and kilojoules, grams of fat, saturated fat, carbohydrates, sugars, fibre, sodium and protein were collected per 100g/ml of products and converted to the serving size of each product using R (R is a programming language for data analysis and visualisation). Sales and nutrition data were merged to analyse trends pre- and post-implementation. Summary statistics were generated by site and product type and visualised using bar charts and line graphs.
Statistical analysis
Statistical analysis was conducted using R software to examine the impact of the nutritional standards intervention on vending machine sales and product nutrition. Sales and nutritional data were merged for each pilot site, with pre- and post-implementation periods defined based on data availability. To assess changes, distributions of calories and sugar per unit sold were tested for normality. Due to non-normality, both parametric (paired t-tests) and non-parametric (Wilcoxon signed-rank) tests were applied.
Mixed-effects models accounted for machine-level clustering and repeated measures, estimating intervention effects on revenue, items sold, and nutritional metrics. Interrupted Time Series (ITS) models evaluated trends over time, identifying immediate and sustained changes post-implementation. Analyses were stratified by product type (snacks vs drinks), with interaction models testing differential effects. Subgroup analyses explored shifts in product mix.
Consumer surveys
Pre-implementation (n=169) and post-implementation (n=163) surveys were conducted with consumers who had recently purchased items from vending machines at PS1, PS2, and PS3. These surveys captured self-reported behaviour, satisfaction and attitudes towards vending machine choices and awareness of nutritional standards. Demographic data were collected to contextualise responses. Pre- and post-implementation surveys were analysed to identify shifts in consumer attitudes and behaviours due to intervention. Recruitment was carried out via QR codes on vending machines and face-to-face engagement at each site. To encourage participation, respondents were offered entry into a prize draw for a £50 online voucher.
Stakeholder interviews
Three group interviews were conducted with two staff from VMO A, three staff from VMO B and two staff from NPS1 to gain insight to their experience and attitudes towards the implementation process, as well as factors that may encourage and support VMOs when implementing the nutritional standards.
Consumer focus group and interviews
Further engagement with consumers was facilitated through one consumer focus group and four interviews with participants who responded to the post-implementation survey. Discussions explored consumer attitudes towards products sold in the vending machines, healthier options and advertising. Participants received a £25 online voucher. Four interviews were conducted with three female and one male participant, of which all were parents of children regularly attending the PS1 site. One focus group was conducted with two consumers from PS2 and two consumers from PS3; three female and one male participant; one participant had children.
Compliance checks
To understand the extent to which VMOs implemented nutritional standards as intended, compliance of vending machine products was monitored during site visits. This was undertaken using photographs of vending machines taken during site visits following implementation of the standards: twice for PS1 and once for PS2/PS3 given shorter implementation period. Product slot contents were compared against nutritional standards to evaluate compliance.
Limitations
The limitations of the evaluation approach are outlined below.
Impact of barrister strikes in Northern Ireland on pre-implementation data collection
The pre-implementation fieldwork for this project coincided with barrister strikes in Northern Ireland, reducing footfall at PS3.
Consumer demographics
PS1 consumers views were primarily of the parents of the children attending swimming lessons at the site, which may not be fully representative of the broader public using the facility. Only a few members of staff at PS1 took part in the survey.
PS2 and PS3 consumer views were limited to staff from the public sector organisations in those office buildings. These views reflect a specific workplace context. In addition, efforts to boost survey responses at PS3 by targeting one floor were limited by staff-raised security concerns due to sensitive cases, resulting in low response rates.
Late implementation and limited compliance by VMO B at PS2 and PS3
Product changes were rolled out at different times across sites (notably PS1 compared to PS2 and PS3), leading to inconsistent intervention periods and different levels of compliance with the nutritional standards in the post implementation period. This has been accounted for in analysis but is useful to note. As shown in Table 2 above, delays in implementation at PS2 and PS3 and gaps in PS3 data impeded our ability to conduct ITS analysis to account for seasonality and variations for these two sites.
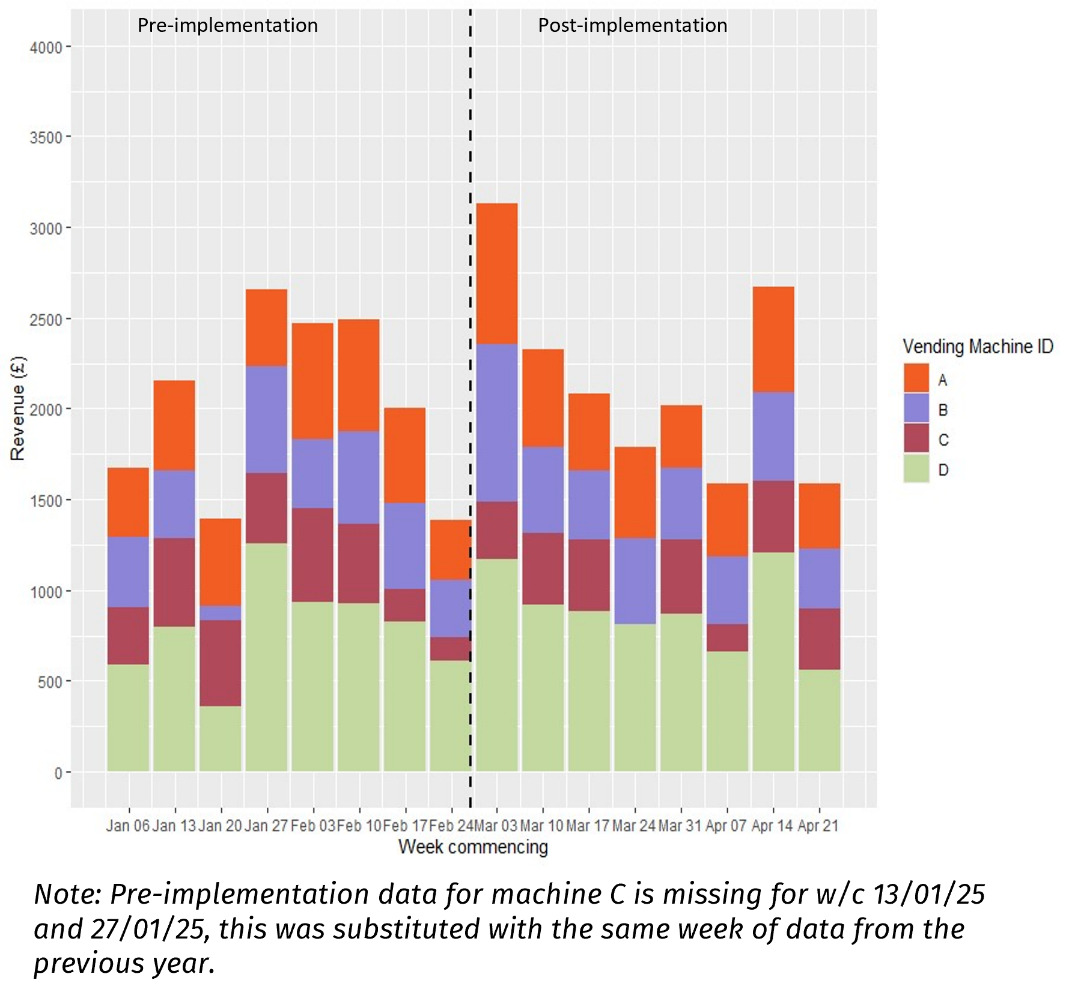
Missing data at PS1
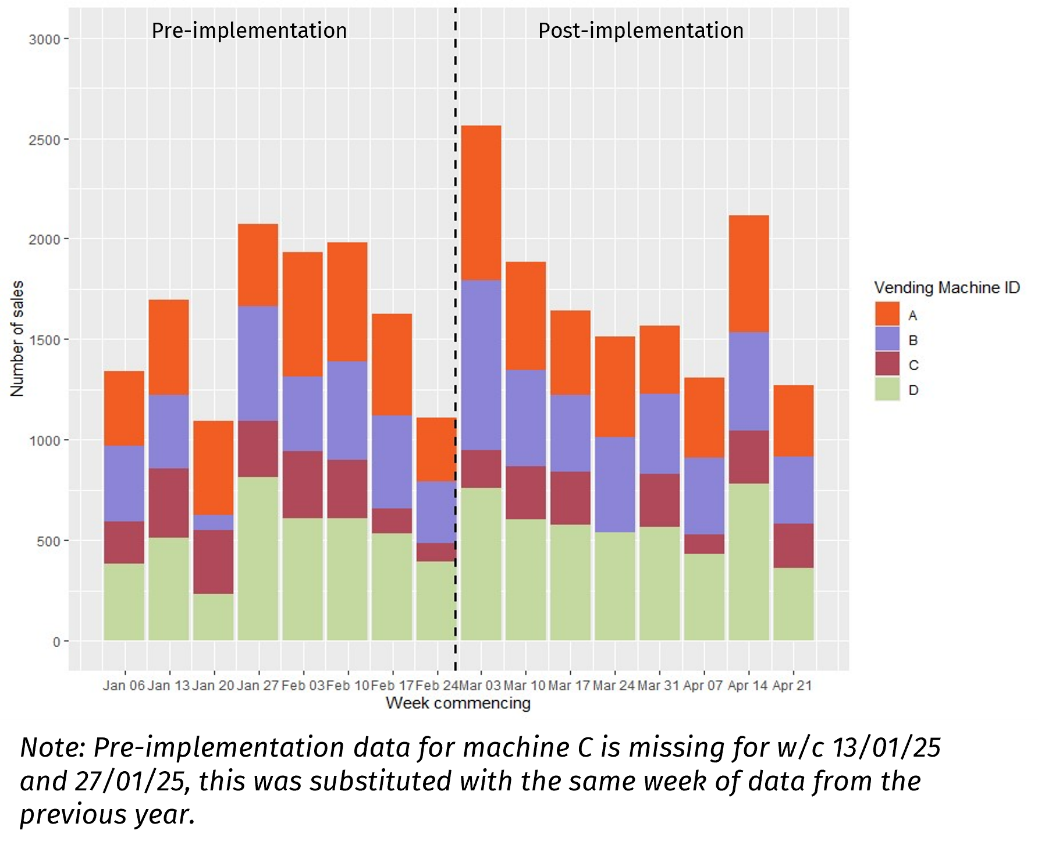
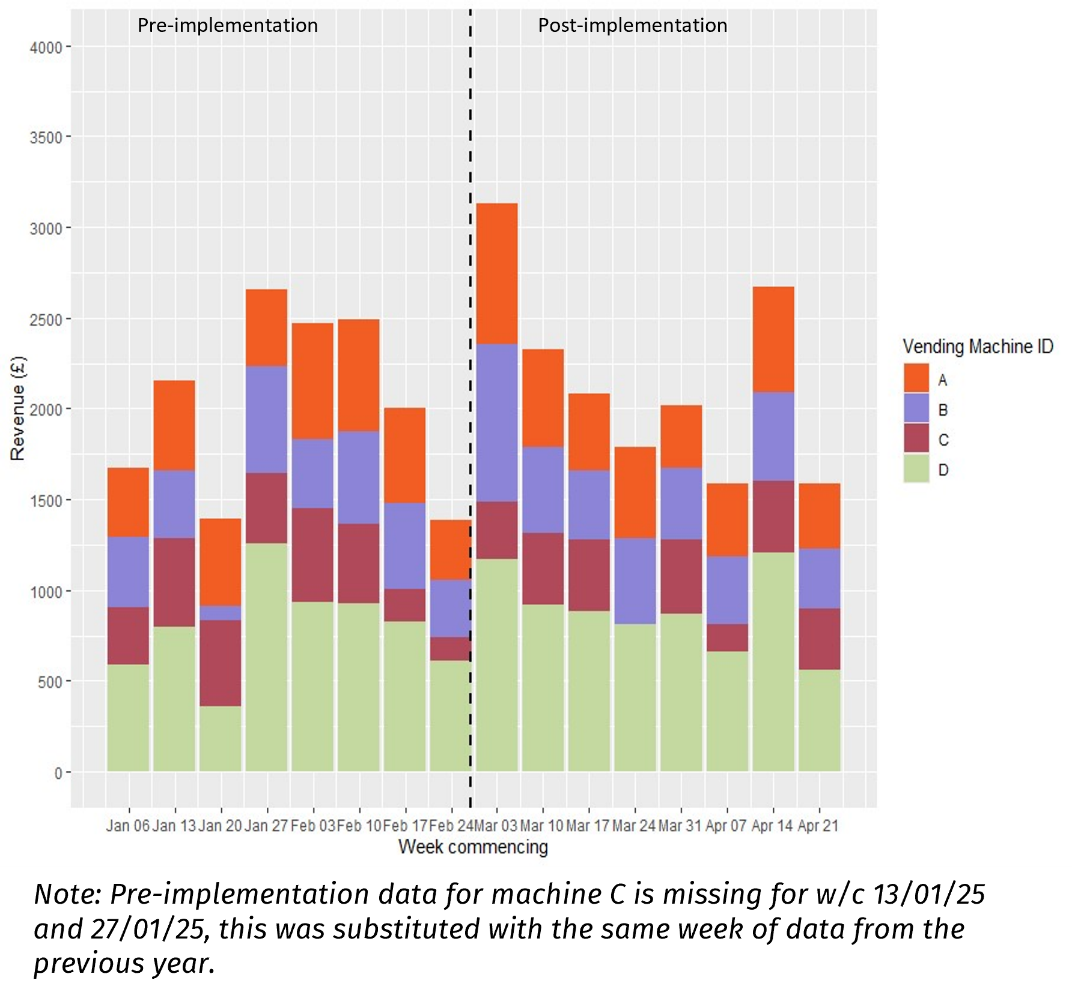
Two weeks of sales data (weeks commencing 13th and 27th January 2025) were missing for Machine C at this pilot site. These were supplemented with data from the same weeks in 2024 to ensure complete 8-week coverage. While this maintains dataset completeness, it reduces pre-implementation accuracy for that machine.
Small sample size
One key limitation is the relatively small sample of sites implementing nutritional standards for vending and willing to provide data. This introduces difficulty in generalising results to the broader population.
Results
This section presents the compliance checks results, sales and nutrition data statistical analysis, and findings from consumer surveys and stakeholder interviews.
Implementation and compliance checks
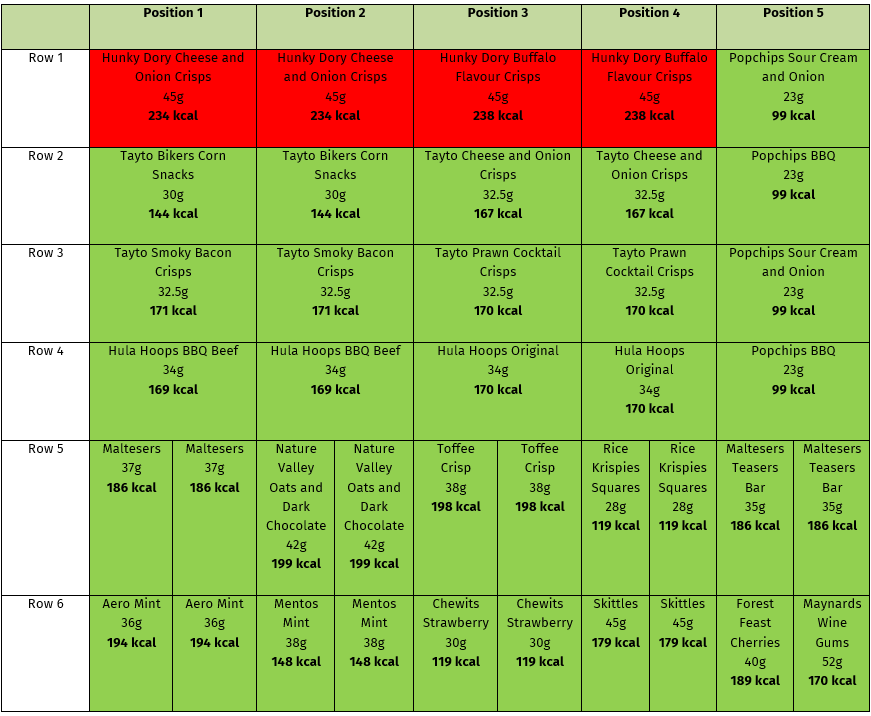
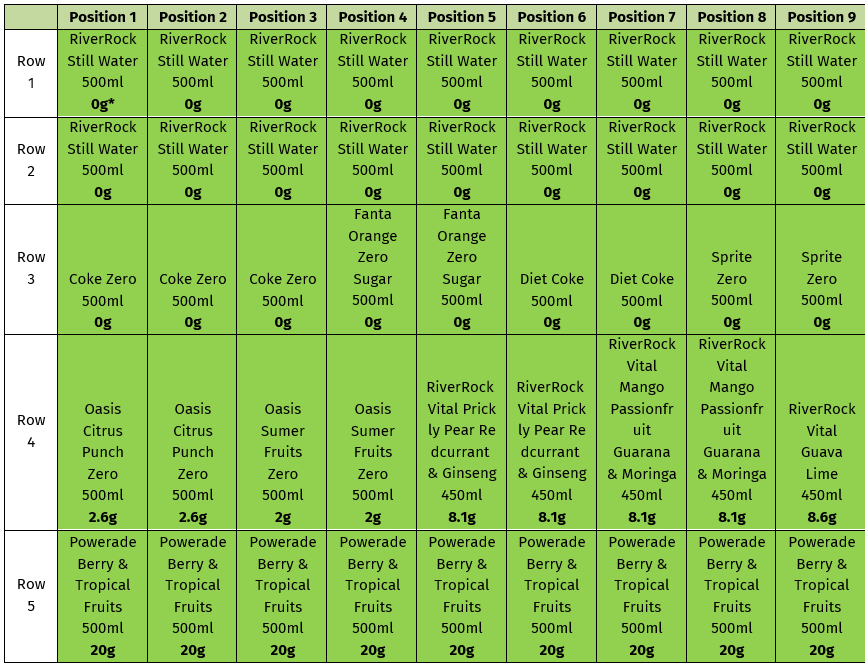
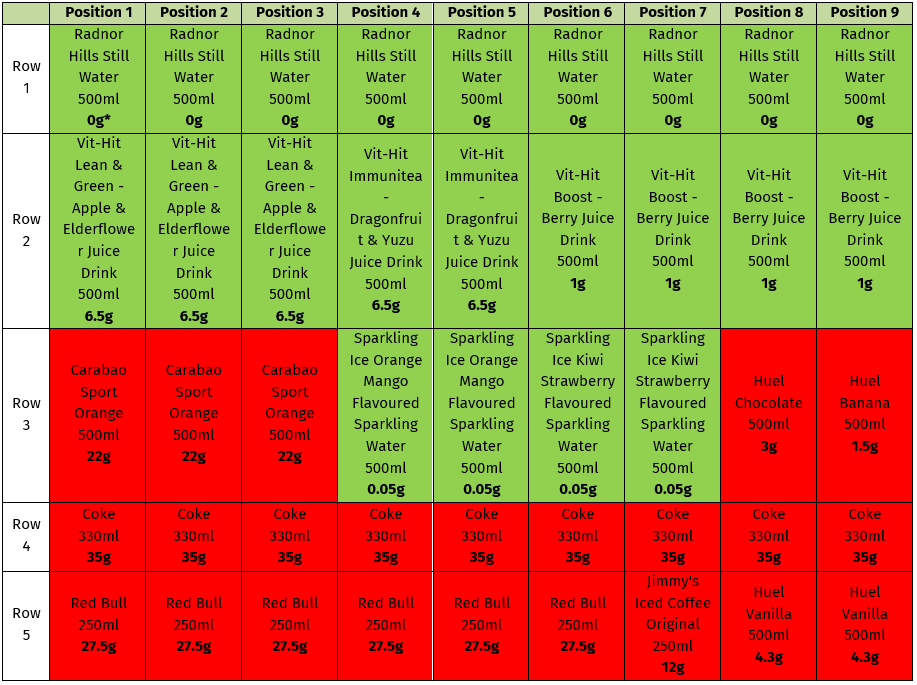
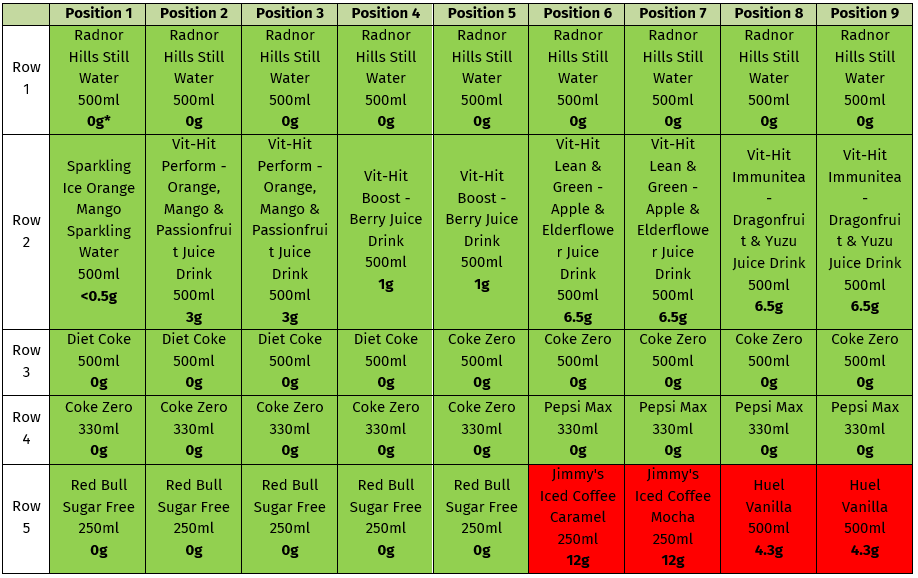
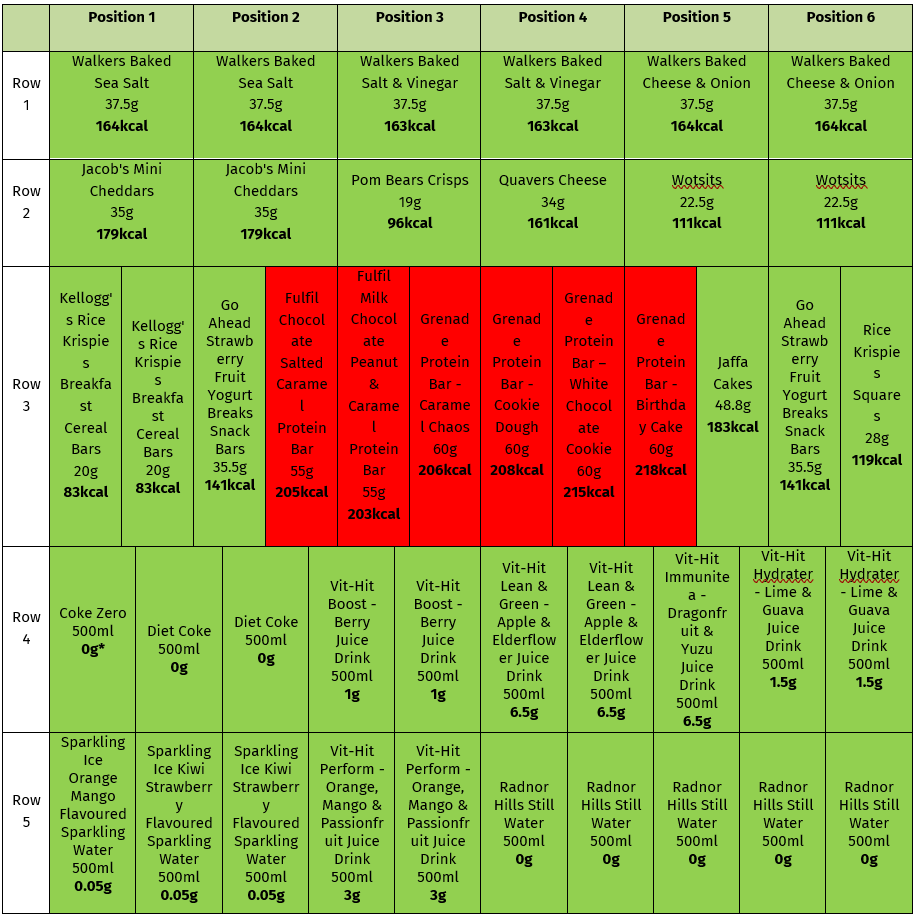
This section summarises how the different sets of standards were implemented across the sites. Figure 1 - Figure 4 show planograms for PS1, Figure 5 - Figure 8 show planograms for PS2, and Figure 9 and Figure 10 show planograms for PS3. Products highlighted in green meet nutritional standards and those in red do not. See Table 1 in the introduction for details on the criteria for FSA and HSC nutritional standards.
PS1 compliance with FSA nutritional standards for vending
Snacks
Pre-implementation, vending machines were stocked with many high-calorie chocolate bars and large packets of sweets, and some higher calorie packets of crisps which exceeded 200 kcal per serving (See Figure 1). Post-implementation, most non-compliant products were replaced with lower-calorie alternatives, which included other brands of chocolate bars and crisps, smaller pack sizes and some cereal bars. Only four products exceeded 200 kcal post-implementation, all of which were crisps (See Figure 2). PS1 was nearly compliant with the nutritional standards for ambient snacks as 90% of snack slots within the vending machines were stocked with products less than or equal to 200 kcal per product (increase from 37.5% pre-implementation).
Drinks
Pre-implementation, 13% of slots in the vending machines were stocked with sugar sweetened beverages (SSB) (See Figure 3). Post-implementation all SSB were removed, the percentage of drink slots stocked with low sugar drinks increased from 47% to 60%, and 40% of drink slots in the vending machine were stocked with water (See Figure 4). The main change made post-implementation was the substitution of SSB, such as Coke and Fanta, with zero-sugar options and an increase in low-sugar sports drinks such as Powerade. PS1 was fully compliant (100%) with the nutritional standards for drinks.
.png)
.png)
.png)
.png)
PS2 compliance with HSC Standards
Snacks
Pre-implementation, vending machines were generally stocked with large packets of sweets and chocolate bars exceeding 250 kcal, with some ~500 kcal per serving size. One chocolate bar offered was under 200kcal. Of all savoury snacks offered, 75% already complied with the nutritional standards (See Figure 5).
Post-implementation, significant changes were made to the existing snacks. Chocolate bars and sweets were replaced with protein bars, some lower-calorie cereal bars and yogurt bars. Although no savoury snacks exceeded 200 kcal per packet (see Figure 6), all 30 protein bars ranged from 203–218 kcal, exceeding the 200 kcal threshold and failing to meet the HSC standards. Notably, no alternative chocolate or sweet products were offered that complied with the standards, and the one previously compliant chocolate bar was removed. Despite changing the product offering, the proportion of chocolate and biscuit snacks exceeding 200 kcal decreased by only 3 percentage points post implementation (See Figure 6). In terms of savoury snacks, some already compliant products were removed and replaced with products with similar or lower total calories (See Figure 6). Overall, PS2 was only partially compliant (33%) with HSC standards for snacks post-implementation.
Drinks
Before implementation, vending machines at PS2 were stocked with SSB and energy drinks (See Figure 7).
Following implementation, high-calorie drinks, such as Coke and Red Bull, were replaced with sugar-free alternatives. Of all drinks offered, this led to a reduction in SSBs from 44% to 9% and an increase in low-calorie drinks from 36% to 71%. However, water made up only 20% of drink offerings, falling short of required 30% (See Figure 8). PS2 achieved partial compliance (91%) with HSC nutritional standards for drinks.
.png)
.png)
.png)
.png)
PS3 compliance with HSC Standards
Snacks
Prior to implementation, vending machines at PS3 were stocked with crisps and chocolate bars exceeding 200 kcal (See Figure 9). Following implementation, these were replaced with protein bars, cereal bars, yogurt bars and lower-calorie crisps. However, all six protein bars ranged from 203–218 kcal, exceeding the 200-kcal threshold (See Figure 10). Similar to PS2, no alternative chocolate products were offered that complied with the standards. PS3 was partially compliant (83%) with HSC standards for snacks.
Drinks
Prior to implementation, vending machines at PS3 were stocked with SSB, such as Coke and Fanta (see Figure 9). Post-implementation, the proportion of low-calorie drinks increased significantly from 25% to 75%, and all drinks with added sugar were eliminated. Although all the drinks at PS3 met the HSC standards, the water offerings remained at 25%, below the required 30% threshold (see Figure 10).
.png)
.png)
Statistical results
A combination of descriptive, paired, mixed-effects, and interrupted time series (ITS) analyses was used to provide a comprehensive assessment of both immediate and sustained impacts of the intervention, accounting for time trends and differences between machines and product types. Results are presented for sales and nutrition by pilot site, with paired, mixed-effects, and ITS analyses reported only for PS1 due to insufficient sample sizes at PS2 and PS3.
PS1 findings
-
Pre-implementation sales trends: weekly unit sales and revenue varied considerably, with peaks in beginning-mid February and a decline towards the end of the period (See Figure 11 and Figure 12).
-
Post-implementation sales trends: sales and revenue peaked at over 2,500 sales and over £3,000 during the first week of post-implementation respectively; sales and revenue were higher, on average, over the 8 week post implementation period compared to pre implementation (See Figure 11 and Figure 12).

-
Paired analysis showed there was no statistically significant change in weekly sales quantity or revenue post-implementation.
-
Mixed model analysis indicated that implementation was associated with a non-significant average weekly revenue increase of £38.42 and an increase of 7% in items sold per week.
-
ITS: Post-implementation, there was a statistically significant immediate increase in revenue of £865 (p = 0.021) and items sold by 51% (p = 0.023), but this was not sustained over time.
-
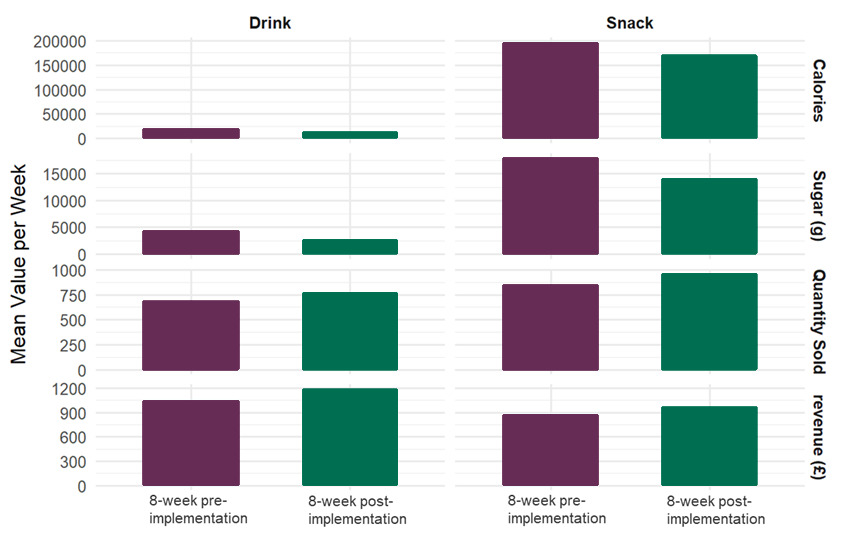
Overall nutritional impact: both total calories and total sugar sold decreased following implementation of the nutritional standards, with the quantity of calories sold declining more significantly than sugar sold. Notably, total sugar sold via drink sales decreased by almost 50% (See Table 3).
- Average nutritional content: average calories and sugars per unit sold both decreased by ~26% and ~35% respectively regardless of the comparison period (see Table 4), showing a positive impact of the implementation on nutritional profile of products.
-
Paired analysis showed significant reductions in calories (p = 0.048) and sugar per unit sold (p = 0.008) when compared to the 12-month pre-implementation period.
-
Mixed models analysis found a significant reduction of 34.9 calories (p < 0.001) and around 5 grams of sugar per unit sold (p < 0.001).
-
ITS analysis also found a significant reduction in sugar content per unit sold (p = 0.012), which continued to significantly decline (p = 0.023).
-
Product category analysis showed the nutritional impact was greater in snacks than drinks (See Figure 13).
Overall, there was no statistically significant effect of the implementation of nutritional standards on revenue or total sales volume, which remained similar to pre-implementation levels. There is also clear, strong evidence that the implementation improved the nutritional quality of items sold, reducing both calories and sugar per unit across all vending machines at PS1. These results indicate that product availability post-implementation effectively shifted consumers towards healthier options while maintaining sales revenue.
PS2 findings
-
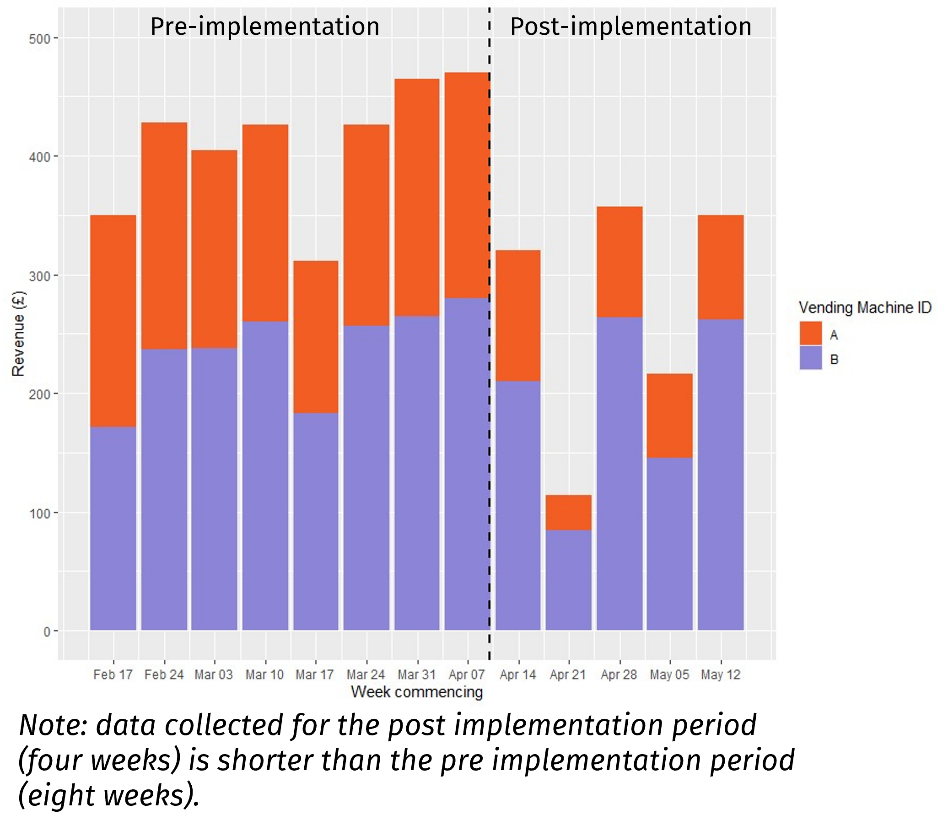
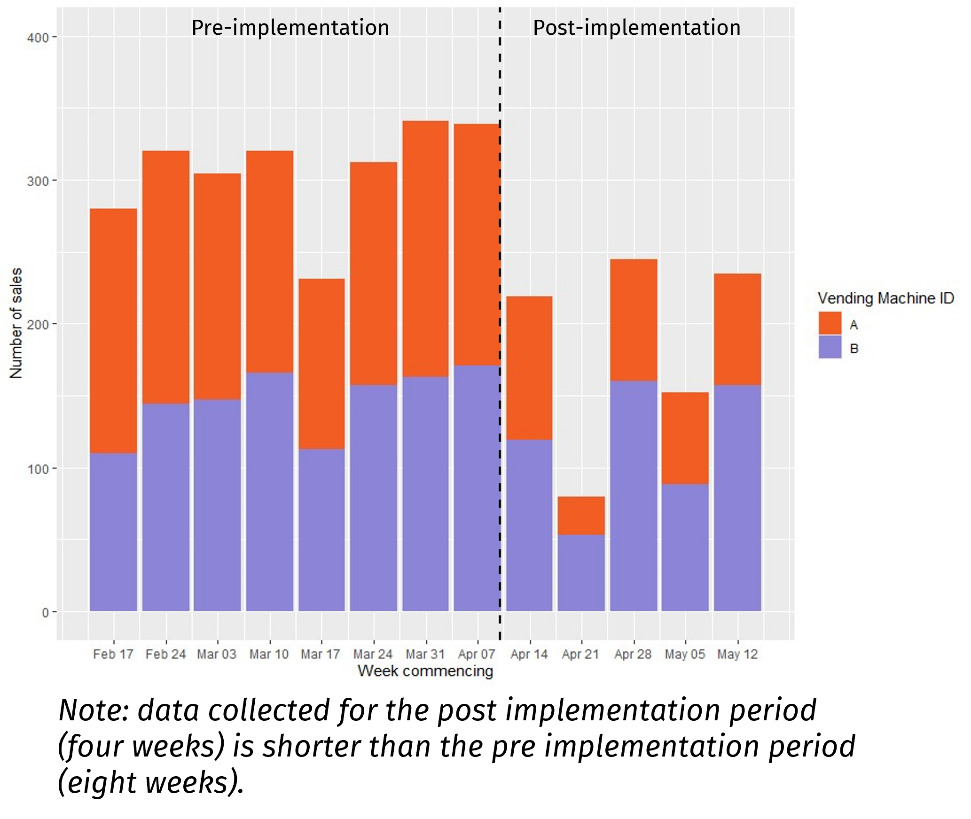
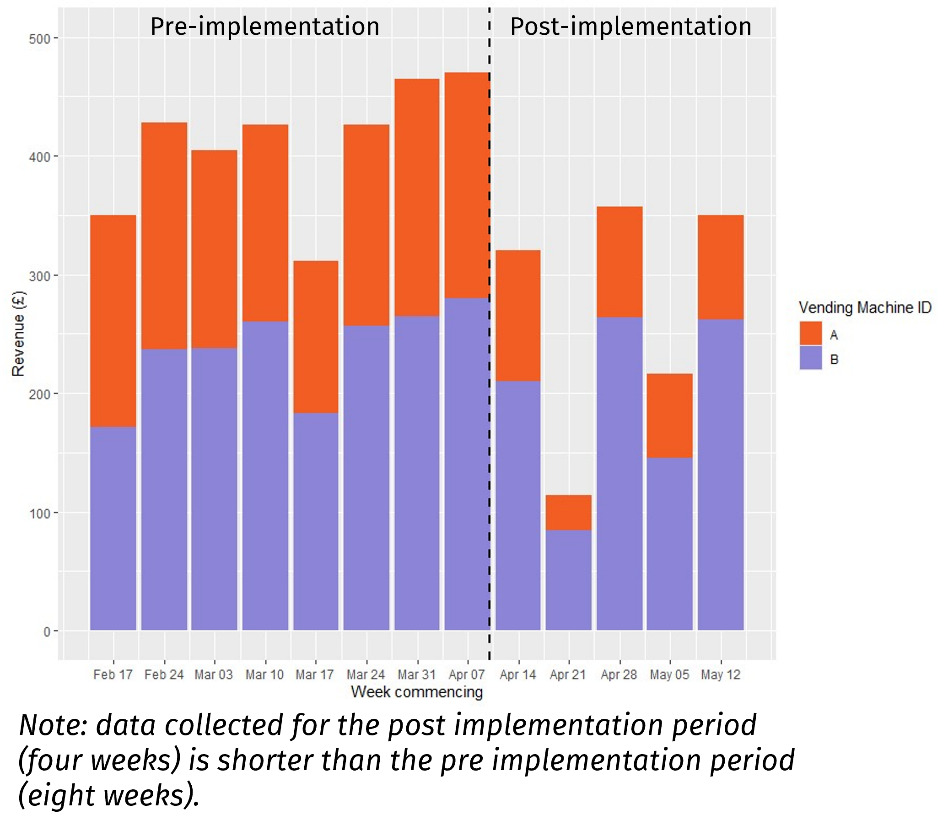
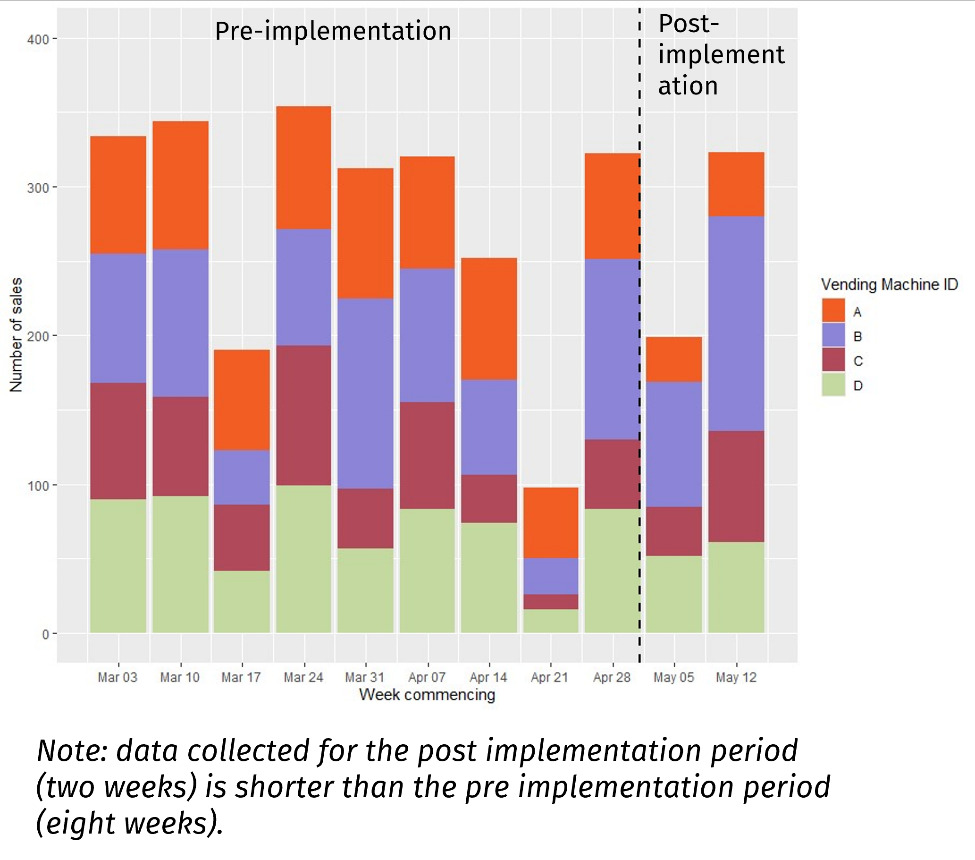
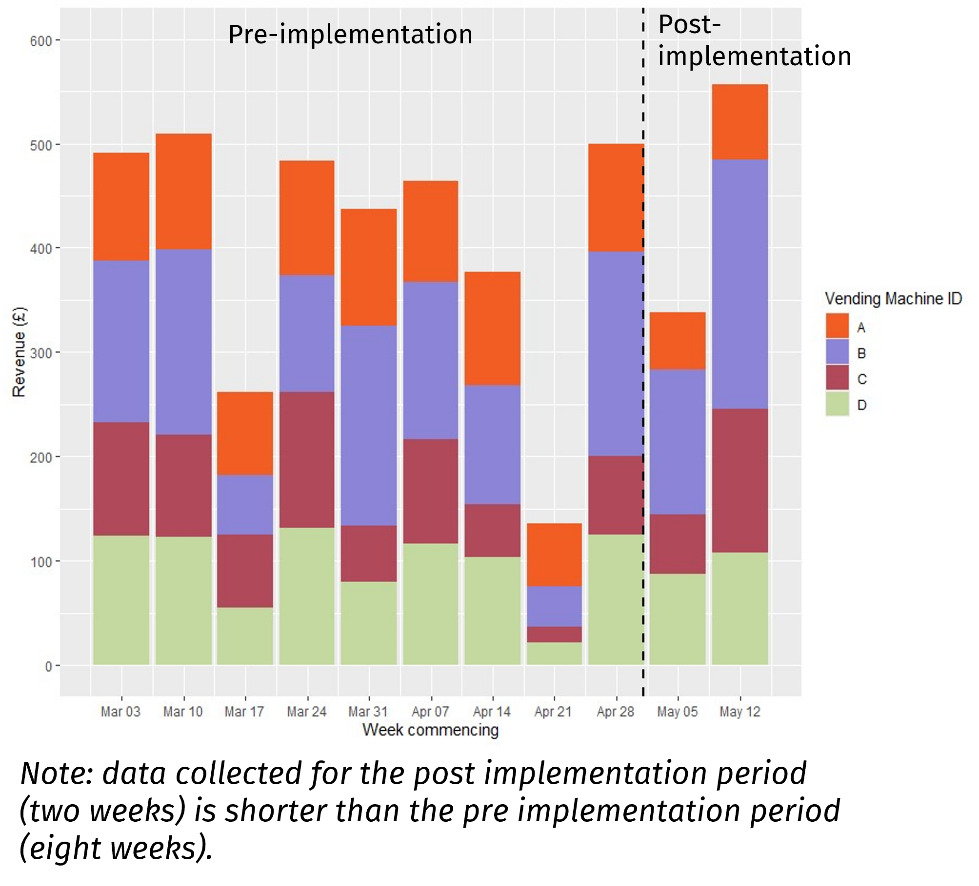
Pre-implementation sales trends: Vending Machines A and B maintained relatively stable weekly sales, ranging from 200 to 350 units, with revenue between £300 and £500 (See Figure 14 and Figure 15). Vending Machine A consistently accounted for about two-thirds of total weekly sales. Lower sales were observed during the week commencing March 17th, potentially due to a public holiday in Northern Ireland on March 17th.
-
Post-implementation sales trends: there was a noticeable decline in sales and revenue, mainly driven by Vending Machine A which contained snacks. Sales for drinks were more stable in comparison. The highest post-implementation sales occurred during the week of April 28th (approximately 250 units and £300), while the lowest was during Easter week (April 21st), with around 75 units and £100 in revenue (See Figure 14 and Figure 15). The post-implementation figures reflect a significant reduction in vending machine activity compared to the pre-implementation period.
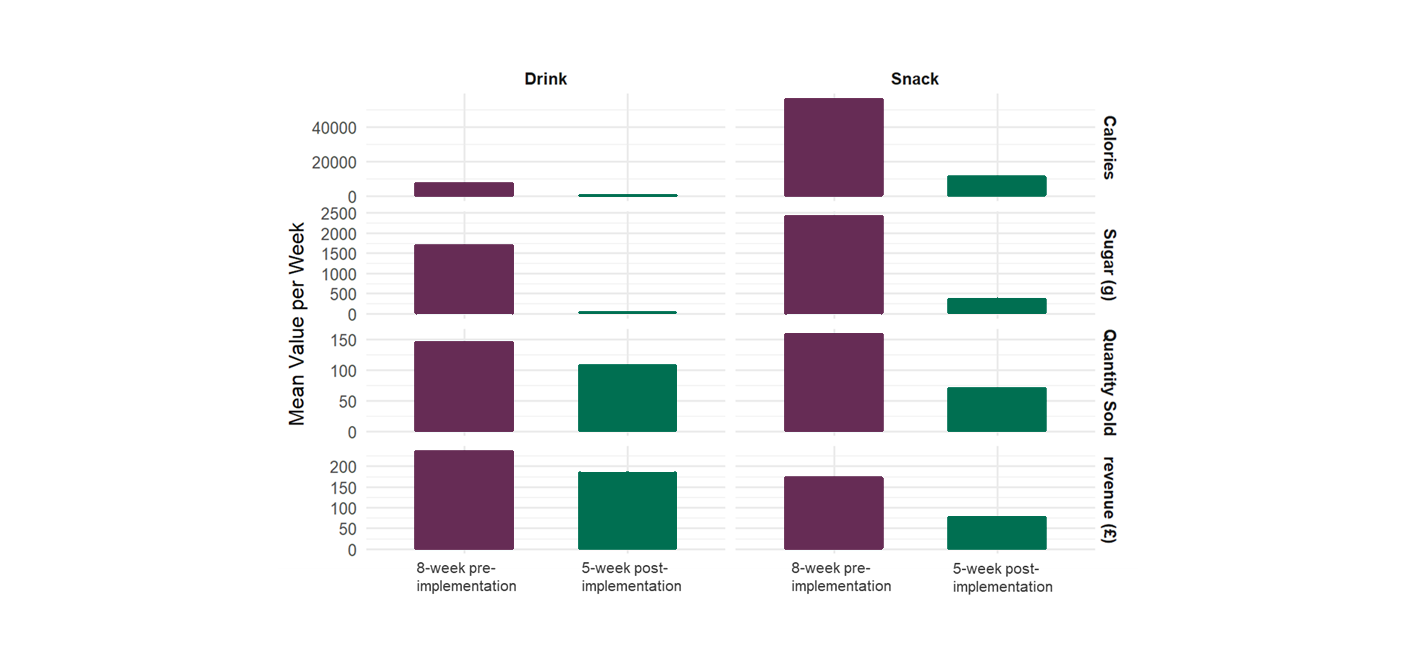
- Average nutritional content: there was a significant reduction across both average values per week and per unit sold post-implementation. Average calories and sugars per unit sold both decreased by ~68% and ~82% respectively (See Table 5), with a more significant decrease in drinks than snacks.
- Product category analysis showed a large decrease in sugar and calories for both drinks and snacks, with drink sales remaining closer to pre-implementation levels (see Figure 16).
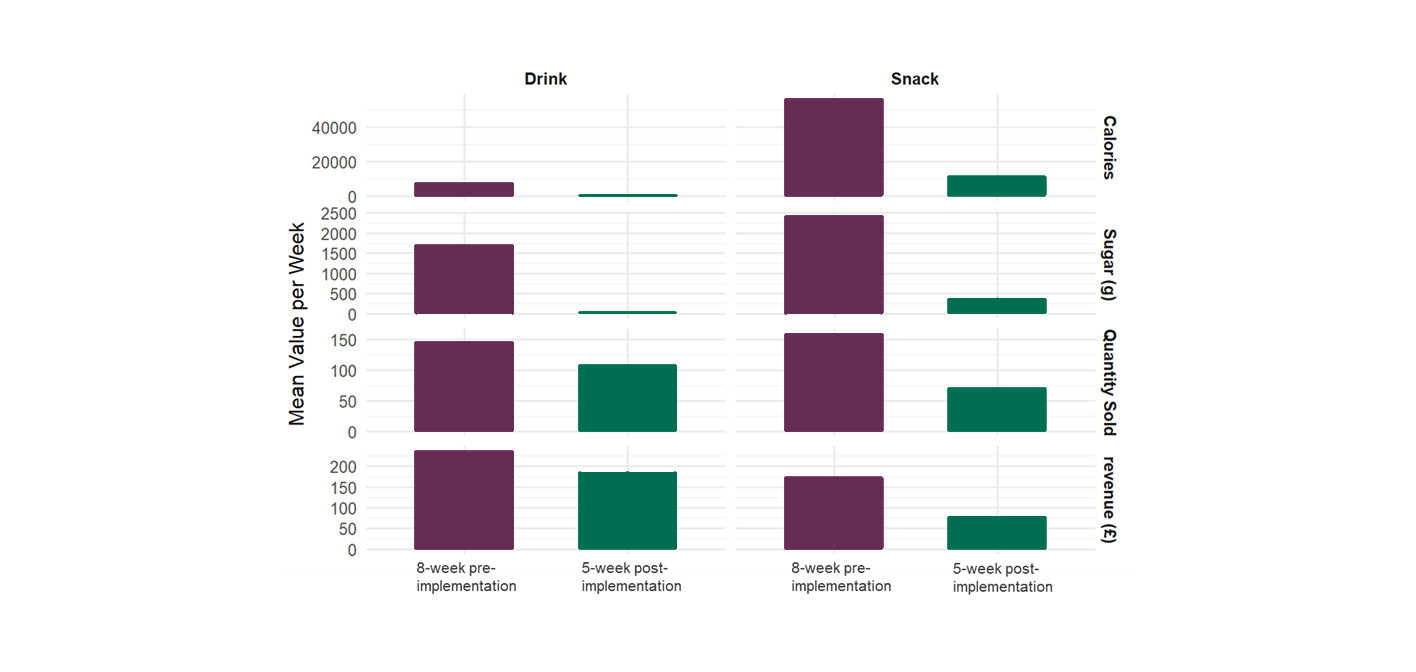
As PS2 was only 33% compliant for snacks in the post-implementation period, although reductions in calories and sugars were observed, it is difficult to draw conclusions about the impact of the nutritional standards themselves on the nutritional quality of snacks sold. The analysis also shows a decrease in sales and revenue post-implementation, suggesting that the products chosen did not align with consumer preferences at PS2. For drinks, compliance was 91%, sales remained comparatively stable, and there was a clear positive impact in reducing both the number of calories and the amount of sugar sold.
PS3 findings
-
Pre-implementation sales trends: weekly sales across four vending machines fluctuated considerably between approximately 100 to over 300 sales (See Figure 17) and revenue varied more widely, ranging from £100 to £500 (See Figure 18). Peaks occurred in March, notably during the weeks commencing March 10th and March 24th. A sharp decline was observed in mid-April, with the lowest sales and revenue during the week of April 21st, likely due to the Easter holiday.
-
Post-implementation sales trends: the post-implementation period was only two weeks; there was an increase of around 100 units sold and £200 in revenue between the weeks commencing May 5th and May 12th , likely due to the bank holiday on May 5th (See Figure 17 and Figure 18). Post-implementation sales quantities were slightly lower than pre-implementation levels.
-
Statistical results for PS3 sales were excluded for reporting due to small sample size.
-
Since PS3 did not obtain 8 weeks of post-implementation data, total calories and sugars sold are not tabulated due to non-comparable periods; instead, average values are discussed below.
-
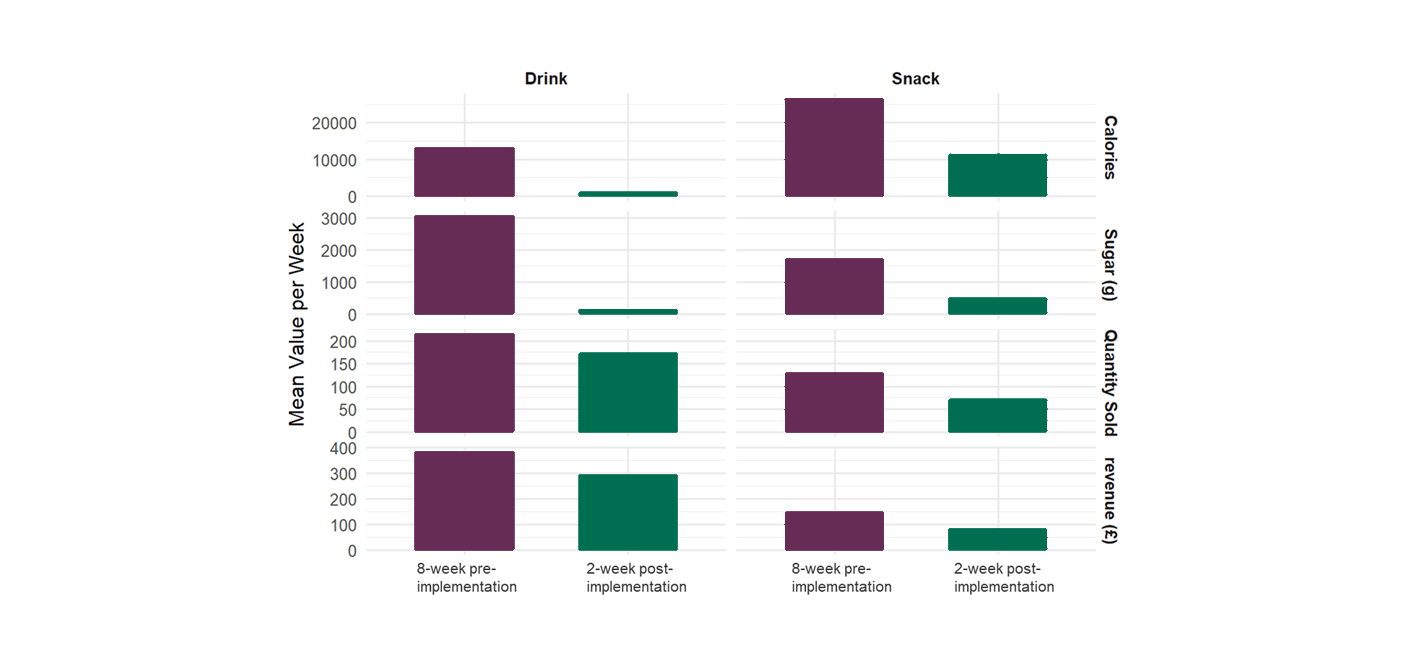
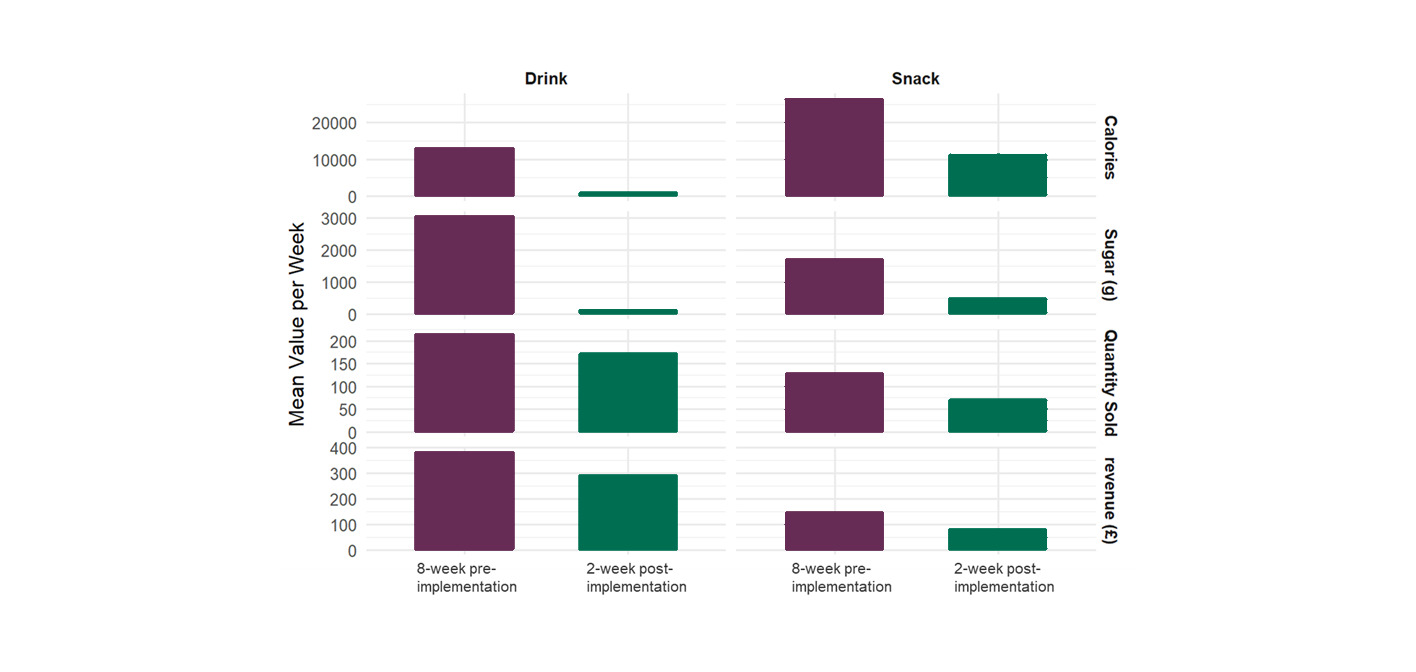
Average nutritional content: average calories and sugars per unit sold decreased by approximately 56% and 81% compared to the 8-week pre-implementation period (See Table 6), indicating a substantial shift in the nutritional profile of products.
-
Product category analysis showed that snacks saw a greater reduction in calories than drinks while drinks showed a more substantial decrease in sugar content compared to snacks, close to zero, following implementation (see Figure 19).
-
Statistical results for PS3 nutritional data were excluded for reporting due to small sample size.
Overall, the analysis shows that there was a reduction in both calories and sugar per unit across all vending machines, even though there was not full compliance with the nutritional standards. Although drink sales were less impacted by the changes in comparison to snacks, the overall impact on sales or revenue is inconclusive due to small sample size of the post-implementation data. Results for paired, mixed effects and ITS analysis were not included for PS3 due to the lack of sufficient sample for robust analysis.
Consumer surveys
The following section presents the findings from the pre- and post-implementation surveys, which collected consumer insights on purchasing snacks and drinks from vending machines before and after implementation of the nutritional standards at pilot sites. Table 7 below summarises the demographic characteristics of survey participants.
Vending machine purchases
In the post-implementation survey, the majority of respondents reported that they hadn’t noticed any changes in the vending machine items on offer. Chocolate, soft drinks, and savoury snacks were the most popular items purchased from vending machines across all pilot sites, both pre- and post-implementation. There was higher self-reported uptake of fruit/vegetable juice and smoothie’s post-implementation compared to pre-implementation.
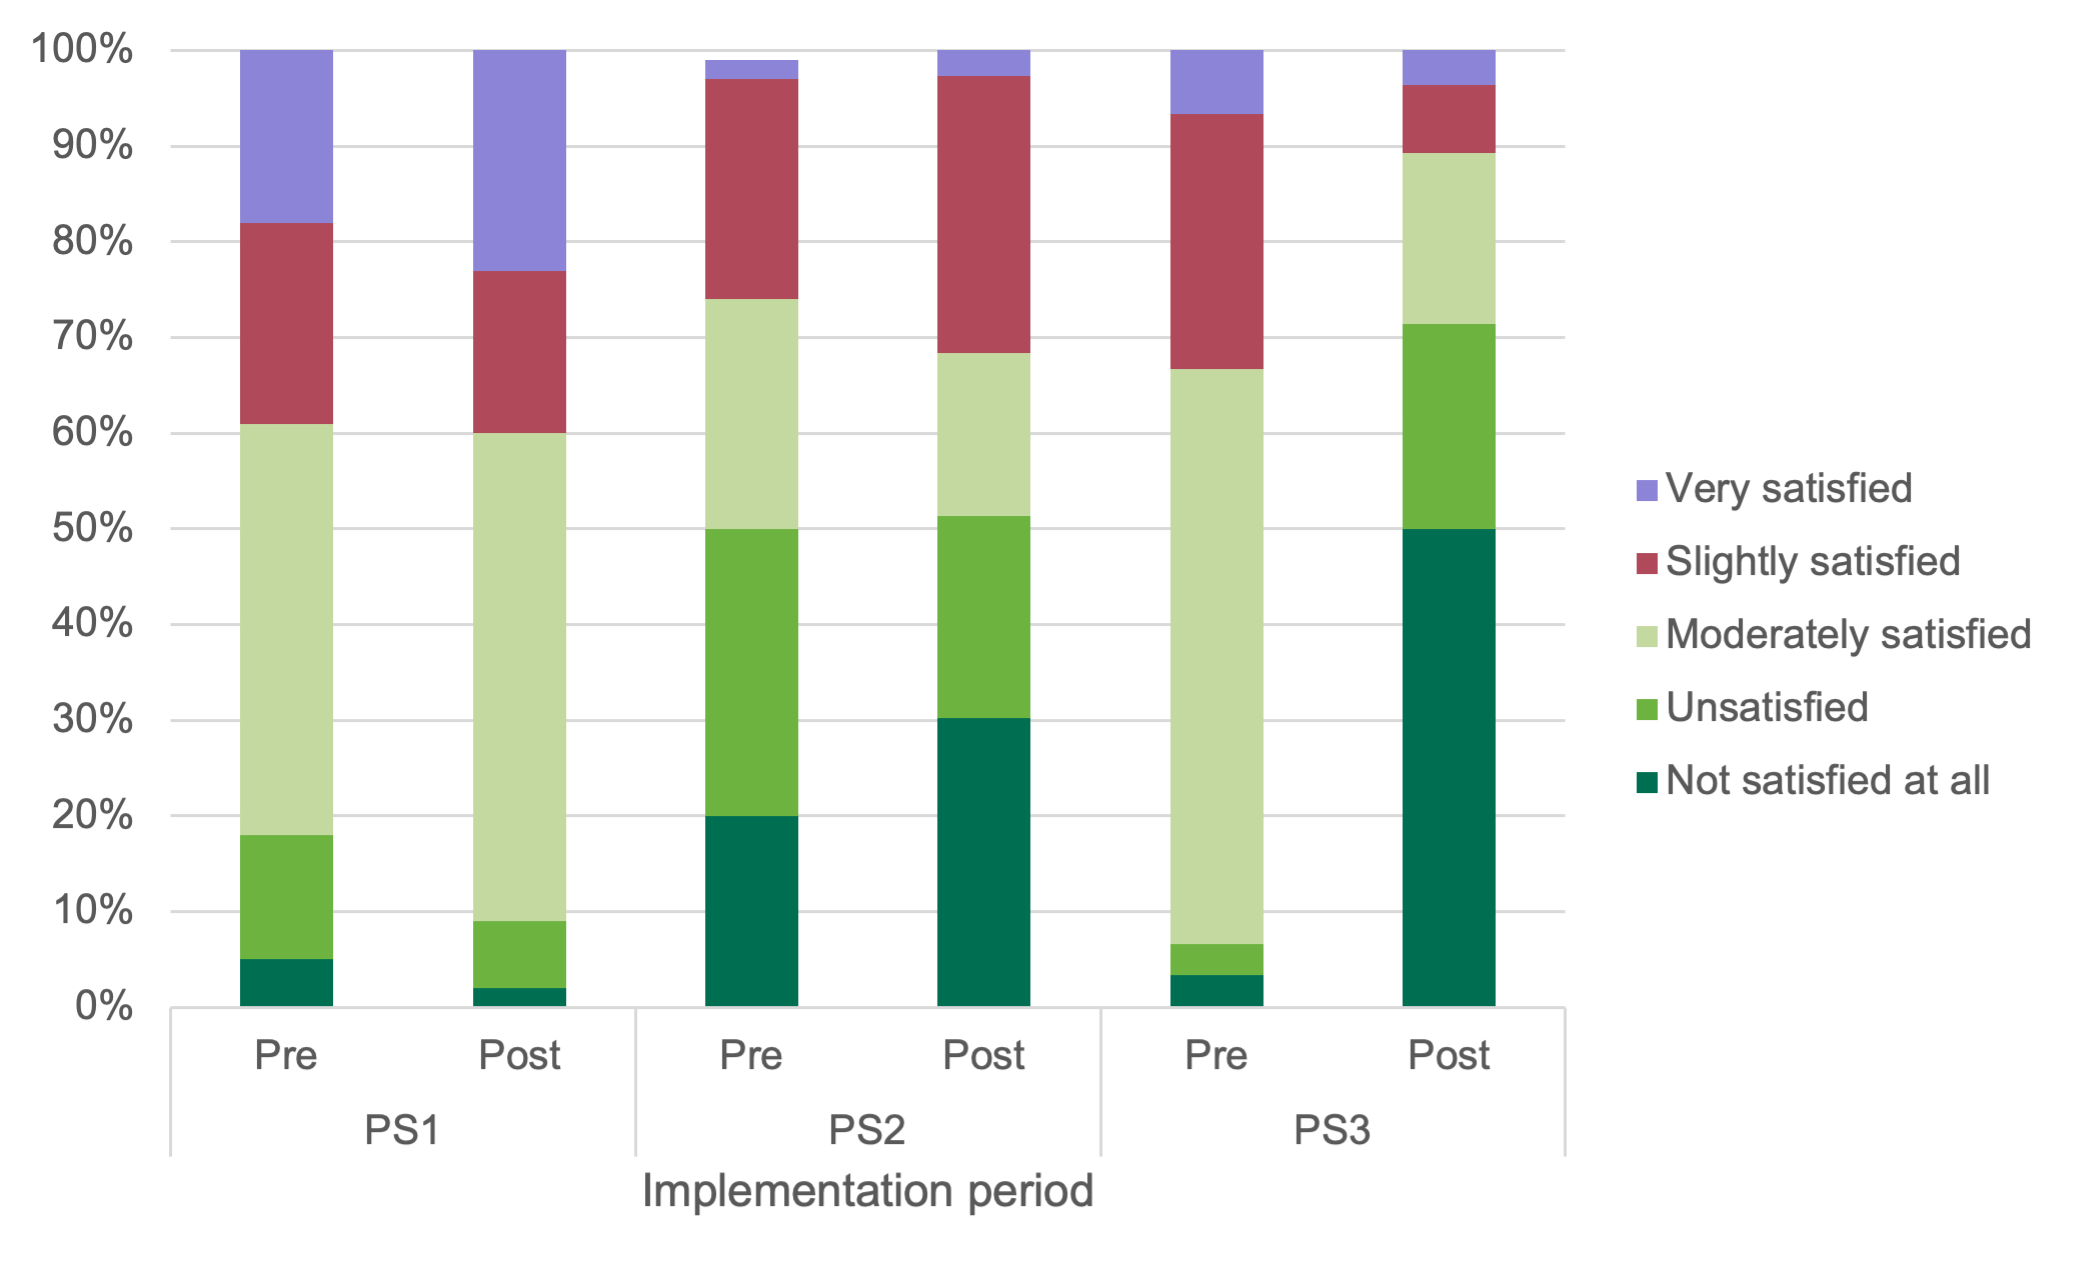
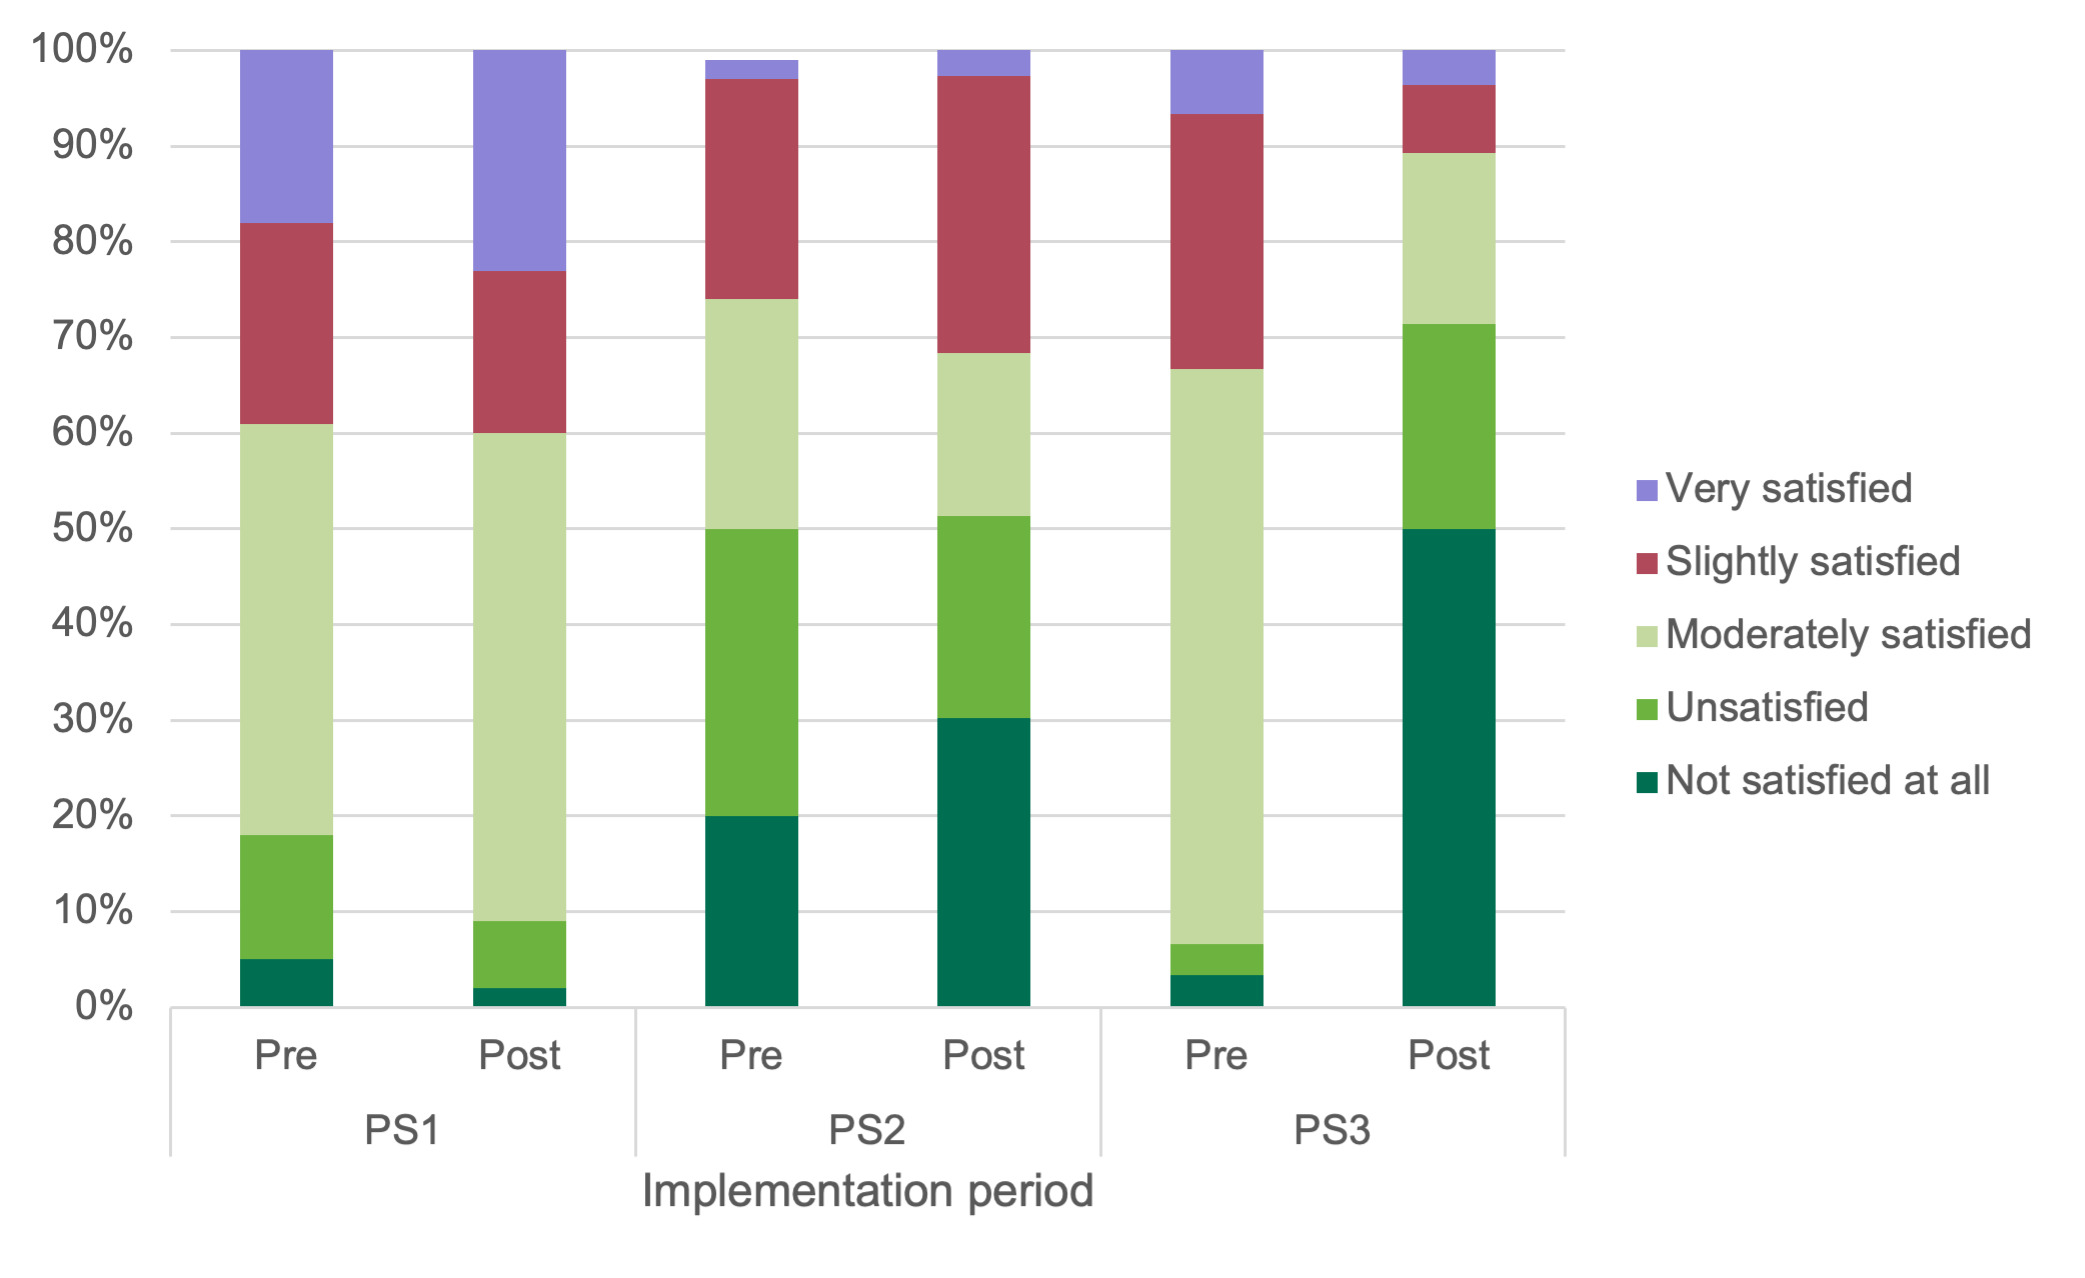
PS1 findings: PS1 had the highest percentage of consumers that reported being very satisfied (25%) post-implementation, increasing by 7 percentage points from pre-implementation. The majority of PS1 consumers (51%) were moderately satisfied post-implementation, increasing by 8 percentage points from pre-implementation, as shown in Figure 20.
PS2 findings: 30% of respondents at PS2 were not satisfied at all post-implementation, an increase of 10 percentage points compared to pre-implementation, and a further 21% were unsatisfied. Only 3% of respondents were very satisfied post-implementation.
PS3 findings: PS3 had the highest percentage of dissatisfied consumers post-implementation, with 50% of respondents stating that they were not satisfied at all with the current availability of products in the vending machine – a 47-percentage point increase from pre-implementation. This is the greatest change seen across sites between pre- and post-implementation, with a similar 42 percentage point decrease in moderately satisfied PS3 consumers. Only 4% of respondents were very satisfied post-implementation.
Findings by type of respondent: Crosstab analysis reveals an increase in satisfaction amongst visitors post-implementation and an increase in dissatisfaction amongst members of staff across pilot sites. The number of staff who were not satisfied at all increased by 19 percentage points post-implementation, while the number of visitors not satisfied at all fell by 6 percentage points.
Accessibility and awareness of nutritional standards
There were generally low levels of awareness of the nutritional standards at both pre- and post-implementation. During the pre-implementation period, a significant majority of respondents (85%) were unaware of any new nutritional standards for vending machines. At post-implementation, 73% of respondents were unaware of both sets of nutritional standards. There was slightly higher awareness of the HSC nutritional standards than the standards within the FSA’s Healthier and more sustainable vending guidance.
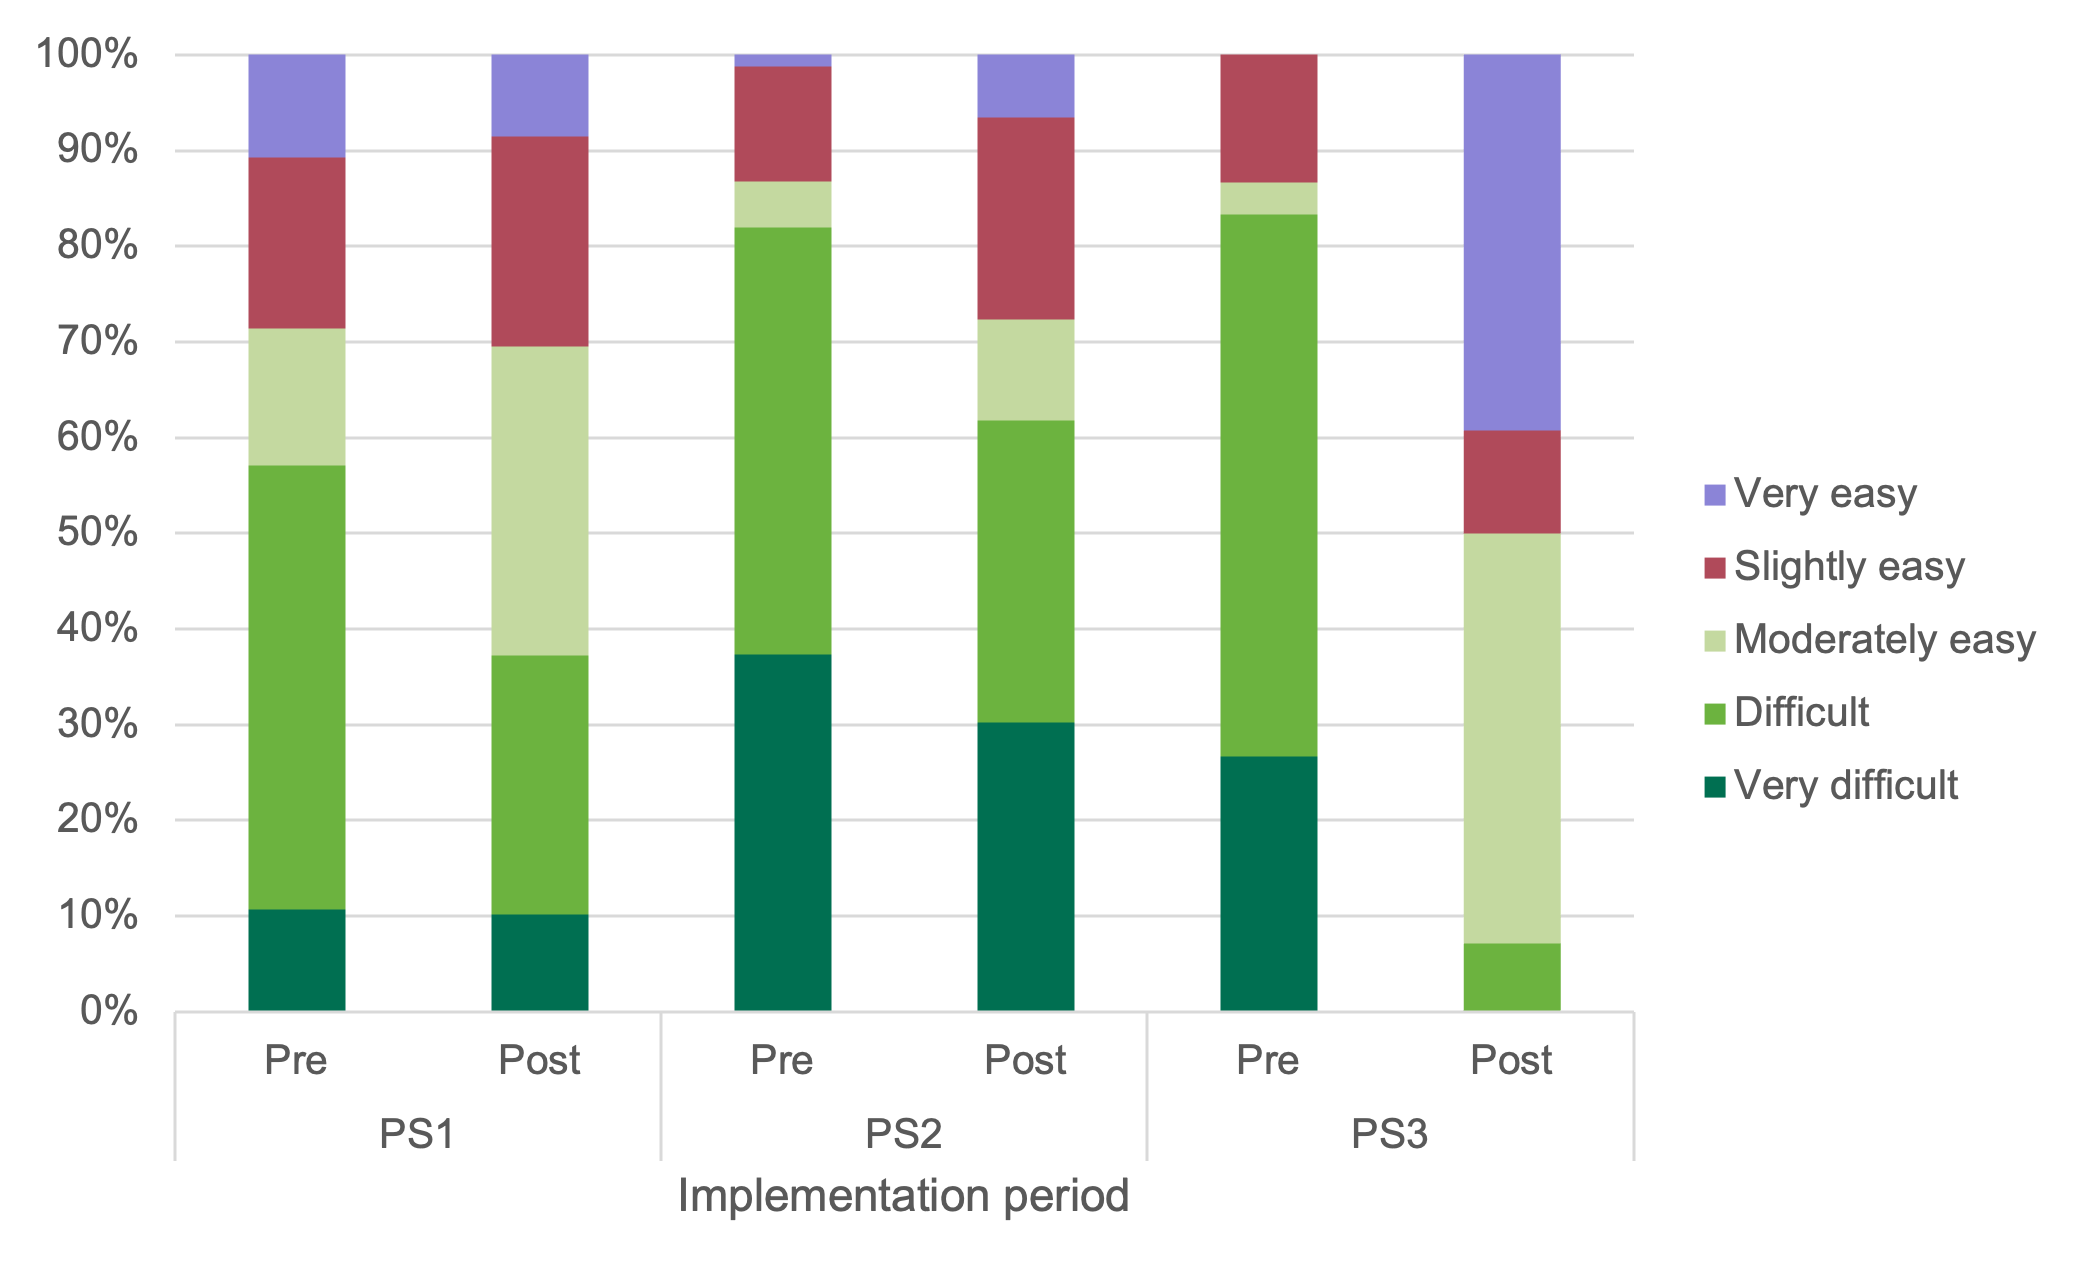
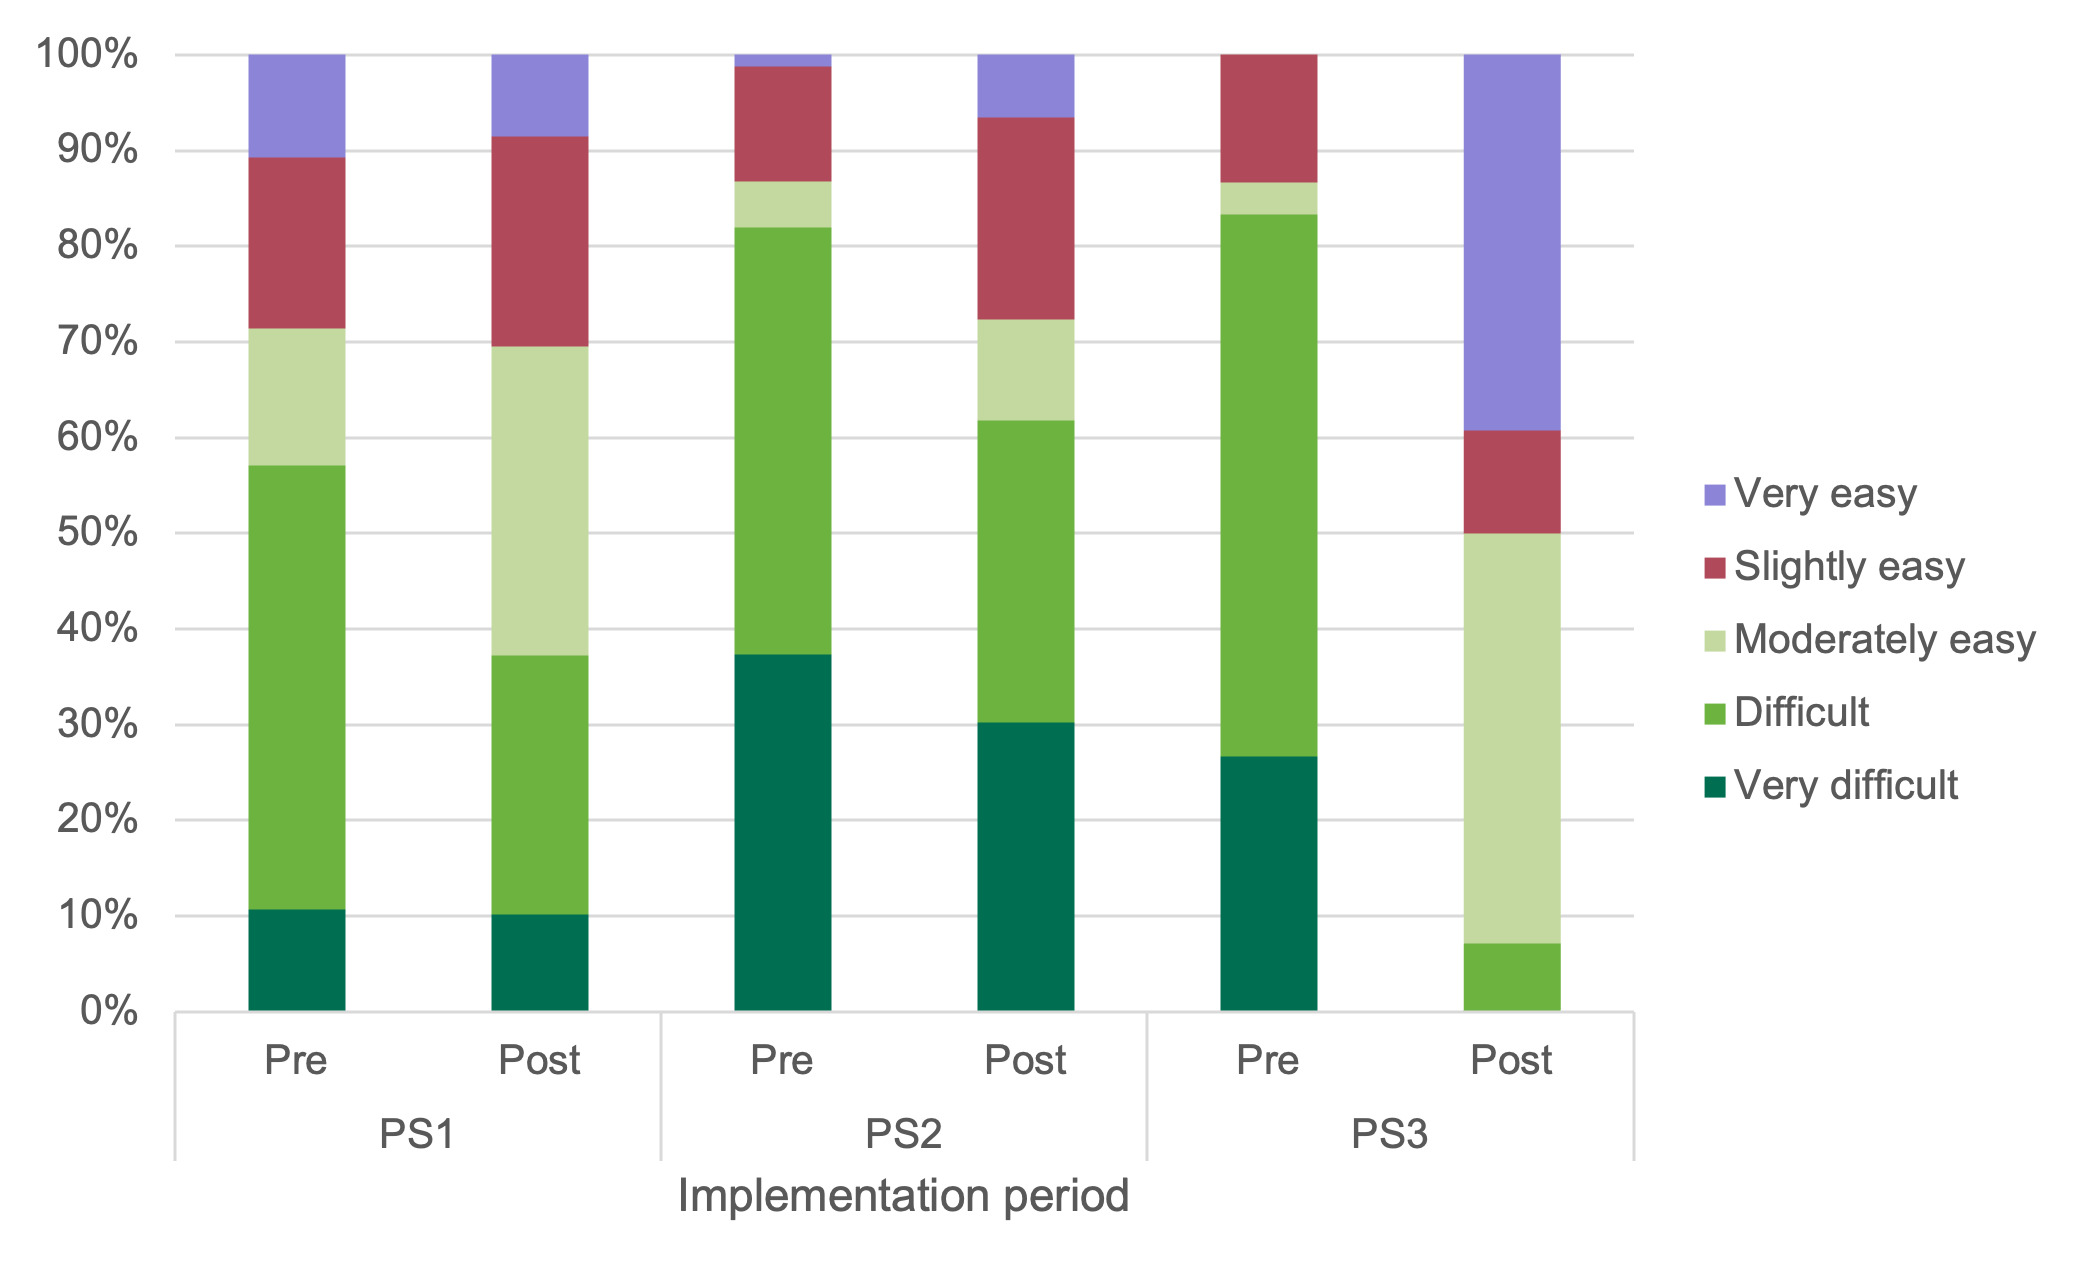
PS1 findings: As shown in Figure 21, 62% of respondents at PS1 found accessing healthier snacks at least moderately easy post-implementation, an increase of 19 percentage points compared to pre-implementation. Conversely, only 10% found it very difficult.
PS2 findings: Vending machine users at PS2 reported having the most difficulty accessing healthier snacks from the vending machines at this site across both periods. 82% of respondents at this site found it difficult or very difficult to access healthier snacks pre-implementation, with this figure reducing to 62% post-implementation.
PS3 findings: Only 7% of respondents at PS3 found it difficult to access healthier snacks from vending machines post-implementation. There was the greatest impact on perceived access to healthier snacks pre- and post-implementation at PS3; with an increase of 39 percentage points in consumers finding it very easy and a decrease of 50 percentage points in consumers finding it difficult.
Findings by type of respondent: There was a perceived increase in access to healthier snacks across all pilot sites, amongst both staff and visitors, with a slightly more positive impact on visitors. There was a decrease in the number of visitors and staff finding access to healthier snacks difficult by 22 and 23 percentage points respectively.
Interview and focus groups findings
Interviews with implementing VMOs
The implementation of nutritional standards varied between pilot sites, influenced by each operator’s approach (see planograms in the Implementation and compliance checks section to visualise how the different sets of standards were implemented across the sites).
Implementation of the standards
-
VMO A introduced the changes at the agreed launch date, maintaining them for the planned eight weeks and did not observe any noticeable change in sales.
-
VMO A mainly experienced operational impacts, including stock changes and logistics adjustments, such as brand swaps and portion size reductions.
-
VMO B faced delays due to staffing changes, leading to partial implementation: five weeks at PS2, two weeks at PS3. Their process involved updating machine planograms, engaging with site contacts, removing non-compliant items, and replenishing machines with healthier alternatives.
-
VMO B reported decreased sales following partial implementation of the standards, particularly in confectionery items, attributing this decline partly to the higher pricing of some alternative products, such as protein bars. In contrast, cold drink sales remained relatively stable.
-
Restocking frequency remained, but stock volumes dropped for VMO B. Water sales rose at PS3 as sugary drinks were replaced. PS2 saw stable drink sales but lower demand for healthier snacks.
Implementation adaptation and challenges
-
VMO A found the 200-kcal limit manageable due to industry-wide portion size reductions and prior experience with similar standards. The process required coordination across logistics and dispatch teams, including updating the vending planograms and changing the product range carried by vehicles.
-
The product changes increased the number of stock-keeping units (SKUs) per machine, impacting VMO A’s logistics, requiring staff reallocation and delivery schedule changes and additional stock had to be carried. VMO A felt that this put extra weight on vehicles and increased fuel use, which impacted their emission levels.
-
VMO A noted that minor machine level changes could have more substantial overall impact if scaled across Northern Ireland, requiring more stock variation, increased handling, and greater fuel use to manage deliveries.
-
VMO B was new to implementing standards, previously choosing products based on preference rather than health benefits or guidance.
-
VMO B described initial confusion over the scope of implementation, whether one or all machines at a site should change, which stemmed from not involving the right personnel early enough. They felt that had they engaged senior staff from the beginning, the implementation process would have been smoother and more coordinated.
-
VMO B only achieved partial implementation of the nutritional standards. VMO B struggled to source compliant products due to limited supplier options and discontinued healthier items.
-
This process prompted VMO B to engage with new local suppliers and consider healthier products for other parts of the business. They viewed this shift as positive but noted that the higher costs of some products and limited availability challenge long-term sustainability.
-
VMO B staff highlighted a lack of communication with consumers and site staff about the upcoming changes at PS2 and PS3, leading to complaints about missing popular items. They felt better consultation could have reduced backlash.
Suggestions for future roll out
-
VMO A raised concerns about narrow product category definitions and lack of flexibility in labelling, recommending clearer, more consumer-friendly labelling and more flexible definitions (e.g. around water) to support better outcomes.
-
VMO B found drink categories workable but felt the 200-kcal limit for confectionery was too strict. They proposed raising it to 230 kcal to allow more popular products while still supporting health goals. They also said that a suggested product list would have helped streamline the process.
-
Although promotional materials were not used to promote healthier vending and standards during the pilot, both VMOs expressed interest in receiving specific resources (e.g. such as posters and signage) from FSA for future use.
VMOs views on consumer attitudes and behaviours
The pilot has brought to light contrasting ways in which consumers engage with healthier vending machine options, as VMOs believed these were shaped heavily by the type of site and its users.
VMO A observed from their work across a range of sites, that consumer engagement differs by site type.
-
In workplaces, VMO A staff observed that the consumers were more sensitive to reduced choice, especially where nut-free policies applied, often leaving only a few compliant products, which negatively affected satisfaction.
-
In leisure centres, VMO A staff observed a preference for balanced choices, especially among families. While placing low-calorie items at eye level was welcomed, maintaining variety was key to preventing customers from buying elsewhere.
-
VMO A also noted that functional and flavoured drinks were increasingly popular, with flavoured sparkling varieties performing better than plain. VMO A staff warned that enforcing a high-water percentage without including products like vitamin or flavoured waters in the guidance could lead to loss in sales.
-
Overall, VMO A staff noted that while consumers are engaging with healthier options, awareness of these changes is mixed. In some sites, consumers only realise products have changed when they notice the absence of previous favourites. Others actively request changes to meet their needs. In their view, this variation reinforces the need for clear labelling, ongoing consultation, and site-specific flexibility.
VMO B staff reported that although expectations around healthier products are changing, resistance to substantial shifts in vending machine offerings remains.
-
Public-facing sites like PS3 attract transient users, making it difficult to explain product changes, in their experience. VMO B staff noted that frustration often stems from the absence of familiar items like Coke, with no practical way to communicate the reasons. In contrast, they felt office environments like PS2 allow for internal communication, helping users better understand and accept changes.
-
VMO B staff doubted the success of fully implementing vending guidelines, citing consumer preferences for mixed offering. Staff frequently reported dissatisfaction, with repeated questions about the return of popular products.
Interview with VMO at NPS1 (non-implementing pilot site 1)
Perceptions of the nutritional standards
-
NPS1 vending operations team voluntarily incorporates many of the FSA nutritional standards, such as adhering to the 250-kcal limit suggested in Phase 1 of the standards, and most soft drinks containing less than 5 grams of sugar (also in Phase 1). Healthier, lower-calorie options are prominently placed, especially for children and health-conscious customers.
-
However, NPS1 did not fully adopt FSA nutritional standards due to fears of revenue loss and customers switching to nearby outlets.
-
NPS1 has chosen to exclude high-caffeine energy drinks for age and health reasons but continues to stock products that contain high sugar levels. They observed that athletes will bring their own preferred drinks if the vending options do not meet their tastes.
Consumer behaviours and preferences
-
Staff at NPS1 do not actively promote healthier options, but the team engages with consumers for feedback. They feel that reactions are mixed: parents and gym-goers seem to welcome healthier items, while others like some athletes prefer higher-sugar options for refuelling after training.
-
NPS1 staff noted that cereal bars which were placed in high-visibility spots performed poorly during their own pilot as only one bar was sold over a four-week period. In contrast, the temporary removal of a popular fizzy drink had minimal impact, as customers largely switched to the zero-sugar version. However, certain high-sugar or higher-calorie products remained popular, especially at sites where customers preferred larger snack options.
-
Overall, stakeholders at NPS1 believe that while there is support for healthier choices, many consumers still value familiar, less healthy products.
Consumer focus groups and interviews
Awareness of the product changes
-
All interviewed consumers at PS1 observed no noticeable changes in vending machine products post-nutritional standards implementation and machines were still perceived as being stocked with less healthy options like crisps, sweets, and chocolate bars.
-
Interviewed consumers at PS2 and PS3 reported clear and noticeable changes, including a shift towards sugar-free drinks and healthier snack alternatives, traditional fizzy drinks replaced by vitamin water and diet options, crisps replaced with baked or vegetable-based alternatives, and chocolate bars substituted with protein-rich snacks, such as protein bars, yoghurt bars, and products made with natural sugars or dried fruits.
Attitudes towards the new selection
-
Participants at PS1 initially didn’t notice health-related changes in vending machine products. Side-by-side images prompted greater awareness, helping some identify healthier options. One consumer highlighted the dominance of unhealthy items (e.g. crisps) and contrasted the limited selection with broader options at their university library. Another participant recognised recent changes, such as the removal of high-sugar products and the introduction of healthier snacks, but still felt the overall offering fell short of health-conscious expectations.
-
Placement was a concern for parents at PS1: sweets and energy drinks were often at children’s eye level, making them harder to avoid. Parents appreciated visibility of healthier, child-friendly snacks. One noted their children would be more open to cereal bars if sweets weren’t available.
-
At PS2 and PS3, participants had mixed feelings about the healthier options. Several participants remarked on the reduced variety and the protein bars as too heavy for an afternoon snack, which is typically what they would purchase from the vending machines. Although no formal sales data was shared, participants believed that usage may have declined due to the reduced appeal and higher prices. One individual noted there had been “rumblings” in the office about dissatisfaction with the selection, while another remarked uncertainty over how much the machines were still being used.
-
Consumers across all sites expressed interest in healthier snacks such as rice cakes, low-calorie crisps, or fruit-based options, though these were limited in availability and sometimes unclear in health benefits.
Pricing and accessibility concerns
- Some consumers didn’t check prices, but others noticed significant cost increases for healthier items, especially protein bars. Healthier snacks were seen as less affordable, particularly for families, and less appealing for casual or convenience purchases.
Impact on purchasing behaviour
-
Purchasing behaviour of consumers at PS1 remained occasional and convenience-driven, often after children’s swimming lessons. Contactless payment and lower cost than cafés were seen as advantages of vending machines. Consumers interviewed didn’t notice product changes - demand for healthier choices exists but is constrained by limited supply of healthy snacks.
-
At PS2 and PS3, participants recognised the shift towards healthier vending options, but many chose to reduce or stop purchases rather than switch. Frustration stemmed from lost choice, not resistance to healthier products. Vending machines were viewed as a source of occasional indulgence, not daily nourishment. Some participants began bringing snacks from home or skipping snacks altogether. While the principle of healthier options was supported, changes introduced by the VMO at these sites appeared to prompt disengagement rather than healthier behaviour.
Suggestions for improvement
-
Some consumers interviewed were surprised all items were under 200 calories and suggested clearer calorie labelling on machines. Proposed changes included arranging products from lowest to highest calorie with visible indicators to support healthier choices.
-
Participants emphasised avoiding language that reinforces “good” or “bad” food. One participant suggested using a food pyramid as a more neutral and educational visual tool, especially helpful for children.
-
Recommendations also included colour-coded labelling, similar to the traffic light labelling system, or displaying calorie information at the card reader to prompt more mindful choices at the point of purchase. Some consumers viewed these changes as useful but unlikely to change behaviour.
-
Parents suggested adding kids-specific drinks and snacks and offering smaller serving sizes.
Discussion
The evaluation of nutritional standards across three pilot sites revealed notable differences in implementation, effectiveness, and outcomes.
At PS1, VMO A demonstrated strong planning and coordination, drawing on prior experience with similar nutritional standards. The VMO systematically updated planograms, managed increased stock-keeping units (SKUs), and addressed logistical challenges such as delivery changes. Early staff engagement and adherence to the implementation strategy contributed to a smooth transition and stable operations. Importantly, VMO A substituted products with lower calorie alternatives that were similar in type and appeal to the original offerings.
This approach led to a reduction of approximately 26% in average calories and 35% in average sugar per unit sold at PS1, with drinks showing the most significant nutritional improvements. Notably, these nutritional changes did not result in weekly sales or revenue decline. Interview data supported these findings, with VMO A reporting stable sales and positive feedback from consumers. This approach demonstrated that nutritional standards can be effectively operationalised when product changes are carefully managed.
In contrast, PS2 and PS3 faced challenges that limited implementation effectiveness. Senior staff at VMO B were not involved in the early stages of the pilot, resulting in limited understanding of the pilot’s scope and objectives. Internal organisational changes further reduced staff engagement. This resulted in a compressed implementation period; five weeks at PS2 and two weeks at PS3. VMO B reported difficulties in sourcing suitable products, as well as higher costs which led to rushed product updates and logistical strain. As a result, replacement products were not similar in type to the original products (e.g. all chocolate bars were replaced with protein/yoghurt/cereal bars instead of lower calorie chocolate bars), which did not resonate with consumer expectations. Nonetheless, it is important to highlight that changes in drinks resulted in substantial reductions in both calories and sugars, while having a relatively minor impact on revenue and sales across both sites.
This substantial shift in vending offerings led to consumer disengagement, with some opting to bring snacks from home or skip vending altogether, as reported in the focus group. Consequently, both PS2 and PS3 experienced declines in sales and revenue. Interview findings attributed these declines to reduced consumer appeal and higher product prices. While some nutritional improvements were observed in the products offered, the overall impact was limited due to the compromised implementation.
Survey findings further illustrated differences in implementation across sites. PS3 saw a sharp rise in dissatisfaction, with 50% of respondents not satisfied at all (an increase of 47 percentage points). In contrast, PS1 experienced increased moderate and high satisfaction levels. These differences reflect variations in product range and implementation fidelity, which in turn influenced consumer purchasing behaviour and sales performance.
While the introduction of healthier vending options contributes to a healthier food environment, the findings highlight that tension can exist between health promotion and consumer autonomy if the product selection is not carefully managed. Consumers reacted more positively to the changes at PS1 where the replacement snacks were similar to the original products only lower in calories. However, consumers in PS2 and PS3, where the change in products was more notably different to the original products, perceived the new offerings as limited, unappealing, or overpriced. This led to reduced usage or substitution and highlighted the importance of product selection for the success of implementation.
The survey also revealed complexities in behavioural change and perceptions of ‘healthy’. At PS1, despite a 25% reduction in calories and sugar, some consumers did not perceive the vending machines as healthier. Conversely, at PS2 and PS3, products like protein bars were seen as healthy, even though they did not meet nutritional standards. Comparing sales profiles across sites suggests that consumers are more likely to accept incremental changes that preserve familiarity and will reject significant changes.
Participants generally supported the principle of offering healthier options, but expressed a desire for clearer labelling and more transparent nutritional information. Suggestions included calorie labelling, traffic light systems, and arranging products by calorie content. However, some participants noted that such measures might not significantly influence behaviour, as vending machines are often used for convenience or indulgence rather than health-conscious choices.
Finally, both VMOs noted that more flexible guidance, particularly around product categorisation, and additional support materials, such as promotional content and suggested product lists from the FSA, could have facilitated smoother implementation. While staff recognised the value of the standards, they stressed the need for practical support and realistic expectations to ensure long-term viability.
Overall, the findings emphasise the importance of early and sustained collaboration with VMOs, and a careful approach to product changes and selection that maintains consumer appeal.
Limitations
The pilot demonstrated that the nutritional standards are technically feasible to implement across diverse public sector settings. However, the scope of the evaluation was limited by several factors. Firstly, variability in VMO capacity and engagement influenced the fidelity and consistency of implementation. Secondly, partial implementation of the standards and short post-implementation periods at PS2 and PS3 constrained the ability to assess behavioural shifts. Finally, survey data was self-reported, which may not fully capture behavioural nuances.
Despite these limitations, the findings are valid within the context of the pilot and offer valuable insights for scaling the intervention. The mixed-methods approach, combining sales data with qualitative feedback, enhanced the robustness of the evaluation and allowed for triangulation of results.
Conclusions and recommendations
Conclusions
The pilot implementation of nutritional standards for vending across three public sector sites demonstrated that meaningful improvements in the nutritional quality of products are achievable, particularly in drinks, where sugary options were replaced with low- or no-sugar alternatives. At PS1, the product changes enhanced nutritional quality without impacting sales or revenue, and customer satisfaction improved. In contrast, the replacement snack products at PS2 and PS3 were very different to the original products, leading to customer dissatisfaction and declines in sales and revenue. Consumer feedback emphasised a preference for familiar products with better nutritional profiles rather than complete replacements, and operational success varied depending on the vending machine operators’ experience and capacity.
This pilot adds to the evidence base by demonstrating that nutritional standards can be applied successfully and achieve a reduction in calories without incurring a reduction in sales. Findings from PS1 particularly highlighted the success of the nutritional standards in the leisure setting. This pilot also reinforces the need for flexible, context-sensitive implementation models that accommodate operational realities and consumer preferences while balancing public health aims. It also highlighted the need for VMOs to receive active guidance and support from the FSA throughout implementation.
Recommendations
Based on the findings, the following recommendations are proposed.
Site managers and Vending Operators
-
Any sites wishing to introduce healthier vending should work closely with their chosen vending company to select products that will meet nutritional standards but also meet customer expectations.
-
Before implementing the standards, the VMO should source and create a list of products that comply with the nutritional standards so that vending machines can be stocked with compliant products from launch date.
-
Vending operators and site managers should contact the FSA if further support is required with either interpreting the standards or selecting suitable products.
-
Site managers at implementing sites should routinely check compliance with the standards to ensure they are being adhered to.
The FSA
-
The FSA should strengthen collaboration with VMOs from the outset to secure senior stakeholder buy-in, ensure alignment with standards and assess operational feasibility.
-
The FSA should provide support on interpreting and applying the standards, especially for smaller or less experienced operators. This could be through facilitating regular consultation between the site and VMO to help prioritise product selections that mirrors existing offerings in healthier formats, and support the phased approach recommended by the standards.
-
To build confidence, promote consistency and enhance implementation success, the FSA should share best practice and case studies from VMOs who have successfully adopted the standards, particularly where long-term impacts have been tracked. Highlighting effective strategies and outcomes can inform decision-making and encourage uptake across diverse settings.
-
The FSA should implement a periodic review of the standards, involving VMOs to ensure continued relevance to consumer preferences, scientific developments, and product availability. For example, HSC standards are currently reviewed every three years. As part of a review process, the FSA should review product categorisation, as new products are developed and come to the market.