1. Introduction
In Northern Ireland (NI), the Food Standards Agency (FSA) have a remit for dietary health and are committed to ensuring that food is healthier and more sustainable. The FSA supports food businesses to achieve this through its Making Food Better Programme (FSA, 2025). As part of this, the FSA and local councils across NI deliver a nutritional sampling programme to better understand the nutritional content of products popular with NI consumers.
According to the NI Health Survey, almost two-thirds of adults live with overweight or obesity (Department of Health, 2024). High intakes of free sugars have been linked to higher energy intakes, which contributes to weight gain. Data from the National Diet and Nutrition Survey (NDNS) indicates that consumers in NI are eating more free sugars and saturated fat than recommended (Roberts et al., 2025).
Snacking on foods high in saturated fat, sugar and salt is a common. When asked as part of the NDNS, 43% of NI participants reported buying snacks when out (Roberts et al., 2025).
Traybakes are a sweet snack commonly eaten by NI consumers and that are produced and sold by many local food businesses. Given this, the FSA and local councils in NI collaborated to assess the portion size and nutritional content of popular traybakes on sale in NI. The findings provide baseline data against which reformulation efforts can be measured.
Reformulation poses an opportunity for businesses to reduce portion sizes of these products, which would, in turn, reduce the energy, saturated fat and total sugar content. To support local food businesses to improve the nutritional content of their traybakes, the FSA commissioned College of Agriculture, Food and Rural Enterprise (CAFRE) to conduct research to investigate consumers views on the portion size of traybakes.
1.1. Objectives
The project objectives were to:
-
conduct nutritional analysis of popular traybakes to determine the portion size and nutritional content,
-
conduct testing to determine preferred portion size of traybakes among NI consumers,
-
investigate what influences consumers’ portion size preferences of traybakes,
-
determine how much food manufacturers can reduce the size of traybake portions while ensuring they remain acceptable to consumers.
2. Material and methods
All methods were in line with the government Joint Code of Practice (Department for Environment, Food & Rural Affairs, 2015). No specific, identifiable personal information was collected during the project. Each participant gave consent to take part in the data gathering, which was anonymised.
2.1. Nutritional analysis
The eleven local councils in NI collected traybake samples from local food businesses using a set protocol. Traybake samples were limited to three product types: Fifteens, Rocky Roads and Caramel Squares. This was based on their popularity and availability across local businesses.
Local councils were asked to take six traybake samples, two of each traybake type, from different businesses. This was to ensure samples were representative of the traybakes on sale across NI.
Samples were sent to Public Analyst Scientific Services, an accredited laboratory, for nutritional analysis.
Local councils were asked to sample single-serve traybakes intended for individual consumption from local food businesses, using the inclusion and exclusion criteria outlined in Table 1.
Mean, minimum and maximum energy, total fat, saturated fat and total sugar content per portion and per 100g were calculated for each traybake type (Fifteens, Rocky Roads and Caramel Squares).
Anonymised data tables containing survey responses and full nutritional analysis results are available on request by emailing DietaryHealthNI@food.gov.uk.
2.2. Sensory panels
Three separate sensory panels were conducted, recruiting a total of 102 participants, who visually assessed the traybakes to complete the questionnaire. Visual appearance was the only sensory attribute assessed as part of the questionnaire and participants did not consume the traybakes.
Traybake samples were prepared by CAFRE and all sizes (small, medium and large) followed the same dimensions for each traybake type. The weights for each traybake type were calculated based on data from the nutritional analysis research. Trays presented to participants contained nine traybakes; a small, medium and large Fifteen, Rocky Road and Caramel Square. The weights for each size were:
-
Fifteen: small = 55g, medium = 110g, large = 170g
-
Rocky Road: small = 60g, medium = 100g, large = 135g
-
Caramel Square: small = 40g, medium = 85g, large = 130g
Each traybake was assigned a randomised code using Compusense™ software to prevent bias and each participant received a tray with a different randomised order of nine samples (Compusense, 1986). The Compusense™ software generated a tray number to prevent risk of variability and bias. Prior to the sensory panels, participants completed a questionnaire (Appendix A) to capture their demographic information, traybake consumption frequency and traybake preferences, followed by specific questions to determine consumer perceptions of three traybake sizes (small, medium and large) across three variants (Fifteens, Rocky Roads and Caramel Squares). Participants used a hedonic scale to measure their preference of each size of traybake (Science Direct, 2018). Hedonic scales are widely used in market research and sensory evaluation to assess consumer acceptance and preference. A scale from 1 (dislike extremely) to 9 (like extremely) was used in this instance.
The participants were un-trained and not screened for specific sensory thresholds, meaning the results are more likely to be indicative of opinions of the general public rather than highly screened or trained participants.
Private booths allowed the participants to conduct the panel anonymously on the computers provided, without any influence from others to prevent variability and bias. Booths were quiet, free from disruptions and distractions, had neutral surfaces, controlled temperature and adequate controlled lighting.
The participants completed 13 questions as part of the assessment which gathered information on consumer habits in relation to traybakes and specific attributes of each type. The participants were then asked a series of questions in relation to the preferred portion size of each traybake, which were referred to by the blind coding system. Participants then ranked the attributes that influence their choice of traybake when purchasing in a coffee shop.
The factors that participants were asked to rank in relation to what influenced their purchase were:
-
Visual Appearance
-
Personal preference/taste
-
Dietary requirements
-
Sustainability of ingredients
-
Hunger level
-
Larger portion
-
Smaller portion
-
Occasion/time of day
-
Price
-
Nutritional information
-
Quality
All data was collated using Compusense™ software and was held in confidence on CAFRE’s password encrypted data storage platform.
2.3. Focus groups
A total of twenty participants attended three focus group sessions which took place in a purpose-designed consumer focus group suite at CAFRE. On each occasion, a facilitator led the discussions, managed the group and kept the conversation on track.
A series of 21 questions (Appendix B) was designed by CAFRE staff in conjunction with FSA to investigate factors that influence consumer’s portion size preferences such as health consciousness, price or convenience.
Each focus group was voice recorded with the participants’ consent (Appendix C). The focus group sessions lasted approximately 60 minutes, during which visual samples of traybakes were presented to create discussion points and illicit responses from participants regarding their attitudes and perceptions of traybake portion sizes and nutritional content. Participants contributed to the discussion by sharing their thoughts, feelings and experiences and provided the qualitative data required.
Afterwards, the recording of the session was examined by the facilitator and the key points were extracted for each question and summarised. No specific or identifiable contact information was collected or retained for the focus group element of the project. The voice recording was destroyed after the notes had been transcribed with the notes held on CAFRE’s password encrypted data storage platform.
3. Results
3.1. Nutritional analysis
Between January and March 2024, local councils sampled a total of 59 traybakes. Table 2 outlines the number of samples per traybake type.
3.1.1. Headline results
On average traybakes weighed 105.7g and contained 484kcal, 13.2g saturated fat and 44.1g total sugar per portion.
The largest traybake, a Rocky Road, weighed 217.3g. It contained the most:
-
Energy, 1026kcal, just over half the daily recommendation for females.
-
Saturated fat, 29.7g, which is more than the maximum amount recommended for females per day.
-
Total sugar, 103.2g, more than the maximum amount recommended for adults per day.
3.1.2. Results per portion
Results per portion are set out in Table 3.
3.1.3. Results per 100g
Results per 100g are set out in Table 4.
3.2. Sensory panel results
3.2.1. Demographic characteristics
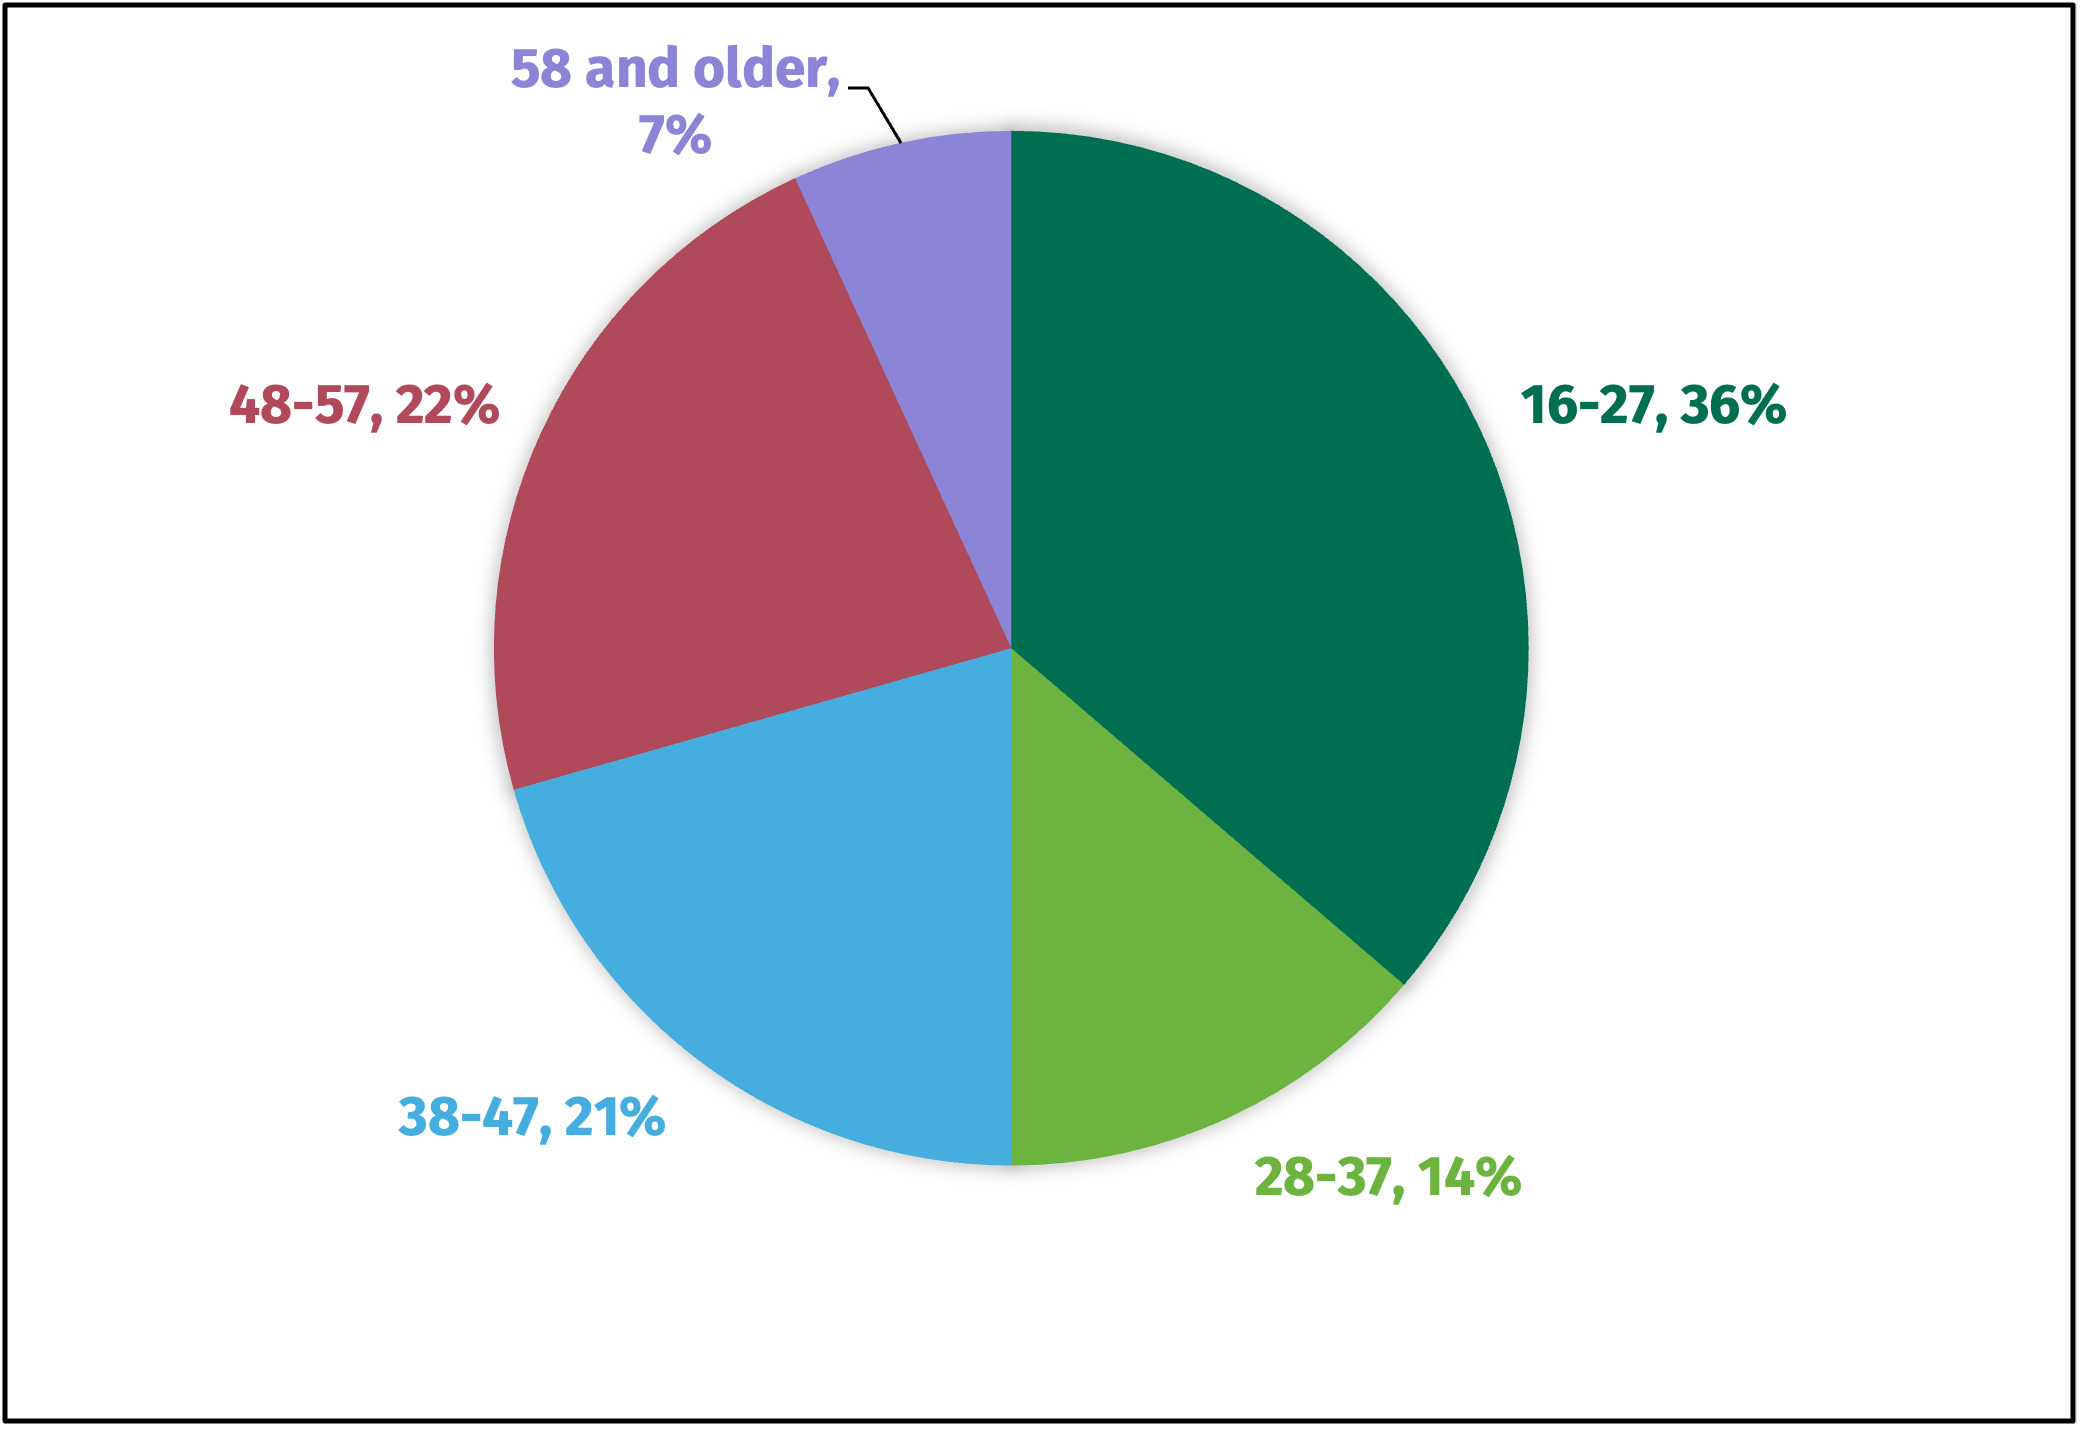
Over one-third of participants (36%, n=37) were aged between 16-27 years. Most participants identified as female (84%, n= 86), with only 16% (n = 16) identifying as male.

3.2.2. Traybake consumption
Most participants (73%) consumed traybakes at least once a fortnight or more. Almost half of participants (43%) consumed traybakes once a week and one in ten (9%) stated that they eat traybakes less than once a month. Nearly half of participants (47%) selected caramel squares as their most preferred traybake, and one third of participants (35%) selected fifteens as their most preferred traybake. Rocky roads were the least preferred, with only 6% selecting them (n=6).

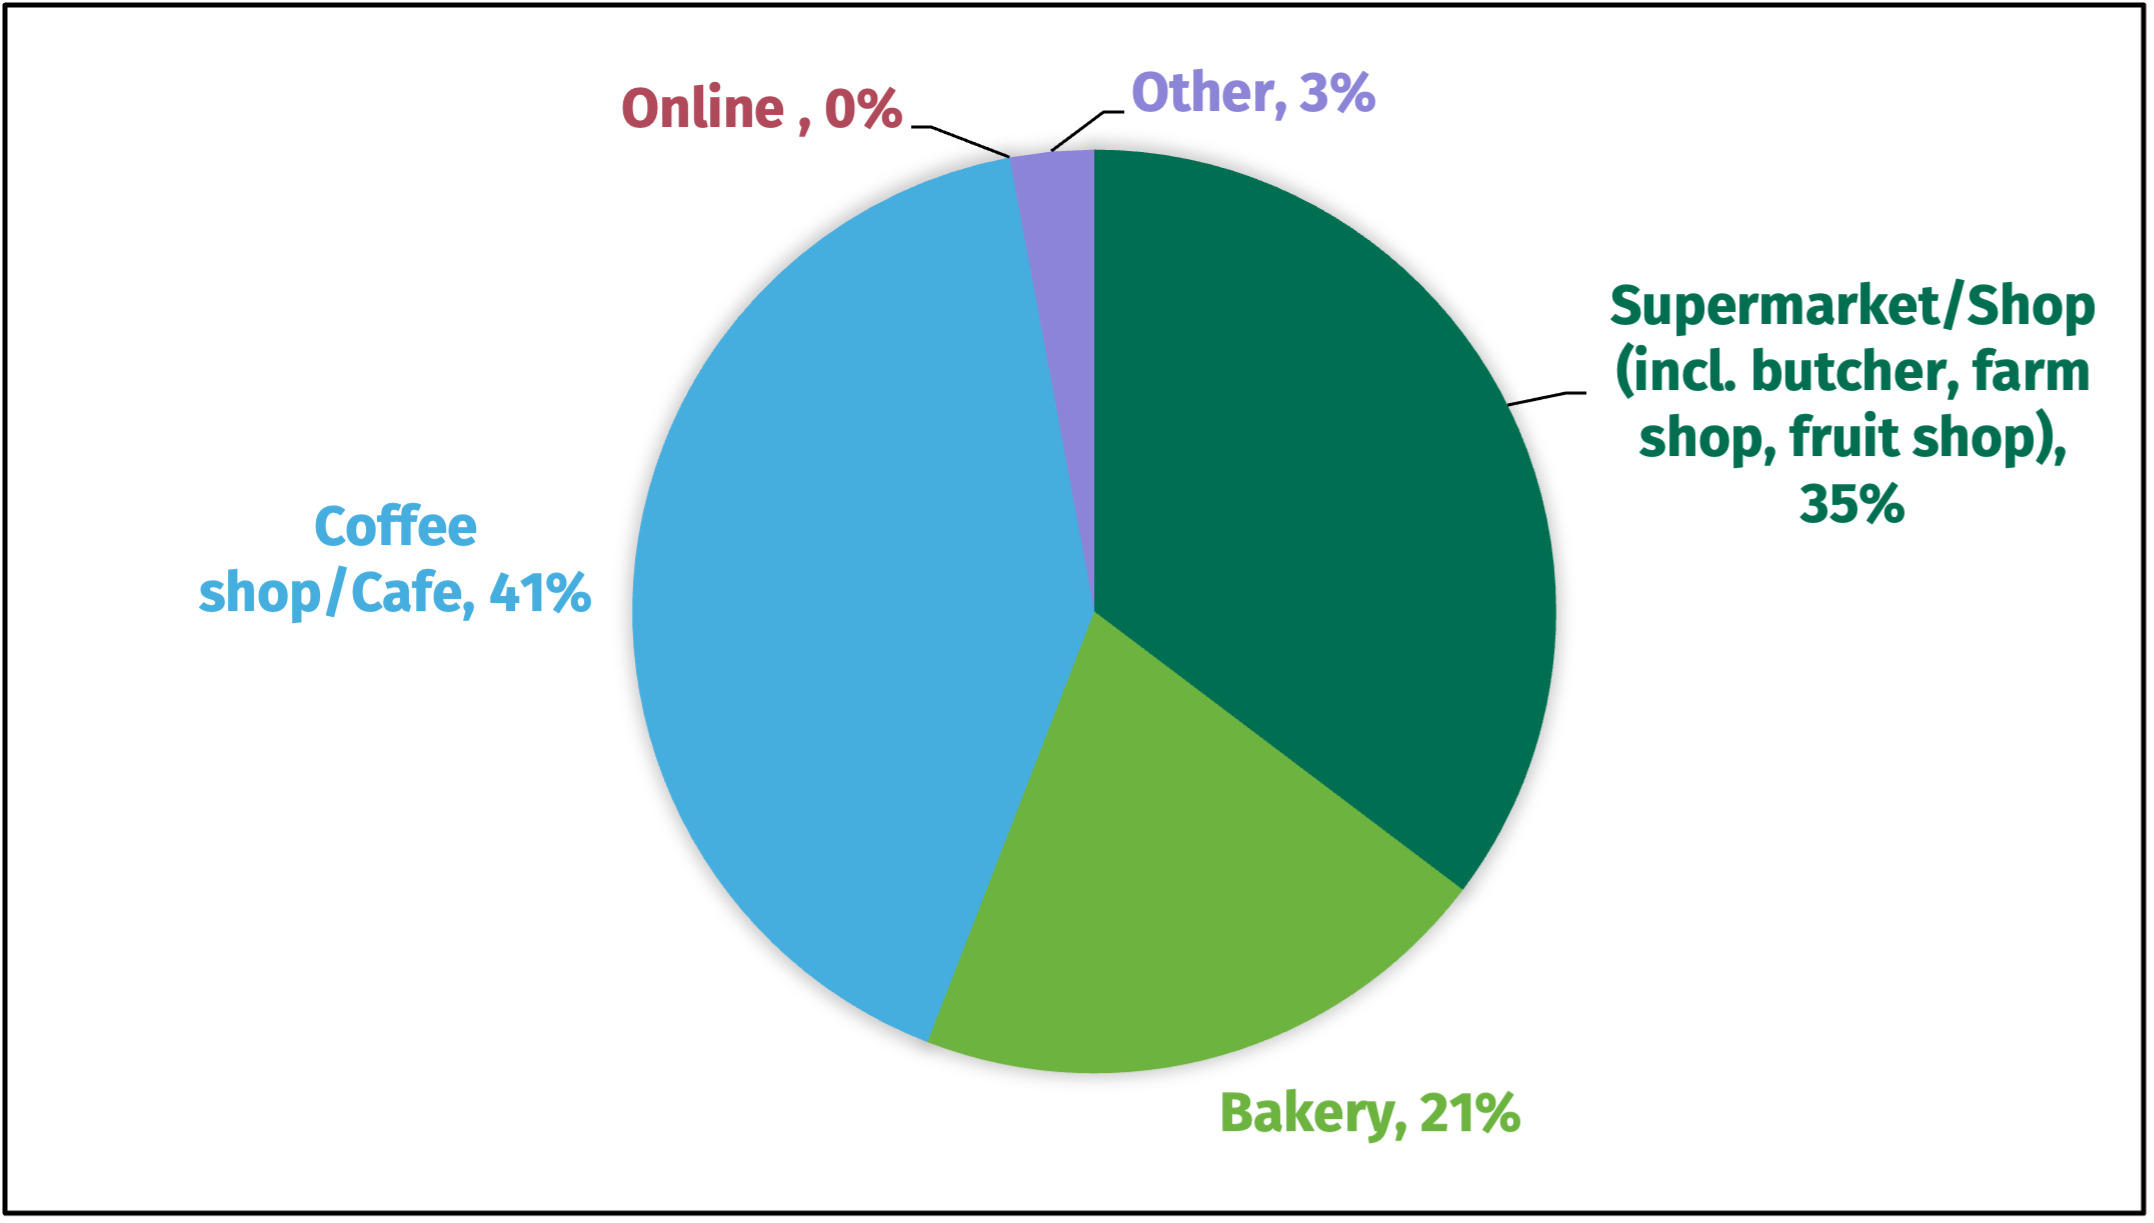
Coffee shops and supermarkets were found to be the most common places to purchase traybakes at 41% and 35% respectively. None of the participants purchased traybakes online.
3.2.3. Traybake preferences
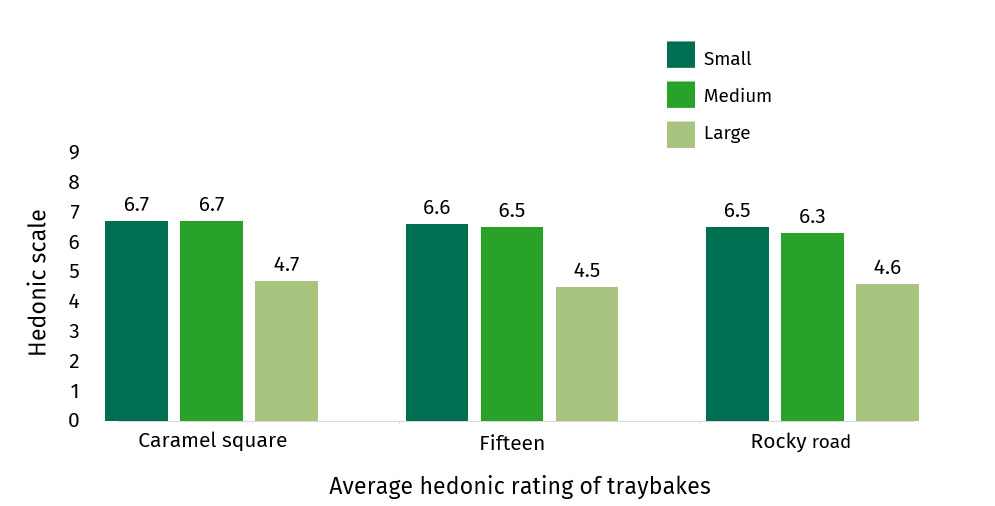
Participants were presented with 9 traybakes on a tray in randomised order to prevent bias (Appendix D) and were asked to visually evaluate each sample using a Hedonic scale (Appendix A Question 10) from 1 (dislike extremely) to 9 (like extremely). Figure 3 demonstrates the results from participants’ responses.

Participants consistently chose the largest traybake of the 3 variants as their least favourite. Average responses for the three traybake variants’ large portions ranged from 4 (dislike slightly) to 5 (neither like nor dislike). Small and medium portions of the three traybake variants were scored similarly, with average responses ranging from 6 (like slightly) to 7 (like moderately).
The small portion sizes were the most popular across all traybake types, with between 49%-55% of participants stating this was their preferred option. The medium portion size was favoured by between 39%-42% of participants and across all variants, less than 10% of participants preferred the large traybake.
3.2.4. Factors influencing purchasing choices
Participants also ranked the factors influencing their purchase choices. Rank totals were then calculated to determine the importance of each factor, with lower rank totals indicating factors of higher importance. Visual appearance (rank total 208) was deemed the most influential purchasing factor, whilst sustainability of ingredients was ranked the least influential factor. Taste (273), quality (412) and price (475) were also deemed by to be influential factors for traybake purchasing whilst smaller portion sizes (721) and larger portion sizes (815) were less prominent in influencing purchasing decisions.
3.3. Focus group results
The main findings from the focus groups are summarised below:
-
Traybakes were viewed as a treat and participants generally reported they were unconcerned about the nutritional value when having a treat.
-
The drivers for purchasing traybakes in a coffee shop versus shop bought were dependent on occasion. Participants reported that coffee shop purchases were deemed a social occasion, and that they would be willing to indulge in a larger portion or more expensive product when eating out of the home. The shop bought products were seen as a less expensive treat that participants consume more regularly. Participants stated that they expect shop bought traybakes to be smaller in size compared to those in coffee shops.
-
Participants stated that their sharing of traybakes with others was dependent on portion size. When portion sizes were presented to the participants, the majority stated they would share the large portion size. If sharing, most participants would share one portion between two adults or one portion between one adult and two kids. However, participants stated that they would only share the medium size traybake if it was overly expensive or if they were not feeling very hungry.
-
Some participants thought that the displaying of nutritional information may influence their choice i.e. choosing something less calorific. However, they expressed that since a traybake purchase was still considered a ‘treat’ occasion, displaying this information would not entirely discourage them from consuming traybakes.
-
Participants also expressed that they are willing to pay more for traybakes in a coffee shop but would not be willing to pay the same price for a reduced portion size.
-
The consensus among participants was that if the decrease in portion size was gradual, they would be less likely to notice a change over time.
4. Discussion
Sampling and nutritional analysis undertaken by local council environmental health teams found that traybakes served in businesses in NI are generally high in energy, fat, saturated fat, and total sugar. They are often sold in large portion sizes, with an average weight of 105g and some portions weighing up to 217g. This substantial variation in portion size is a key driver of nutritional content, with larger traybakes containing more energy, saturated fat and total sugar per portion.
While total sugar content per 100g was broadly similar across the three traybake types sampled, there were notable differences in other nutrients. Rocky Roads consistently had the highest levels of energy, total fat, and saturated fat per 100g. While Fifteens had the lowest energy and fat content. Caramel Squares had the highest total fat content in a single portion (53.4g), and Rocky Roads had the highest saturated fat (29.7g).
When compared with dietary recommendations, the findings are concerning. A single portion of the largest sample, a Rocky Road, contained:
-
1,026kcal, over half the daily energy recommendation for females,
-
29.7g of saturated fat, over the daily saturated fat recommendation for females,
-
103g of total sugar, over the daily recommendation for adults.
This highlights the potential for traybakes to contribute significantly to daily energy and nutritional intakes, particularly when consumed frequently.
Reformulation of food to reduce the energy, saturated fat, total sugar or salt can involve a variety of approaches, one of which is reducing the portion size of products. Food reformulation can therefore pose an opportunity for food manufacturers to actively take part in making the food environment healthier for consumers.
Research with food manufacturers identified ‘consumer acceptance’ as one of the barriers to reformulating products (Ipsos Northern Ireland, 2024). Therefore, food manufacturers may be reluctant to reformulate if consumers are less likely to buy the products.
When investigating consumer acceptance of traybake portion sizes, less than 10% of participants preferred the largest traybakes across all traybake types, suggesting that consumers do not prefer large traybakes. Findings from the focus groups showed that participants viewed traybakes as a treat, however 43% of participants indicated during the survey that they consume traybakes at least once a week. Some participants expressed that displaying nutritional information such as calories, saturated fat and sugar may influence their choice of product, encouraging them to opt for a lower calorie option or make them more likely to share the portion with another person. However, since traybake purchases were considered a treat purchased on occasion by focus group participants, displaying nutritional information may not entirely discourage the purchase of such products completely. Therefore, showing nutritional information in this setting may not be the best way to help people eat healthier.
Consumers were generally willing to pay more for a traybake in a coffee shop versus shop-bought but were unwilling to pay the same price for a product with a reduced portion size. Most participants agreed that reducing portion sizes gradually over time would be the best option, as they would be less likely to notice the difference. This may provide a route to reformulation for manufacturers of traybakes with concerns of consumer acceptability.
Overall, this study has shown that consumers show a preference for small and medium sized traybakes versus larger portion sizes that are commonly found in NI cafés. Participants expressed an openness to reducing traybake portion sizes, if the change is incremental and the price of products reflects this change. These findings should aid the FSA’s Making Food Better Programme in supporting NI food businesses to make the food environment healthier by encouraging manufacturers to reduce traybake portion sizes.
Acknowledgements
The FSA would like to thank Environmental Health Officers (EHOs) from the eleven local councils in NI and the College of Agriculture, Food and Rural Enterprise (CAFRE). EHOs led and funded the sampling and nutritional analysis of traybakes and contributed to the preparation of the final report. CAFRE conducted the sensory panels, focus groups and contributed to the preparation of the final report. The FSA would also like to thank all the research participants.
Question 1. “Select your age category”
Question 5. “Where do you most commonly purchase traybakes?”
Question: “You have been presented with nine samples of traybakes, please visually evaluate each sample using the hedonic scoring system provided”