


1. Introduction
The National Diet and Nutrition Survey reported that between 2017-2023, children aged 11-18 years in Northern Ireland (NI) exceeded recommended maximum intakes for saturated fats and free sugars, and had average intakes below the recommendation for fibre, vitamin A, vitamin D, folate, iron, calcium, magnesium, potassium, iodine, selenium and zinc. The most recent obesity statistics from the Northern Ireland Health Survey (2024/25) stated that 67% of adults are classified as living with overweight or obesity. The Northern Ireland Health Survey (2019/2020) report that among children aged 2 to 15, 26% are living with overweight or obesity. The Health Inequalities Annual Report further highlights the stark disparities in obesity prevalence. Data from the latest report shows that in 2024/25, the percentage of primary 8 pupils affected by obesity in the most deprived areas was 87% higher than the rate in the least deprived areas.
The availability of fast food outlets and grocery retailers in Northern Ireland and their distance to secondary schools, (Davis et al. 2025) (hereafter referred to as Study 1) highlighted that secondary schools within the most deprived areas in NI (based on analysis using the Multiple Deprivation Measure (MDM) of each schools’ location) tended to have higher rates of fast food outlets and grocery retailers compared to the least deprived areas.
Following publication of Study 1, stakeholders expressed interest in using free school meal entitlement (FSME) as a proxy measure for deprivation. This is intended to give a more detailed depiction of the socio-economic status of the children attending secondary schools, noting that the MDM analysis was based on school location and not the student cohort. Using FSME as a proxy measure of deprivation will allow for extended contextual understanding regarding possible drivers of potential health inequalities that exist around school environments in NI.
1.1. Aims of the study
The aims of the study were:
-
To investigate if there are any trends in the availability of fast food outlets and grocery retailers with FSME as a proxy indicator of socio-economic deprivation.
-
To compare findings derived from student cohort FSME analysis with Study 1 results using the location-based MDM of the school and evaluate potential methodological differences.
-
To provide online interactive maps that enable stakeholders, including the public, to visualise the key findings.
2. Methodology
The methodology closely follows that in Study 1 (Davis et al. 2025) and can be summarised as:
-
Identify relevant businesses (fast food outlets and grocery retailers)
-
Identify secondary schools in scope
-
Create 400m radius circular buffer zones around secondary schools and count businesses within the buffer zones (fast food outlets and grocery retailers separately)
- Explore trends against student cohort deprivation using FSME as a proxy indicator
This study will be referred to in the following commentary as Study 2.
2.1. Data sources, filtering and transformation
The data used in this study are identical to those in Study 1 (Davis et al. 2025), using business data taken from the Food Hygiene Ratings Scheme (FHRS) with the addition of FSME data (percentage of pupils per school) sourced from Department of Education School Census 2024/25.
Businesses were categorised as fast food outlets and grocery retailers by filtering FHRS categories and identifying key search terms to include or exclude businesses. Further detail can be found in Davis et al. 2025, with limitations presented in Section 3.3.
2.2. FSME thresholds
In order to provide insights relevant to wider stakeholders, this study provides two separate assessments: one using the lower and upper 25th percentiles for FSME; and the other using a threshold of FSME greater than 37%.
2.2.1. Lower and upper 25th percentiles
To assess potential differences based on students’ relative deprivation levels, the lower 25th percentile and upper 75th are used. Note that these percentiles have been arbitrarily chosen and do not necessarily indicate low or high deprivation respectively, in absolute terms.
The lower 25th percentile contains schools with students’ FSME less than 12.0%, whereas the upper 75th percentile contains schools with students’ FSME greater than 33.4%. This results in an even number of 48 schools within each percentile. For the purpose of the results commentary in this study, schools within the lower 25th percentile will be referred to as “the least deprived group” and schools within the 75th percentile will be referred to as “the most deprived group”.
2.2.2. FSME greater than 37%
The use of FSME greater than 37% is based on one of the eligibility criteria for the Extended Schools Programme. The programme provides finances to support children and young people from disadvantaged backgrounds in NI, through provision of services before, during and after the school day. The Extended Schools Criteria and Funding states the school must have the following for eligibility:
-
51% or more of their pupils living in either a Neighbourhood Renewal Area (NRA) or the 30% most deprived Super Output Areas (SOAs) (using both the MDM (2017) and Education Domain) and/or;
-
37% or more of pupils with a Free School Meal Entitlement (FSME).
As the 37% FMSE threshold does not necessarily represent a cut-off for high deprivation, results given in Section 3.2.2 are provided as a basis to assist wider stakeholders only and therefore no commentary is provided.
3. Results
190 secondary schools across NI were investigated. The minimum FSME was 2.9%, the mean was 24.8% and the maximum was 67.3%.
3.1. FSME compared to MDM
Study 1 (Davis et al. 2025) used the MDM rank of each school (from 1-890), based on the SOA that it was located in to investigate any trends with deprivation. Note that lower ranks denote the most deprived areas relative to other areas.
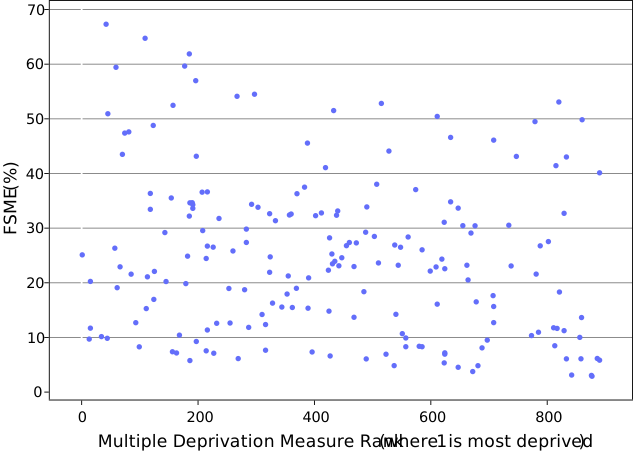
To explore any differences between MDM rank of the SOA that the school is located and FSME of the school’s student cohort, the two metrics have been plotted against each other for each secondary school in Figure 1. The graph shows there is significant scatter in the data and there is no evidence of any significant correlation between the two metrics.
There are a large number of schools with low MDM rank, such as less than 200 (i.e. relatively high deprived area), coupled with low FSME (i.e. low deprivation of student cohort); and conversely with high MDM rank such as greater than 700 (i.e. relatively low deprived area) coupled with high FSME (i.e. high deprivation of student cohort). In other words, schools identified as being located in a deprived areas in Study 1 (by MDM rank) may have a lower number of students entitled to Free School Meals as identified in Study 2, and vice versa.
_against_mdm_rank_of_each_secondary_school.svg)
3.2. Availability of fast food outlets and grocery retailers close to secondary schools
This section details the assessment of fast food outlets and grocery retailers within a 400m radius of secondary schools.
3.2.1. 25th and 75th percentiles of FSME distribution
In this section, ‘least deprived group’ is defined as schools within the lower 25th percentile of the FSME distribution (less than 12.0% FSME) and ‘most deprived group’ is defined as schools within the upper 75th percentile of the FSME distribution (greater than 33.4% FSME). As noted in Section 2.2.1, the two thresholds represent relative deprivation levels, not absolute deprivation of the students. There were 48 schools in each category.
-
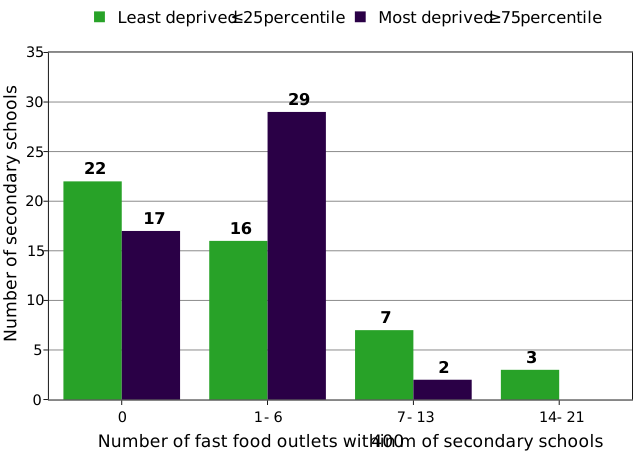
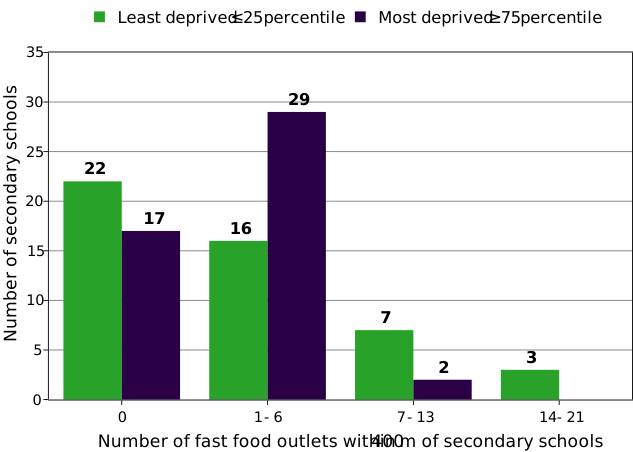
17 schools with student cohorts in the most deprived group have no fast food outlets within 400m, compared with 22 schools with student cohorts in the least deprived group.
-
29 schools with student cohorts in the most deprived group have 1-6 fast food outlets within 400m, compared with 16 schools with student cohorts in the least deprived group.
-
2 schools with student cohorts in the most deprived group have more than 7 fast food outlets within 400m, compared to 10 schools with student cohorts in the least deprived group.
-
For schools with a fast food outlet within 400m, the mean number of outlets is 3.2 for schools with student cohorts in the most deprived group and 6.3 outlets for schools with student cohorts in the least deprived group.
-
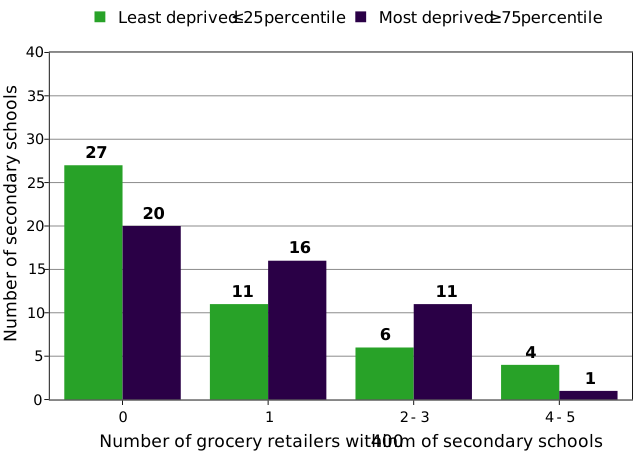
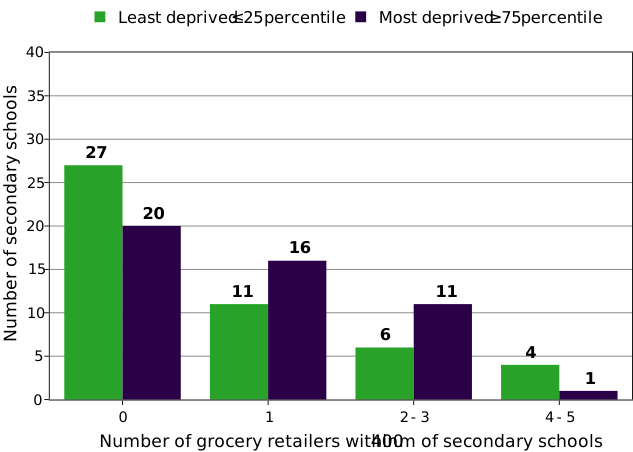
20 schools with student cohorts in the most deprived group have no grocery retailers within 400m, compared with 27 schools with student cohorts in the least deprived group.
-
27 schools with student cohorts in the most deprived group have 1-3 grocery retailers within 400m, compared to 17 schools with student cohorts in the least deprived group.
-
1 school with a student cohort in the most deprived group had 5 grocery retailers within 400m compared to 4 schools that had 4-5 grocery retailers within 400m with student cohorts in the least deprived group.
-
For schools with a grocery retailer within 400m, the mean number of outlets is 1.6 for schools with student cohorts in the most deprived group and 1.9 for schools with student cohorts in the least deprived student group.
3.2.2. FSME greater than 37%
33 secondary schools were identified as having FSME greater than 37% (17% of total number of secondary schools). Of these schools, 14 had no fast food outlets or grocery retailers within 400m. The maximum number of fast food outlets within 400m was 7 and the maximum number of grocery retailers within 400m was 3.
3.3. Limitations and further considerations
While this study provides a useful evidence base, there are a number of methodological limitations that should be noted (reproduced from the previous study in Davis et al. 2025):
-
All fast food outlets were considered to have an equal impact; however, each will provide various food options and therefore have a wide range of health impacts on the consumer.
-
Grocery retailers were used to assess the availability of healthier food options, however they also typically sell unhealthy food, and some may sell limited healthier options.
-
Businesses that are not specified in the FHRS under the category ‘Retailers – supermarkets/hypermarkets’ and are not part of a large chain or affiliated to a large franchise were not included in the grocery retailers’ data. This may mean a small number of businesses such as convenience stores were not captured; however, these are not expected to provide significant healthier options.
-
Mobile retailers, or those with no address were excluded from this study.
-
Food options that are located along main walking/cycling routes for school children may be more accessible than those closer to schools which are away from these routes.
-
The use of a circular buffer zone around secondary schools is simplistic and does not account for the location of access/egress points into each school.
-
Business location coordinates in the FHRS data are of varying accuracy and were not provided for all businesses. Where coordinates were not available, the centroid location of the business postcodes were used to identify approximate locations of businesses.
-
In addition, it should be noted that use of 25th and 75th percentiles for FSME have been used to indicate relatively low and high levels of deprivation respectively. However, as the FSME percentiles are relative measures based on the data for all schools, these thresholds reflect deprivation in the context of this dataset and do not necessarily represent absolute levels of socio-economic deprivation.
-
This study did not investigate fast food outlet operating times, the rates at which school children visit fast food outlets or grocery retailers, or indeed their reasons for visiting them. There are multiple factors other than distance to secondary schools which may encourage young people to visit fast food outlets, including but not limited to; accessible and affordable food options, a warm environment or free amenities such as Wi-Fi. Such factors should be investigated in future work.
4. Discussion
The previous study (Davis et al. 2025) noted, "Deprivation is extremely localised and highly variable. When investigating businesses close to secondary schools with deprivation, consideration should be given that children may reside in a different area to the school location which could have a significantly different deprivation rank." Furthermore, it should be noted that as MDM is rank based, it is a relative measure.
In contrast, FSME is an absolute metric based on students’ parents’ economic status; and provides another measure to assess the picture regarding drivers of potential food inequalities around school food environments.
This study found no evidence of a correlation between deprivation as measured by MDM rank of the SOA each school is in (Study 1) and deprivation as measured by FSME (Study 2). Therefore, the two metrics, MDM and FSME give differing perspectives on the assessment of availability of fast food outlets and grocery retailers close to secondary schools: MDM providing insight based on the deprivation of the school location; and FSME providing insight based on students’ parents’ socio-economic status
As previously noted, MDM results in Study 1 (Davis et al. 2025) used 25th and 75th percentiles based on the entire range of SOA MDM ranks (1-890) across NI. This identified schools that were in the most and least deprived SOAs in NI, rather than identifying the 25th and 75th percentiles of the 190 secondary schools as an isolated dataset. As such, the number of schools in the low and high deprivation category were not equal (40 and 53 schools respectively), as schools were not evenly distributed against MDM rank. Care should therefore be taken not to directly compare the results regarding deprivation from Study 1 with those in Study 2 on a like-for-like basis, however general trends can be observed.
The results using FSME give similar conclusions to the MDM study when assessing 0-6 fast food outlets within 400m between the least and most deprived schools. However, at the high-end (7 or more fast food outlets within 400m), the two approaches give opposing results. Study 2, using FSME, showed a higher prevalence of fast food outlets for the schools with the least deprived student cohorts and Study 1 showed a higher prevalence for the schools located in the more deprived areas. This suggests that schools with large numbers of fast food outlets within 400m are located in relatively deprived areas, but the students who attend the schools are less deprived based on FSME. These schools may reside in urban areas, which typically have a higher density of fast food outlets, but whose students may not live in the SOA the school is located in.
The proportion of grocery retailers within 400m of the least deprived schools compared to the most deprived schools is larger when using FSME compared to MDM. This could be due to differences in the methodology – there are identical numbers of the least and most deprived schools in Study 2, while there are a greater number of the most deprived schools compared to the least deprived schools in the MDM study.
It should be emphasised that the two metrics (FSME and MDM) and the differing methodologies are equally valid as they represent different deprivation indicators. For the purposes of assessing possible drivers of health inequalities at a student level that may exist around secondary school environments, it is suggested that FSME may be the more appropriate of the two metrics.
5. Conclusion
In conclusion, this study found there is variability in the exposure to fast food outlets around schools when assessing against student deprivation as measured by FSME. For example, there are a greater number of schools with relatively more deprived student cohorts that have at least one fast food outlet within 400m (31) compared to the number of schools with relatively less deprived student cohorts (26). However, high-density clusters of fast food outlets (7–21) are more common for schools with relatively less deprived student cohorts (10) compared to the number of schools with relatively more deprived student cohorts (2).
Similar variability was found in the exposure to grocery retailers around schools when assessing against student deprivation as measured by FSME. There are a greater number of schools with relatively more deprived student cohorts that have at least one grocery retailer within 400m (28) compared to the number of schools with relatively less deprived student cohorts (21). High-density clusters of grocery retailers (2–5) are similar for schools with relatively less deprived student cohorts (10) and schools with relatively more deprived student cohorts (12).
Results have been presented for schools with FSME greater than 37% to provide insights relevant to wider stakeholders as this is a criterion for the Extended Schools Programme.
Acknowledgements
The FSA would like to acknowledge the contributions of the following people and organisations to the delivery of this research project:
Dr Gareth Davis (CADA Consulting Limited)
Steve Pimlott (Fillip Advisory Services Limited)
Lewis Keogh (Sustainabl Limited)
Dr Brídín Nally (Food Standards Agency)
Naomi Davidson (Food Standards Agency)
Jennifer McGonagle (Food Standards Agency)
Labhaoise Freel (Food Standards Agency)
C407061