
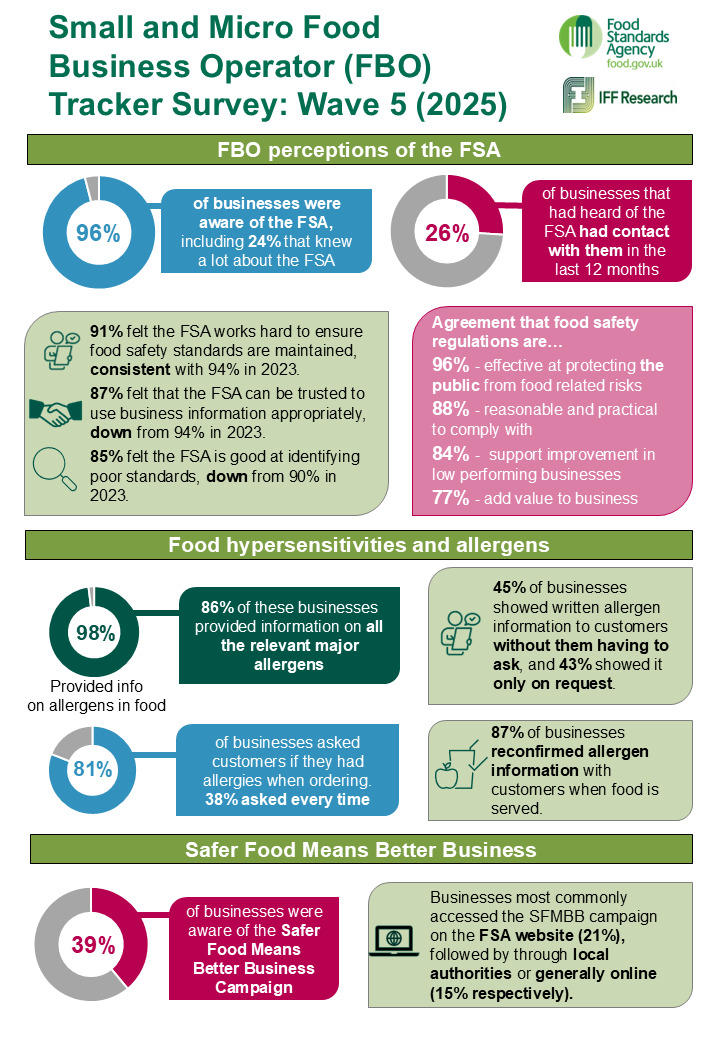
Infographic
Executive Summary
The Food Standards Agency (FSA) has run tracking research with small and micro Food Business Operators (FBOs) since 2018 to understand their experiences, perceptions of regulation and confidence in the food system. Wave 5 continues this series across England, Wales and Northern Ireland, with comparable research carried out separately in Scotland. The study explores how smaller food businesses view regulatory expectations, how they engage with the FSA and the external pressures that influence their operations. This report covers findings from FBOs in England, Wales, and Northern Ireland only; findings from Scottish FBOs are covered in a separate report published by Food Standards Scotland.
Interviews were conducted by IFF Research using a telephone methodology following cognitive testing and pilot work. Businesses were sampled across key sectors and sizes within scope, and the findings were weighted to reflect the wider population of small and micro FBOs.
Key findings
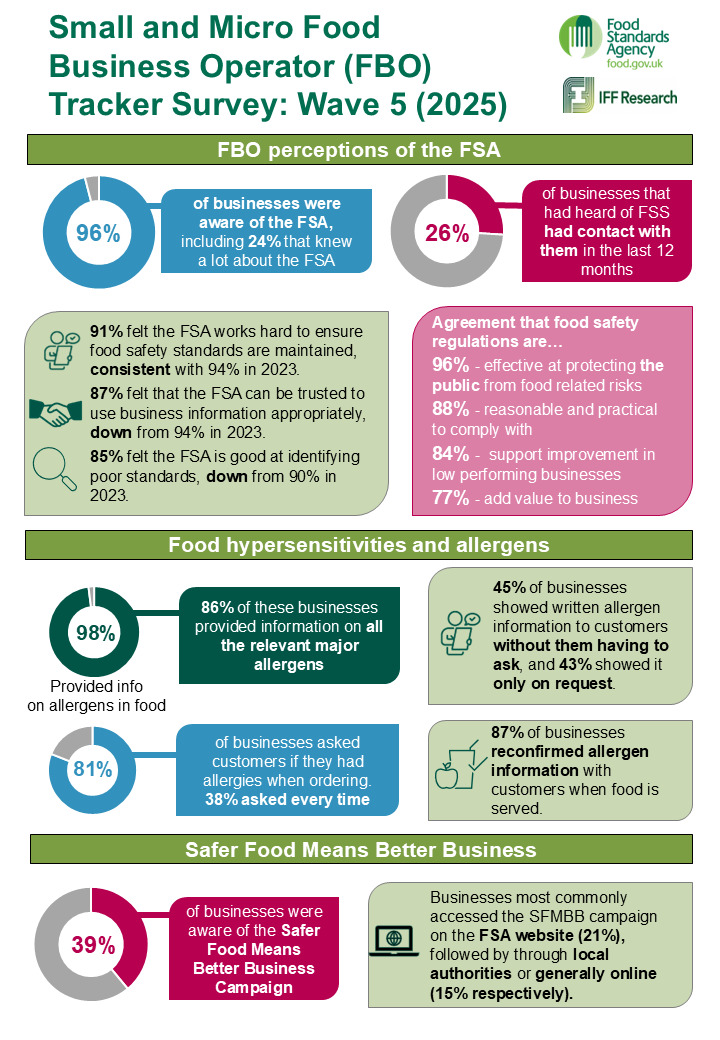
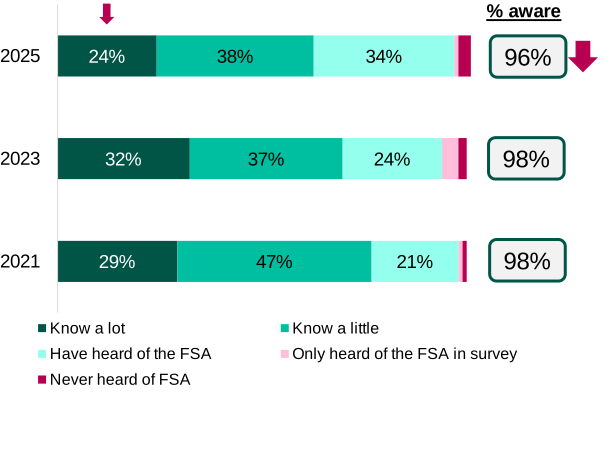
Most businesses were aware of the FSA (96%), however the proportion of those who reported knowing a lot about the FSA has decreased since 2023 (24% in 2025 vs 32% in 2023). Levels of engagement with the FSA have remained steady (26% any contact) and businesses that traded online have been more likely than others to visit the FSA website or seek information (online traders 38% vs 20% non-online).
Among those who had heard of the FSA, confidence in the FSA has remained strong overall, although small declines have appeared across several measures compared with the previous wave. For example, businesses continued to express high levels of trust in the organisation’s commitment to maintaining food safety and standards (91%), however there has been a decline in confidence in the FSA to use information provided by FBOs appropriately (87%, down from 94%). Agreement that the FSA’s communications had clarity of communication (81%), the FSA was approachable (80%) and that the FSA understands business needs (79%) were still high but again has declined when compared to previous waves (decreases of between 5% to 9%).
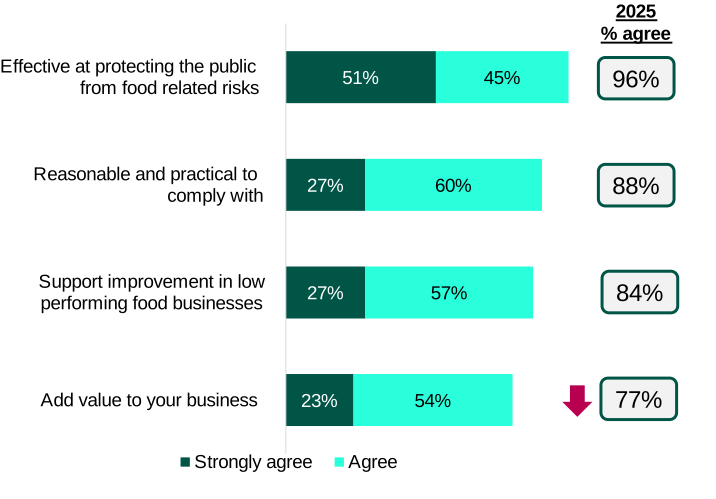
Most businesses felt well informed about the regulations that affected them (88%). Those producing or selling food on their premises were more likely than other business types to say they felt informed (95%). The FSA website remained the most common source of information (34%), with local authorities and suppliers also continuing to be important sources (27% and 15%). Most businesses continued to feel confident that food safety regulations are effective at protecting the public (96%) and that they are reasonable and practical (88%). The majority of businesses agree that regulations add value to their business (77%), however this has declined compared to previous waves (86% in 2023).
Businesses reported that their engagement with food safety processes has strengthened. Businesses also reported that inspection activity has risen (65% in 2025 vs 56% in 2023), and many businesses received advice or training from their local authority or district council (28%). A substantial proportion reported that they had written procedures in place for product recall or withdrawal (50%).
Allergen management was well established. Most businesses reported they had provided allergen information using both written and verbal methods (67%) and many had made use of the FSA tools for non-prepacked food (66%). Businesses also reported using a range of methods to train staff on food allergens (e.g., formal training for existing staff: 78%).
Businesses continued to face various operational pressures. Many had identified changes in customer behaviour linked to the cost-of-living situation as a significant challenge (67%). Concerns relating to inflation, interest rates and energy costs had eased slightly compared with the previous wave but had remained important (62%, 62% and 51% respectively). Recruitment pressures had persisted, particularly for roles that required specialist skills (32%), although levels had returned closer to those seen before 2023.
Digital engagement continued to increase. More businesses reported that they had their own websites (61%) and more had begun to use them to take orders (25%). Social media remained a common communication tool and a smaller number had used these platforms to take orders (9%). Use of third-party delivery platforms remained broadly stable (14%), with service-based businesses the most likely to engage with them (17%).
Awareness of the National Food Crime Unit remained limited (18%), similar to earlier years. Reported experiences of food crime had also remained stable, with the most common issues involving stolen (3%) or substituted food products (2%).
Micro businesses tended to be less engaged with the FSA website (micro businesses (23%); small businesses (37%)) and were less likely to report to have written guidance or procedures for recall or withdrawal (micro businesses (49%); small businesses (56%)). Small Businesses were more likely to report using online tools for training for food allergens (micro businesses (46%); small businesses (61%)). Differences by sector and nation remained relevant. Service based businesses had reported the strongest engagement with FSA guidance and tools (74% compared to overall average of 66%), while businesses in Northern Ireland had been less likely to access digital resources (e.g., 21% using FSA website compared to 25% average).
Conclusion
Wave 5 findings showed that small and micro FBOs had remained committed to maintaining food safety and continued to engage positively with regulatory expectations. Although confidence had declined in some areas, trust in the FSA’s core responsibilities had remained strong. Improving understanding of the FSA, increasing the visibility of guidance, and supporting digital engagement, would help to ensure that regulatory messages reached all types of business effectively.
Background and methodology
Background to the survey and research objectives
The Food Standards Agency (FSA) has been tracking small and micro Food Business Operator (FBO) attitudes towards food-related topics, and trust in the FSA and food system, since 2018. This has helped inform engagement and intervention activity targeted at businesses with fewer than 50 staff.
The survey was initially developed to assess the perceived impact of changes as a result of the UK’s exit from the European Union (EU), and the Achieving Business Compliance (ABC) programme, which aims to modernise the regulation of food businesses in England, Wales, and Northern Ireland. Since then, it has evolved to regularly track small and micro FBO views on a range of subjects.
This represents the fifth wave of the tracking survey, and covers the following aims:
-
To ‘unpack’ attitudes towards regulation and deepen insights and knowledge of small and micro enterprises
-
To measure trust in the FSA and extent to which FSA is considered a modern, accountable regulator
This report comprises results of the fifth wave of this now biennial tracking survey, with previous waves conducted in 2018, 2019, 2021, and 2023. Owing to the COVID-19 pandemic, the survey was not carried out in 2020 and from thereon, the survey became biennial.
In 2025, the tracking survey was extended to include Scottish FBOs, enabling Food Standards Scotland (FSS) to gather comparable insights under the same objectives. The findings specific to Scottish FBOs are presented in a separate report published by FSS.
Research methodology
Fieldwork was conducted by IFF Research, an independent research company. This began with a pilot phase in September 2025, in which the questionnaire was tested among a small subset of businesses, capturing 41 responses. Mainstage fieldwork followed throughout November via a Computer-Assisted Telephone Interviewing (CATI) methodology. In total, 700 interviews were completed with small (10-49 employees) and micro (less than 10 employees) FBOs; including 500 in England, 100 in Northern Ireland and 100 Wales. The interviews lasted 22 minutes on average.
The sample of businesses was sourced using a commercial sample provider (Market Location) and was randomly drawn using stratified country, size, Food Hygiene Rating Scheme (FHRS) rating, and sector targets. Screener questions at the start of the survey ensured that only in-scope businesses completed the survey. To be in scope, an FBO needed to have at least one site, have less than 49 employees, sell or serve and food products for human consumption in line with the approach taken since 2018. FBOs that were part of a franchise were also screened out of the survey. FBOs in Wales and Northern Ireland were over-sampled to ensure there was a robust sample for analysis in these nations. The wave 5 targets were the same as those used in Wave 4. These targets are shown in Table 1.
In line with the overall target, a total of 700 small and micro FBOs in England, Northern Ireland and Wales were surveyed. The final profile of completed interviews for Wave 5 is shown in Table 2 below:
In line with previous waves, the data was weighted to be representative of the micro and small FBO population across England, Northern Ireland, and Wales at the time of sampling. IFF Research obtained information on the underlying population of businesses eligible for the tracker in terms of sector and size from NOMIS on 24 July 2025. The most recent business population data available was filtered on small and micro FBOs (i.e., less than 50 employees) operating in England, Northern Ireland and Wales and sectors in-scope for the research (using the UK Standard Industrial Classification (SIC)).[1]
Once eligible business population counts had been obtained, the incidence of Food Hygiene Rating Scheme (FHRS) ratings in England, Northern Ireland and Wales was applied to derive the number of eligible businesses in rating groupings.
For more detail on the research methodology, including sampling, weighting, analysis and limitations, please see the Technical Report in Annex A.
Notes on the report
Throughout the report references to business size are based on number of employees, with small businesses defined as those with 10–49 employees, and micro businesses as those with fewer than 10 employees.
The term ‘service activities’ is used throughout the report as shorthand for the ‘food and beverage service activities’ sector. This sector incorporates restaurants, cafes, pubs, and other catering businesses.
When percentages are provided in the text for sub-groups such as by size and sector, the sub-group percentage shown is statistically significantly different to the average of those not in this sub-group, at the 95% confidence level. The phrasing “most likely”, “more likely than average” or “particularly likely” etc. is used as a shorthand for this. All differences reported are statistically significant unless otherwise stated.
Unless explicitly noted, all findings are based on weighted data. Unweighted bases (the number of responses from which the findings are derived) are displayed on tables and charts as appropriate, to give an indication of the robustness of results.
It should be noted that where the base size for a subgroup is lower than 100, statistical significance is not reported. In some instances, when questions are routed to a subset of respondents and the base size is lower than 100, results are reported in a as unweighted counts rather than statistically tested percentages (e.g. 20 out of 60 businesses).
On charts, arrows are typically used to denote a significant difference between 2025 and 2023 findings. Please note that results may not always sum to 100% due to rounding and/or due to businesses being able to select more than one answer to a question.
Research Limitations
While not uncommon in research of this kind, both FSA and FSS surveys achieved relatively low response rates (7% and 5% respectively), which raises some risk of non-response bias whereby those who participated may differ from non-participants in their attitudes, behaviours, or level of engagement with the subject matter. Weighting has been applied to both datasets to improve representativeness and address this risk, and findings should be interpreted with this context in mind.
Similarly, as with all self-completion surveys, findings are subject to self-report limitations. Respondents’ answers reflect their own perceptions and recollections, and where questions relate to compliance with legal requirements (such as allergen labelling) or adherence to best practice, responses may be influenced by social desirability bias. Respondents may be inclined to report more favourable behaviours than are reflected in practice, which should be borne in mind when interpreting findings in these areas.
Finally, subgroup findings throughout the report should be interpreted with care. Minimum base sizes of 100 (FSA survey) and 50 (FSS survey) have been applied and estimates at or near these thresholds are subject to greater sampling error and are less statistically stable. Differences between subgroups should not be over-interpreted, and where they are discussed, they are intended to indicate broad directional patterns rather than precise estimates.
Experiences and perceptions of the FSA
This chapter covers awareness and knowledge of the FSA and businesses’ contact with them over the past 12 months. It examines how small and micro businesses rate these interactions in terms of trustworthiness, ease, approachability, and clarity, and explores their confidence in the FSA to deliver effectively across key areas of food safety and standards. The chapter will also explore perceptions of food standards and regulations.
Awareness and knowledge of the FSA
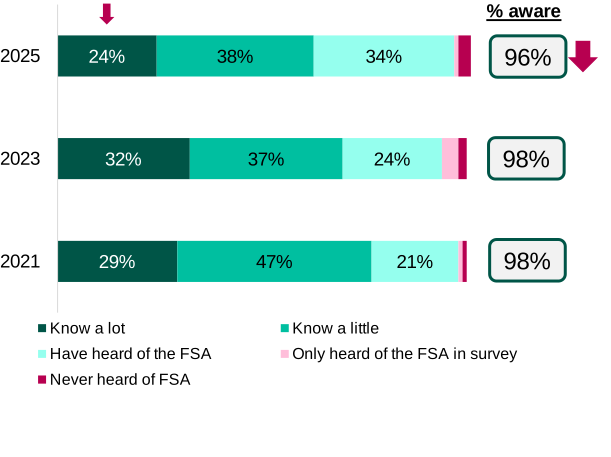
Almost all FBOs were aware of the FSA (96%), a slight decrease from the 98% in 2023 and 2021 as shown in Figure 1. Just under two thirds (62%) knew something about the FSA, falling from 69% in 2023 as a result of fewer businesses reporting that they knew a lot about the FSA in 2025 compared to 2023 (24% vs 32%). Businesses that trade online were more likely to report knowing a lot about the FSA (30% vs 22% of those that do not trade online).
Contact with the FSA
Those who had heard of the FSA were asked whether they had had any interactions or contact with the FSA in the last 12 months. Just over one quarter of the 96% of businesses who were aware of the FSA had some form of contact with them in the last 12 months (26%), in line with 2023 (30%). Businesses that trade online were more likely to report any contact with the FSA (39%), compared to those that do not trade online (21%). There were also differences by business size, with micro businesses less likely to report any contact with the FSA (24%), compared to small businesses (38%).
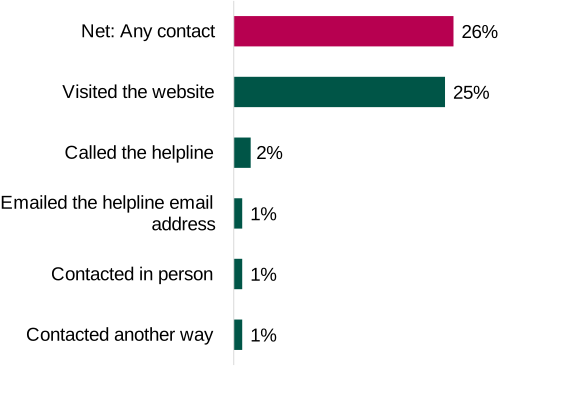
As shown in Figure 2, businesses were then asked through which channel they had been in contact with the FSA. The most common form of communication was visiting the FSA’s website (25%). Only 3% of businesses that had heard of the FSA said they had called the helpline or emailed the helpline email address.
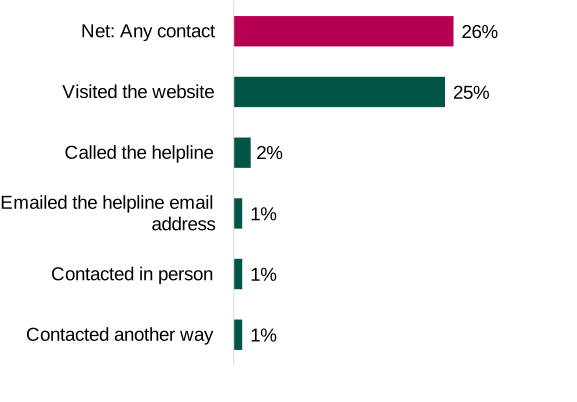
Small businesses were more likely to have visited the FSA’s website (37% vs 23% of micro businesses), as were those that trade online (38% vs 20% of those that do not trade online).
Ratings of contact with the FSA
Businesses that had contacted the FSA were asked to rate the FSA based on their experiences. Most businesses rated the FSA highly for ease of use or access (93%) and trustworthiness (89%), in line with 2023 (95% and 93% respectively). The FSA were also given high ratings of clarity of communication (81%) and approachability (80%), although these had declined compared to 2023 (92% and 91% respectively).
Confidence in the FSA
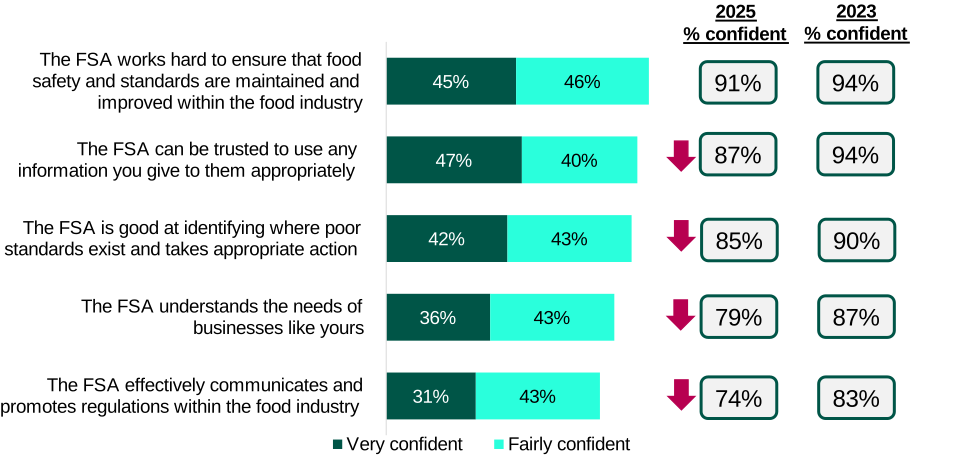
Businesses that had heard of the FSA were asked to rate their confidence that FSA are achieving certain goals. Overall confidence in 2025 was high, however confidence in 4 out of 5 statements had declined compared to 2023.
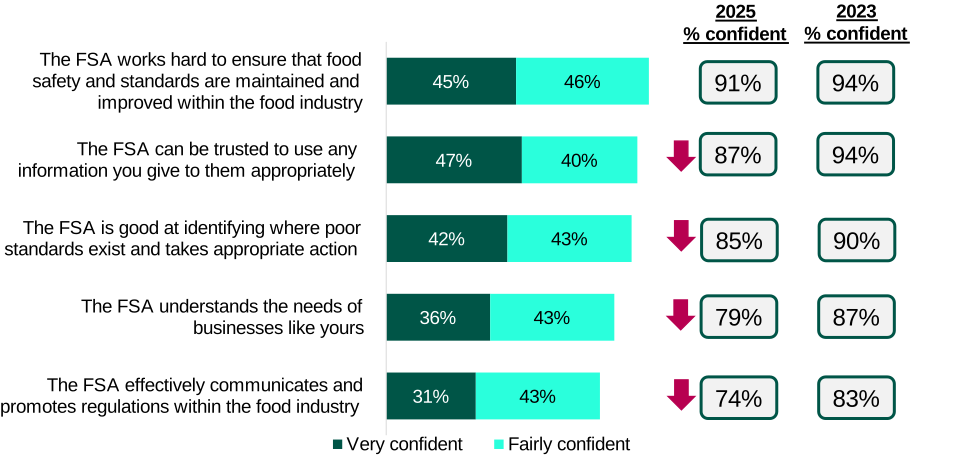
As shown in Figure 3, most businesses were confident that the FSA works hard to ensure that food safety and standards are maintained and improved (91%), comparable to in 2023 (94%). Businesses with an FHRS rating of 0-3 were most likely to be very confident that the FSA works hard to ensure food safety and standards are maintained and improved (59%), compared to those with a higher FHRS rating (33% of businesses rated 4 and 48% of businesses rated 5).
Most FBOs (87%) were confident the FSA can be trusted to use any information they give them appropriately, down from 94% in 2023.
Most businesses (85%) were confident that the FSA is good at identifying where poor standards exist and takes appropriate action, down from 90% in 2023.
Eight-in-ten businesses were confident that the FSA understands the needs of businesses like theirs (79%), down from 87% in 2023.
Three-quarters of businesses (74%) were confident that the FSA effectively communicates and promotes regulations within the food industry, down from 83% in 2023.
Confidence in food safety standards and regulations
Businesses were asked the extent to which they agreed with a series of statements regarding food safety or hygiene standards and regulations, as shown in Figure 4. Almost all businesses (96%) agreed that food safety regulations are effective at protecting the public from food related risks, consistent with 2023. Most businesses also agreed that the regulations are reasonable and practical to comply with (88%) and that they support improvement in low performing food businesses (84%). These were new or revised options for 2025 meaning that a comparison cannot be drawn to 2023. However, the proportion of businesses that felt food safety standards and regulations add value to their business had declined (77% vs 86% in 2023).
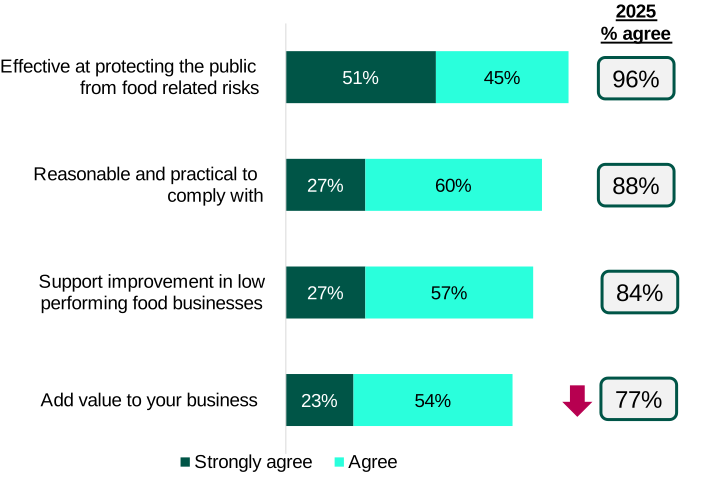
All businesses in Northern Ireland were confident that regulations are effective at protecting the public from food related risks, compared to 96% of businesses in England and 92% in Wales. Businesses in Northern Ireland were also more likely to agree that regulations support improvement in low performing businesses (95% vs 84% in England and 83% in Wales), and that they add value to their business (89% vs 77% in England and 75% in Wales). Confidence in regulations being reasonable and practical to comply with was highest among small businesses (93% vs 87% of micro businesses) and those in the food and beverage service sector (91%).
Information and communication
This chapter investigates how informed businesses feel about all regulations affecting them, and the most commonly used sources of information on food safety guidelines and regulations. It will also examine levels of engagement with the FSA news and alerts service, the ‘Safer Food Means Better Business’ campaign and explore how businesses encourage customers to make healthier choices.
How informed businesses feel about regulations affecting their business
All businesses were asked how well informed they feel about regulations that affect their food business overall. It is important to note that all survey respondents identified themselves as the person in the business primarily responsible for food safety and therefore they were likely to be typically more informed about regulations than other staff members.
The majority of respondents (88%) felt either very or quite well informed about regulations affecting their business. Businesses that produced and sold on premises were more likely to feel informed (95%) than other groups, and, to a lesser extent, so were businesses that packaged on premises or sold as a meal/takeaway (91% and 90% respectively).
The most common reasons businesses reported not feeling informed about regulations included: they did not feel that the regulations were applicable to their business, they have not received information directly, and a lack of contact from regulators.
Sources of information about food safety
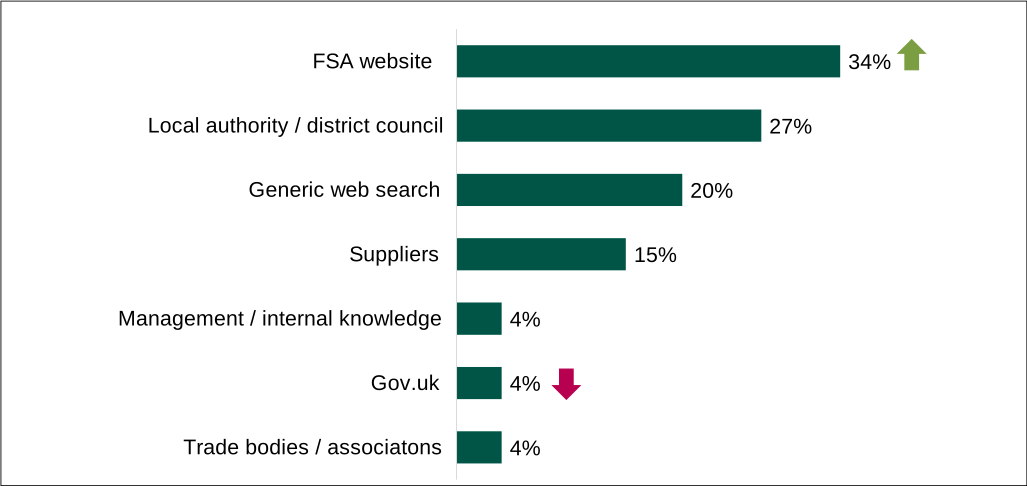
Businesses were asked where they get information about food safety guidelines and regulations, food allergies and product recalls, as shown in Figure 5. Almost all (96%) cited at least one source, most commonly the FSA website (34%) or the local authority or district council (26%). Since 2023, more businesses reported using the FSA website (34% from 28%), similar to the proportion in 2021 (37%). However, less businesses have reported using the Gov.uk website for getting information about food safety guidelines and regulations since 2023 (4% from 8%).
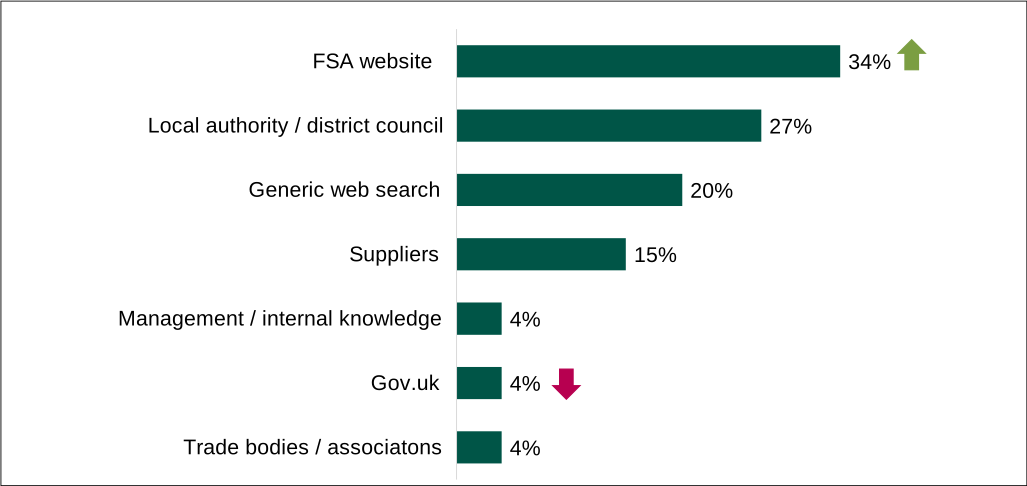
Sources of information about food safety guidelines and regulations varied by business type. Those in the retail sector were less likely to use the FSA website than other sectors (20%), but more likely to get information from suppliers (25%). Those in the service activities sector were most likely to get information from the FSA website (41%), and more likely to get information from a generic web search (24%), but less likely to get information from suppliers (10%) than other sectors.
Use of the FSA website also varied by size, with half of small businesses using the FSA website (50%), compared to 31% of micro businesses, suggesting scope to raise awareness and engagement with the website among micro businesses. Businesses with a Food Hygiene Rating of 5 were more likely to get information from their Local Authority/District Council (32%) compared to the average across all other ratings.
Variation was also seen by country, particularly in the use of local authorities and district councils as a source of information. These were cited by 45% of businesses in Northern Ireland (down from 59% in 2023), but only 33% of businesses in Wales and 35% of businesses in England (up from 25% in 2023). As in 2023, businesses in Northern Ireland were less likely than those in England or Wales to use the FSA website (21% vs. 35% and 33% respectively). Businesses in England were more likely to get their information from generic web search (21%) than those in Northern Ireland or Wales (8% and 11% respectively).
Subscription to FSA news and alerts service
Businesses were asked if they currently subscribe to FSA news and alerts service. Almost one-in-five businesses subscribed (18%). In Retail businesses were the sector least likely to be subscribed (10%). Subscriptions were also less common in micro businesses, with three-quarters of micro businesses reporting not being subscribed (75% vs 61% of small businesses).
Awareness of the FSA’s ‘Safer Food Means Better Business’ campaign
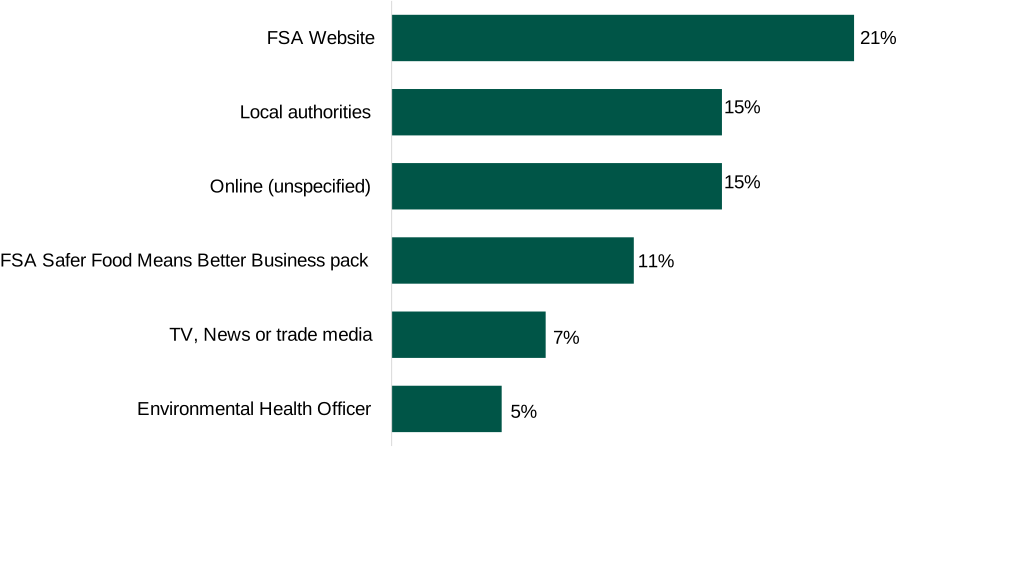
Businesses were asked if they had seen the FSA’s ‘Safer Food Means Better Business’ (SFMBB) campaign and if so, where they had seen it. Over a third of businesses reported seeing the SFMBB campaign (39%), with nearly half of businesses in the service activities sector having seen it (48%). Businesses in England were the most likely to have seen the campaign, compared to other nations (40% vs 25% in NI and 31% in Wales).
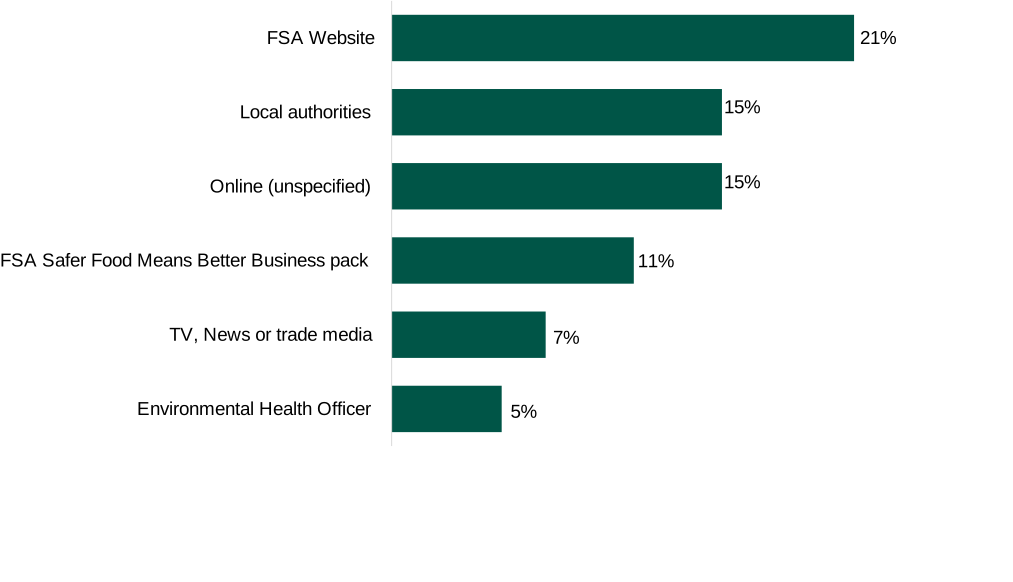
Figure 6 shows were businesses reported seeing the SFMBB campaign. The most common place that businesses reported seeing the SFMBB campaign was on the FSA website (21%), followed by local authorities and online (unspecified) (15% for both).
Encouraging customers to make healthier choices
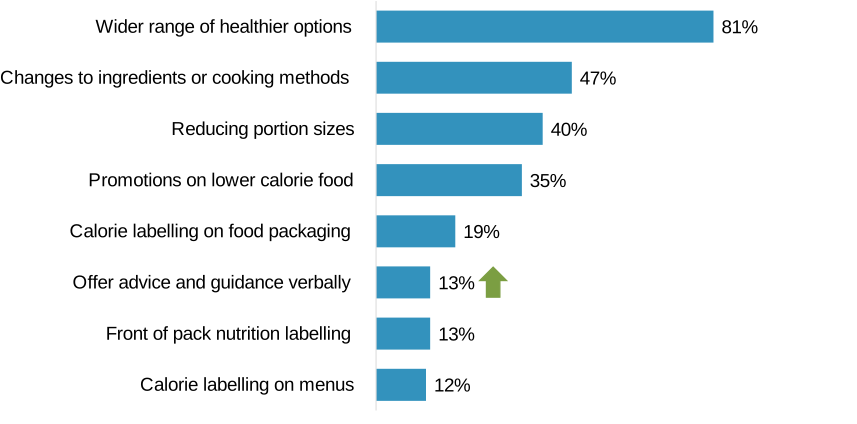
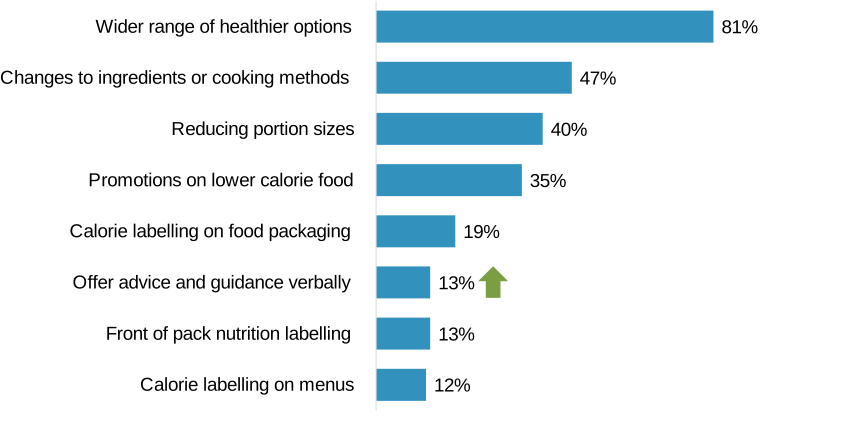
All businesses except wholesalers were asked what steps they had taken to help customers make healthier choices, and almost half (44%) of these businesses had taken steps to help customers make healthier choices in the last 12 months. As shown in Figure 7, the most common step was providing a wider range of healthier options (81%). This was followed by changes to ingredients or cooking methods (47%) and reducing portion sizes (40%). Businesses in the service activities sector were more likely than other sectors to have taken these three steps (85%, 60% and 48% respectively). In 2025, businesses were more likely to offer advice and guidance verbally compared to 2023 (13% vs 5%).
Business experience of food safety processes and interventions
This chapter covers businesses’ experience of interventions undertaken in relation to food hygiene and food safety, and the clarity of communication relating to these events. It goes on to explore the mechanisms they have in place to respond to recall or withdrawal requests, including training procedures, and use of the FSA template guidance.
Experience of food safety processes and interventions
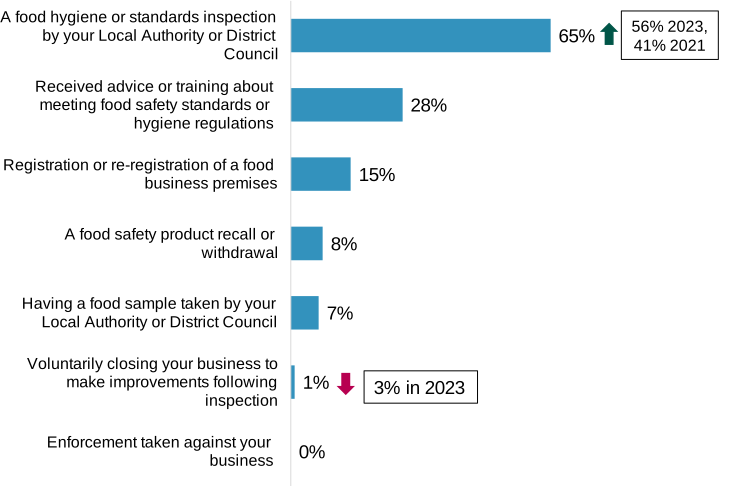
As shown in Figure 8, around two thirds of businesses (65%) said they had received an inspection by their local authority (or in Northern Ireland, by their District Council) in the last 12 months, a significant increase on the 56% recorded in 2023. This continues a general upward trend over the last 4 years, having risen from 41% in 2021. In line with 2023, more than a quarter (28%) had received advice or training about meeting food safety standards or hygiene regulations, and 15% had registered or re-registered a food business premises.
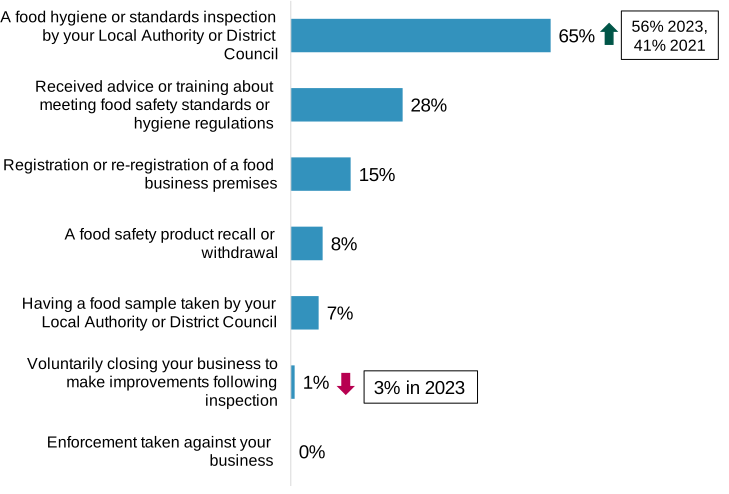
As was the case in 2023, businesses with an FHRS rating of 0 to 3 were more likely than average to report having had an inspection (89%) or to have received advice or training about meeting food safety standards or hygiene regulations (41%). Similarly, those in the service activities sector, and small FBOs were more likely to have had an inspection (71% and 79% respectively).
FBOs in Northern Ireland were more likely than average to report having had a sample taken by their District Council (29% compared to 6% in England and 10% in Wales), or to have received advice or training about meeting food safety standards or hygiene regulations (40% compared to 28% in England and 22% in Wales).
Businesses interactions with Local Authorities or District Councils
All businesses were asked whether they were aware all food businesses, including online businesses, need to be registered with the Local Authority or District Council. Nearly all businesses were aware (93%), which remained unchanged from 2023. Businesses that felt well informed about food regulations were more likely than those who were not informed to be aware (94% vs 89% respectively).
Businesses that were aware they needed to be registered were asked whether they registered using the online or paper form. Just over a third (37%) used the paper form to register, around a third registered online (32%) and another third did not know (31%). As seen in 2023, businesses in Northern Ireland were more likely than average to use the paper form (50%). Businesses that traded online were more likely than average to use the online form (40%) as were businesses in England (33%).
After businesses had registered, just under half received any guidance information (49%), falling from 56% in 2023. A slightly smaller proportion had received an advisory visit (44%) or received a visit within one month of starting to trade (36%). Only 13% of businesses experienced none of those.
Written procedures
Half of businesses (50%) reported having written procedures in place for managing a recall or withdrawal. This proportion is broadly consistent with previous years, compared with 54% in 2023 and 51% in 2021.
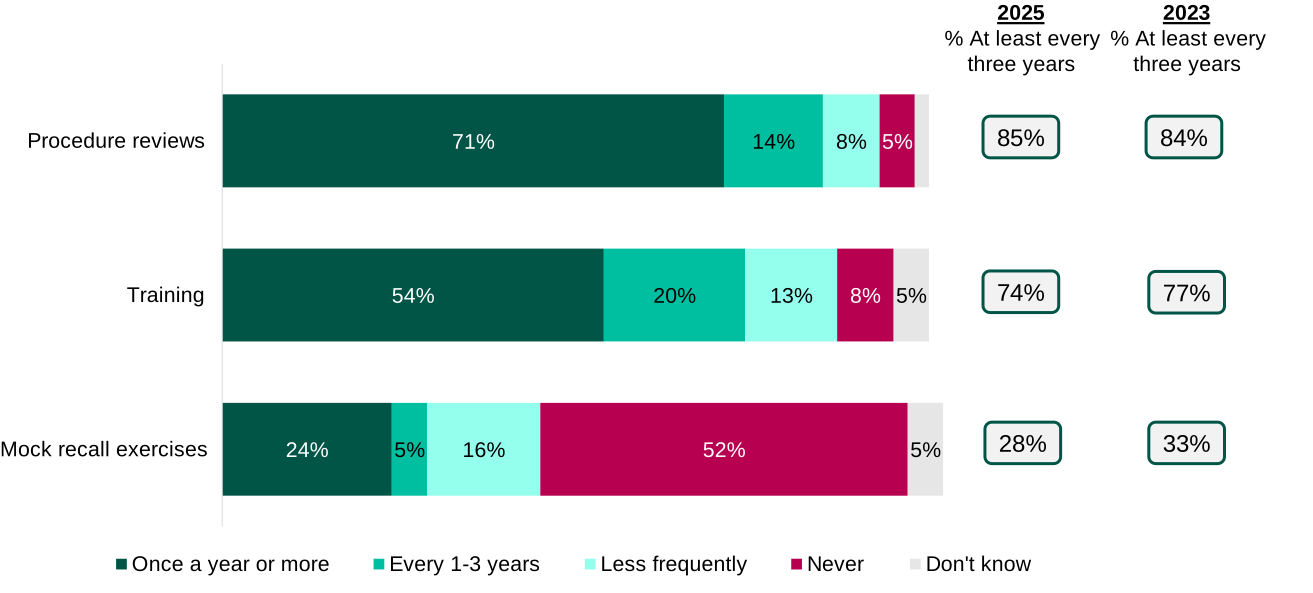
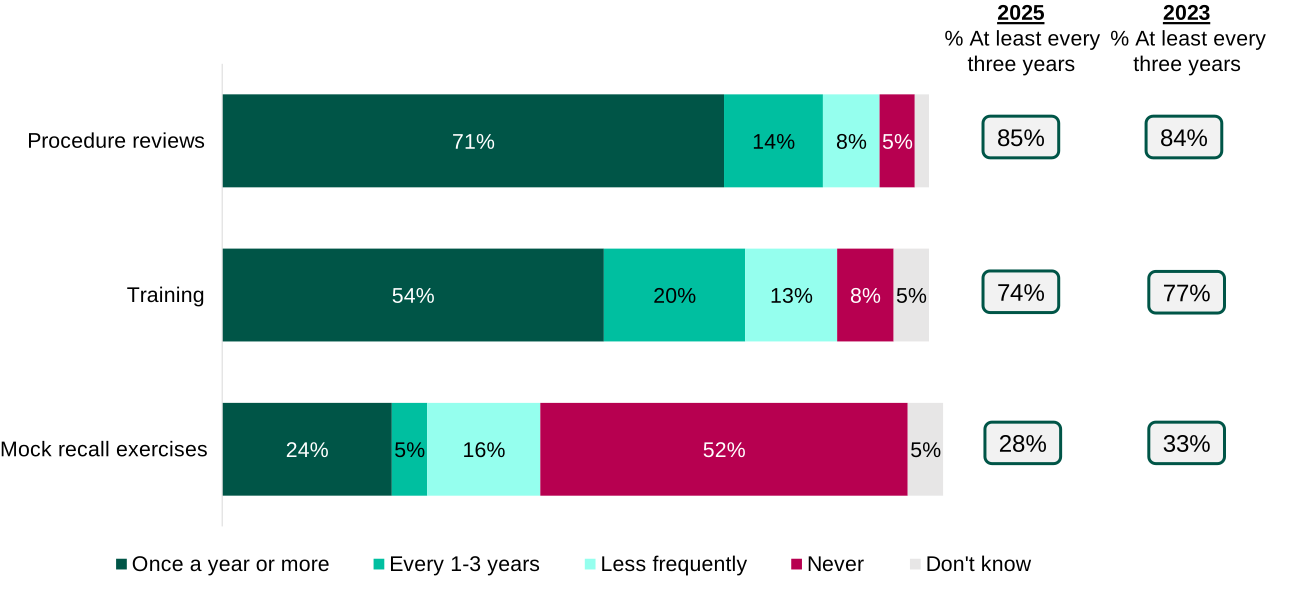
As Figure 9 shows, businesses with written procedures in place were most likely to conduct procedure reviews at least every three years (85%). Over three-quarters of businesses with written procedures in place also conducted training at least every three years (74%). Businesses were least likely to conduct mock recall exercises, with less than a third (28%) conducting them at least every three years and two thirds (67%) never doing so.
Point of sale notices
Retailers and businesses selling food directly to the public were asked how they would describe their approach to displaying point of sale notices for a recall or withdrawal. The most common way that businesses displayed Point of Sale Notices was at the till or point of sale signage (24%). A quarter of businesses said it was not applicable to them, or they’d never needed to (24%) whilst 16% said they used external signage and 14% said they removed the products from sale. A small proportion of these businesses (4%) said they did not have an approach in place.
Awareness of FSA guidance
Just over a third (36%) had heard of the FSA’s online guidance and templates for dealing with recalls and withdrawals, while six in ten (61%) had not heard of the online guidance. Small business were more likely to be aware of the online guidance and templates compared to micro businesses (44% compared to 35% respectively).
Food hypersensitivities and provision of allergen information
This chapter explores how businesses that sell food as a meal or a takeaway (or otherwise packaged at point of sale) manage allergen risks and communicate with customers. It covers the provision and type of allergen information, whether it is proactively displayed or given on request, and practices for checking and reconfirming allergy requirements during ordering and service. The chapter also examines awareness and use of guidance and tools, and methods of staff training on allergens.
This majority of the questions presented in this section on food hypersensitivities and provision of allergen information were not asked in 2023, meaning there is no comparison drawn between waves. Unless otherwise stated, questions in this section were asked to businesses selling food as a meal, takeaway, or otherwise packaged at point of sale.
Written or verbal allergen information
Businesses were asked whether they provide any written or verbal allergen information to customers or others to whom they supply food. Almost all (98%) reported providing allergen information.
Two-thirds of these businesses (67%) delivered allergen information through both written and verbal channels. A quarter (25%) relied solely on written information, while 7% communicated allergen information only verbally.
Small businesses were more likely than micro businesses to offer information in both written and verbal formats (78% compared with 64%). Conversely, micro businesses were more likely to provide written allergen information only (28% versus 13%).
Businesses that provided written allergen information to customers were asked whether this information was made available without customers needing to request it. Just under half (45%) reported that written allergen information is proactively displayed to customers, while a similar proportion (43%) said it is provided only upon request. The remaining 11% indicated that their approach varies.
Micro FBOs were significantly more likely than Small FBOs to display allergen information without being asked (49% compared with 28%). Businesses operating within the service activities sector were more likely to provide allergen information only when requested by customers (49%), compared to other business types.
Allergies covered
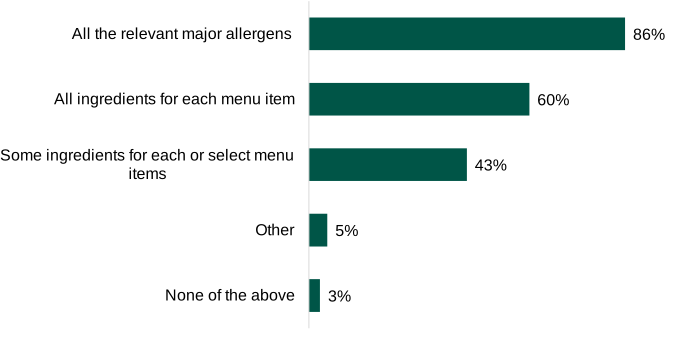
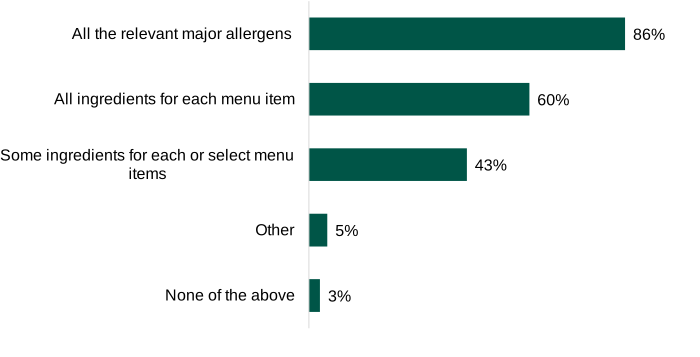
Most businesses (86%) that provided information on allergens, said they provided information on all the relevant major allergens present in menu items. Six in ten businesses (60%) reported offering full ingredient lists for each menu item.
A smaller proportion (43%) said they provide information on only some ingredients or only for selected menu items, such as highlighting nuts or gluten but not all allergens. Just 3% reported that they provided none of the listed types of allergen information in Figure 10.
Frequency of asking about allergies
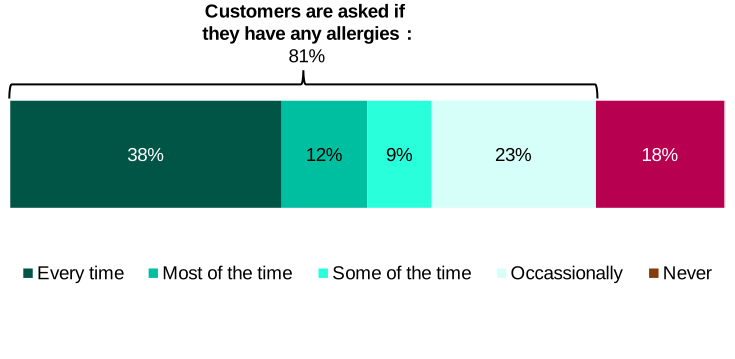
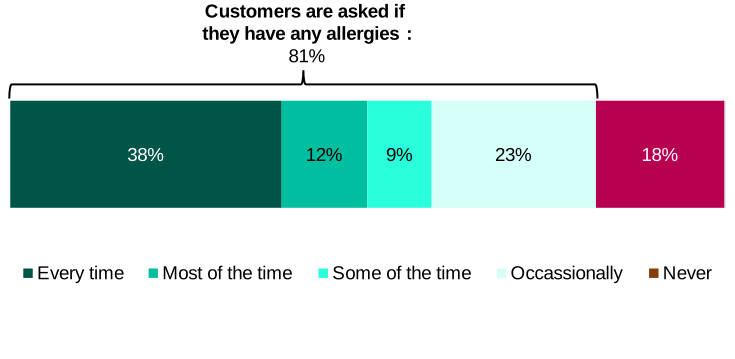
Most businesses (81%) reported asking customers about allergies when they were ordering food, as shown in Figure 11. This includes around two-fifths (38%) that ask every time, 12% that ask most of the time, 9% that ask some of the time and just under a quarter (23%) that ask occasionally. In contrast, nearly a fifth (18%) of these businesses reported that they never ask customers whether they have any allergies when they are ordering food. Small FBOs were much more likely to ask customers every time they ordered food when compared to Micro FBOs (62% vs 31% respectively).
Businesses were also asked whether allergen information is reconfirmed with customers when their food is served, in the case that a person has made their allergen requirement known.
The majority (87%) reported reconfirming allergen information in some form. Most commonly, this was done verbally by staff (79%). Smaller proportions used labels, flags or stickers to identify allergen-safe items (22%) or served the customer’s food separately (2%). However, one in ten (12%) of these businesses said they do not reconfirm allergen information at the point of service.
FSA tools for non-prepackaged food
In 2025, the FSA published best practice guidance to support food businesses in providing clear, accessible, and reliable allergen information for non-prepacked foods. This guidance sets out recommended approaches for presenting written information and engaging with customers, and includes practical tools (such as templates, icons and allergen matrices) to support businesses in implementation.
Businesses were asked if they had heard of this guidance (before having been asked about it in the survey). Two-fifths (40%) had heard of the guidance, while 56% hadn’t, and 4% were unsure. Those rated 0-3 were more likely to have seen the guidance than average (51%).
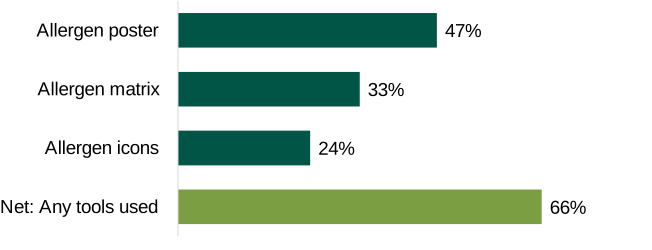
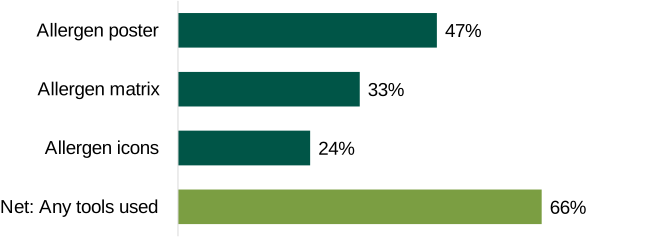
When asked if they had used any of the tools published as part of this guidance, two-thirds of businesses (66%) reported having used at least one of the allergen communication tools provided. The most commonly used were allergen posters (47%), followed by allergen matrices (33%) and allergen icons (24%), as shown in Figure 12. Businesses more likely to have used any of the FSA’s tools included those in the food and beverage service sector (74%), and those with a FHRS rating of 0-3 (77%).
Over a quarter of businesses (28%) said they had not use any of these tools, and a further 6% were unsure.
How staff are provided with information and training
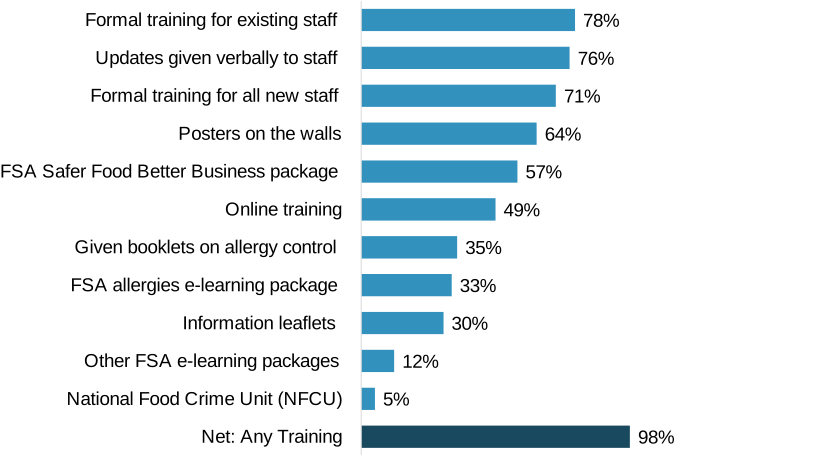
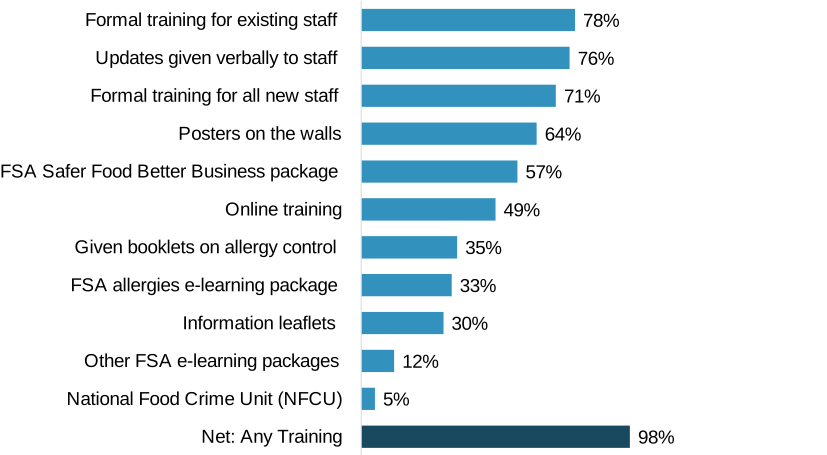
Almost all businesses (98%) reported using at least one method to train or inform staff on food allergens. The most common approaches were formal training for existing staff (78%) and verbal updates provided during work (76%). A large proportion also offered formal training for all new staff (71%) and displayed posters on allergen control within the workplace (64%).
Over half of businesses used the FSA’s Safer Food Means Better Business package (57%), and around half made use of online training from either their own organisation or an external provider (49%). Other resources were less widely used, including booklets on allergy control (35%), the FSA allergies e-learning package (33%), and information leaflets (30%). Only small minorities engaged with other FSA e-learning packages (12%), the National Food Crime Unit (5%), or additional online resources and local council information. Very few businesses reported using none of the listed training or information sources (2%).
Barriers facing businesses
This chapter will present the proportion of businesses that were facing barriers to their business and what these barriers were. It will examine the list of concerns or threats posed to businesses in the survey and compare them to last wave. Lastly, it will examine the types of staff that businesses are struggling to recruit and how this compares to last wave.
Barriers facing businesses
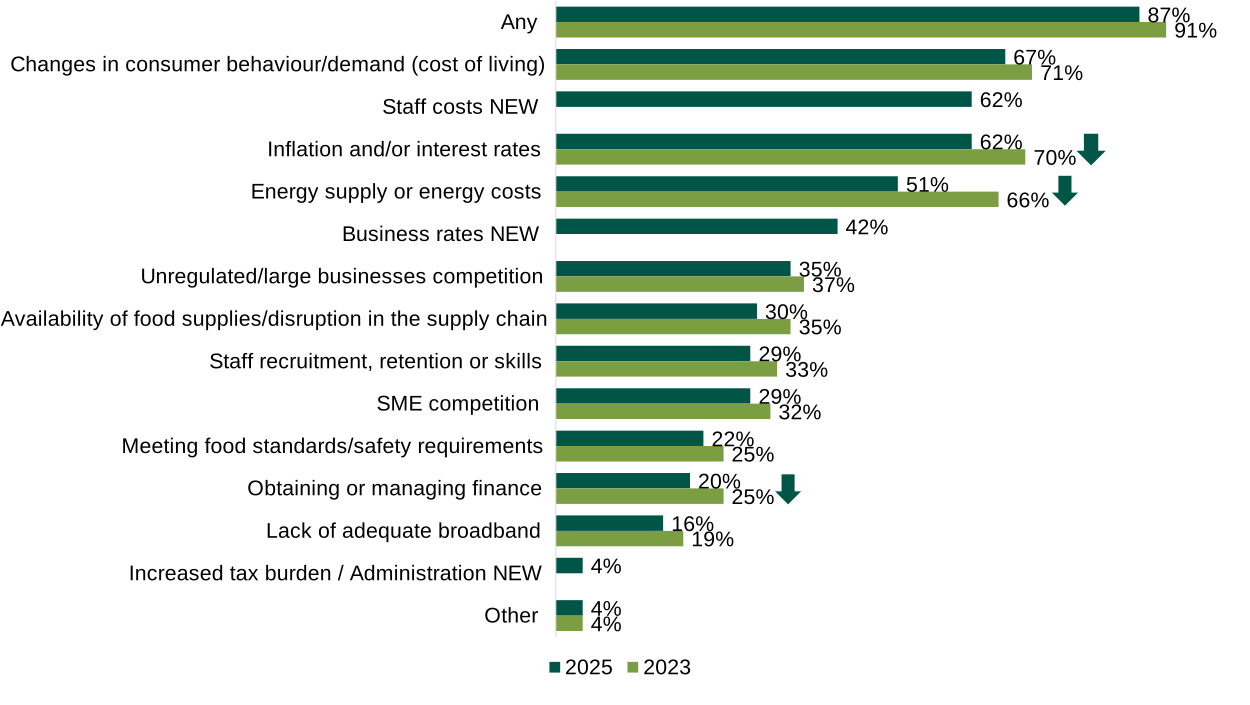
Businesses were presented with a list of potential threats, concerns and barriers to the success of their business and were asked to select which they felt applied to them. As seen in Figure 14, most businesses (87%) said at least one of the listed threats, concerns or barriers applied to their business, a decrease from 91% in 2023 and return to levels in 2021 (86%). The most common barrier in 2025 was changes in consumer behaviour and demand due to the increased cost of living (67%), followed by staff costs and high inflation or increased interest rates (62% for both). Changes in consumer behaviour due to cost of living was also the most common barrier in 2023 (71%). In 2025, FBOs were less concerned about high inflation and interest rates (62% compared to 70% in 2023), high energy costs (51% compared to 66% in 2023) and obtaining or managing finances (20% compared to 25% in 2023).
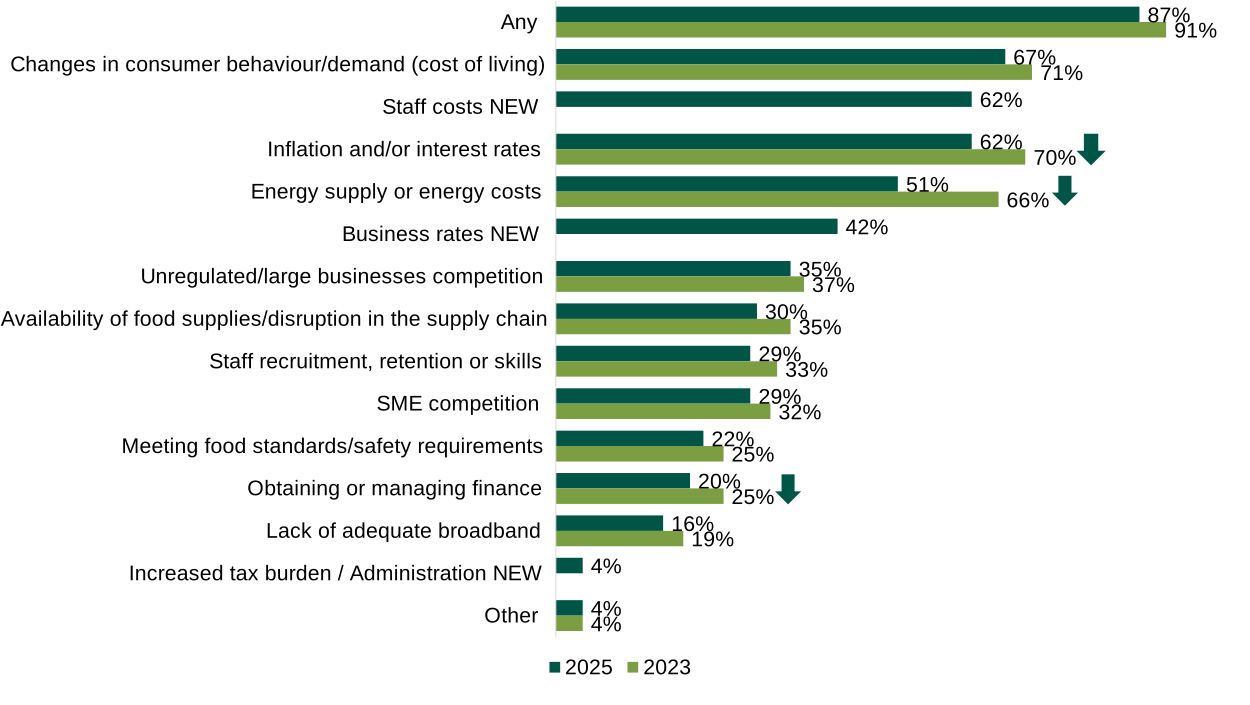
Service activities businesses more frequently stated that changes in consumer behaviour and staff costs (72% for both) applied to them, as well as energy costs and business rates (58% and 50% respectively), compared to any other group.
Small FBOs were more likely than micro FBOs to report that the following concerns, threats or barriers were applicable to them: staff costs (71% vs 61%), business rates (58% vs 39%), and staff recruitment, retention or skills (36% vs 28%).
There were also differences by nation, with FBOs in Northern Ireland more likely to report that concerns around business rates (57%) and staff recruitment, retention or skills (40%), were applicable to their businesses compared to other nations. Businesses in Wales were less likely say that the availability of food supplies/disruption to the supply chain (21%) was a concern, threat or barrier to them when compared to other nations.
Recruitment issues
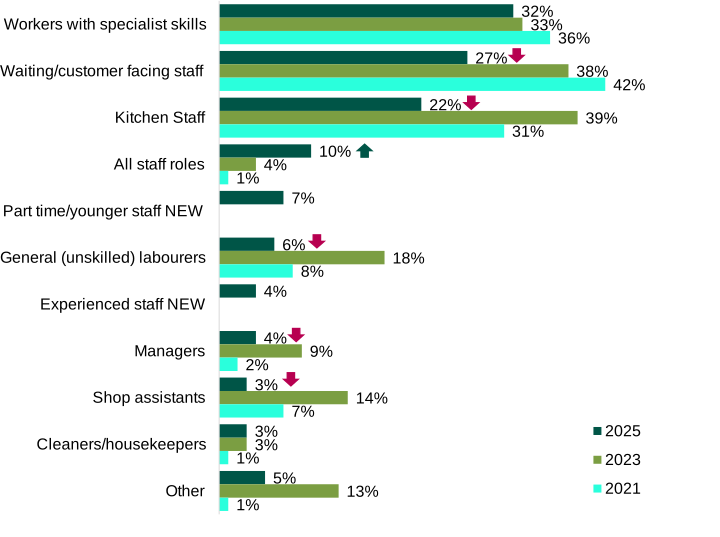
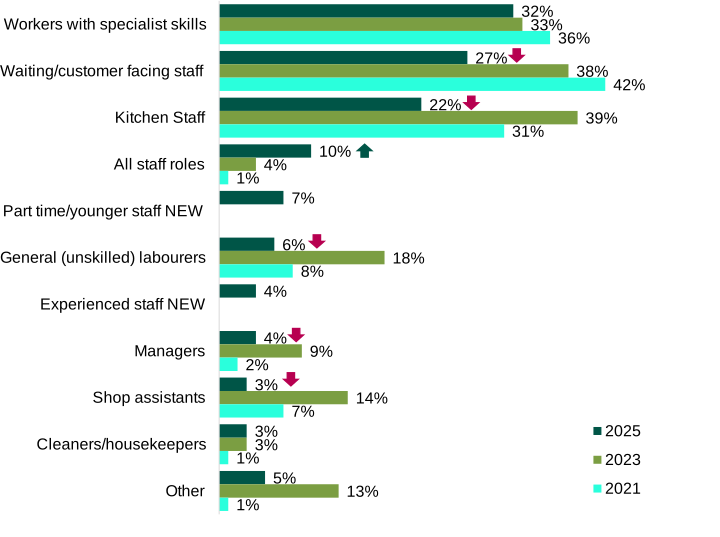
Almost a third (29%) of FBOs cited staffing as a concern, threat or barrier, in line with 2023 (33%). These businesses were asked to specify which types of staff they were struggling to recruit, as seen in Figure 15. Consistent with previous waves, the most commonly cited roles that businesses struggled to recruit for were workers with specialist skills (32%), waiting staff (27%) and kitchen staff (22%). However, difficulties recruiting waiting staff and kitchen staff were less frequently reported compared to 2023 (38% and 39% respectively).
For other less commonly cited roles, FBOs reported less issues with recruitment than in 2023, with many returning to 2021 levels. For example: general labourers (2025: 6%; 2023: 18%; 2021: 8%), managers (2025: 4%; 2023: 9%; 2021: 2%), and shop assistants (2025: 3%; 2023: 14%; 2021: 7%). However, businesses were more likely to struggle to recruit all staff roles this wave (2025: 10%; 2023: 4%; 2021: 1%).
Online sales and the use of third-party platforms
This chapter outlines the online presence of companies and how they use their own website, social media, and third-party platforms when taking orders for food. It examines whether FBOs have a website, use a third-party website, or social media to take orders.
Companies use of their own website
Over three in five businesses had a website (61%), an increase from 53% in 2023. Most small businesses had a website (85%), compared to less than six-in-ten micro businesses (56%). Whether businesses had a website also varied by nation, with almost two-thirds (62%) of businesses in England having a website, compared to half of businesses (49%) in Wales and four-in-ten (40%) in Northern Ireland.
FBOs were asked whether they used their website to take food orders. In 2025, 25% of businesses reported they used their website to take food orders, an increase from 14% in 2023.
Businesses’ use of social media
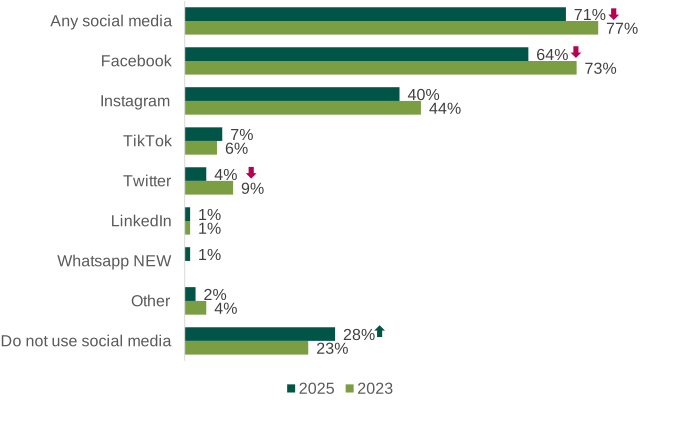
All businesses were asked which, if any, social media accounts their business used. In 2025, seven-in-ten (71%) businesses had some form of social media presence, the same as the level in 2021 but a decrease from 77% in 2023. As shown in Figure 16, the most common social media accounts in 2025 were Facebook (64%) and Instagram (40%). However, the proportion of businesses with a Facebook account was less than in 2023 (73%).
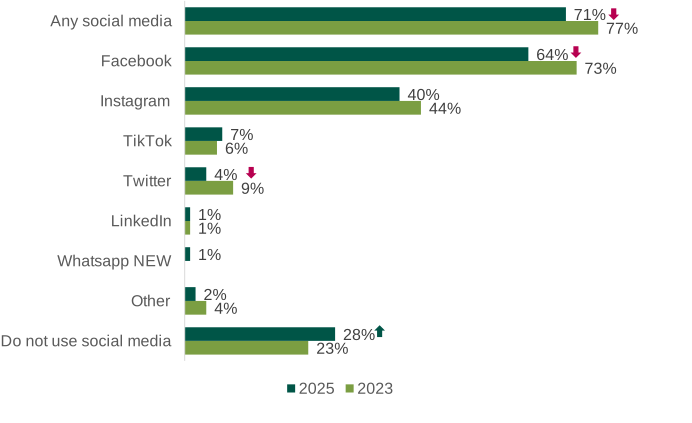
Service activities businesses were the most likely to have any social media account (76%) compared to other sectors. Small businesses were also more likely to have any social media account compared to micro businesses (84% vs 68%).
Businesses’ use of social media to take orders
Almost a tenth (9%) of businesses said they used their social media accounts to take orders, while the majority did not (91%). This is in line with 2023 when 13% took orders through social media accounts. Businesses that did take orders through social media mostly did so through Facebook (8% of those with a social media account). Use of social media accounts to take orders was more common in micro businesses compared to small businesses (10% vs 3%).
The use of third-party platforms
Businesses were asked what third-party platforms, if any, they use to sell food products. In 2025, 14% of businesses used third-party platforms to sell food, no difference to 2023. The most common third-party platform used by businesses was Deliveroo (7%), closely followed by Just Eat (6%) and Uber Eats (6%).
Service activities businesses were more likely to use some form of third-party platform (17%) compared to any other sector. Service activities were more likely to use Deliveroo (11%) and Just Eat and Uber Eats Deliveroo (10% for both) than other sectors.
Online sales
All businesses that trade online were asked how much of their sales turnover was currently accounted for by online sales, across all platforms used. The majority (73%) said that less than a quarter of their sales turnover was accounted for by online sales, and a further 13% said less than a half.
Food Crimes
This chapter explores businesses’ awareness of the National Food Crime Unit (NFCU), the dedicated law enforcement function of the Food Standards Agency. It then examines the prevalence of a variety of food crimes which will be comparable to the last survey wave.
Awareness of the NFCU
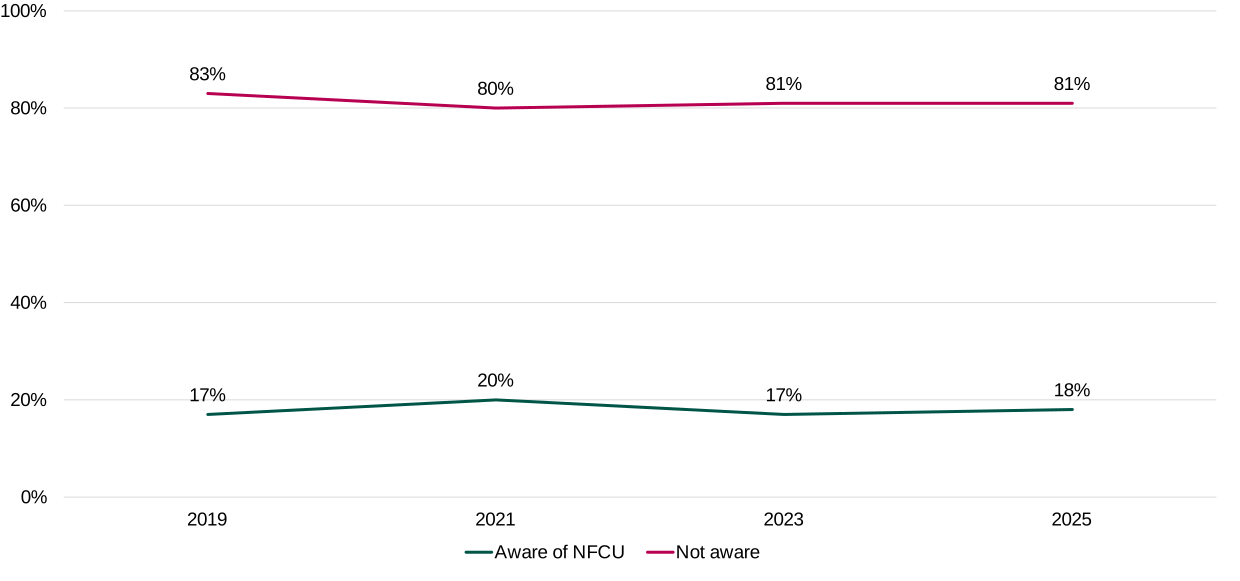
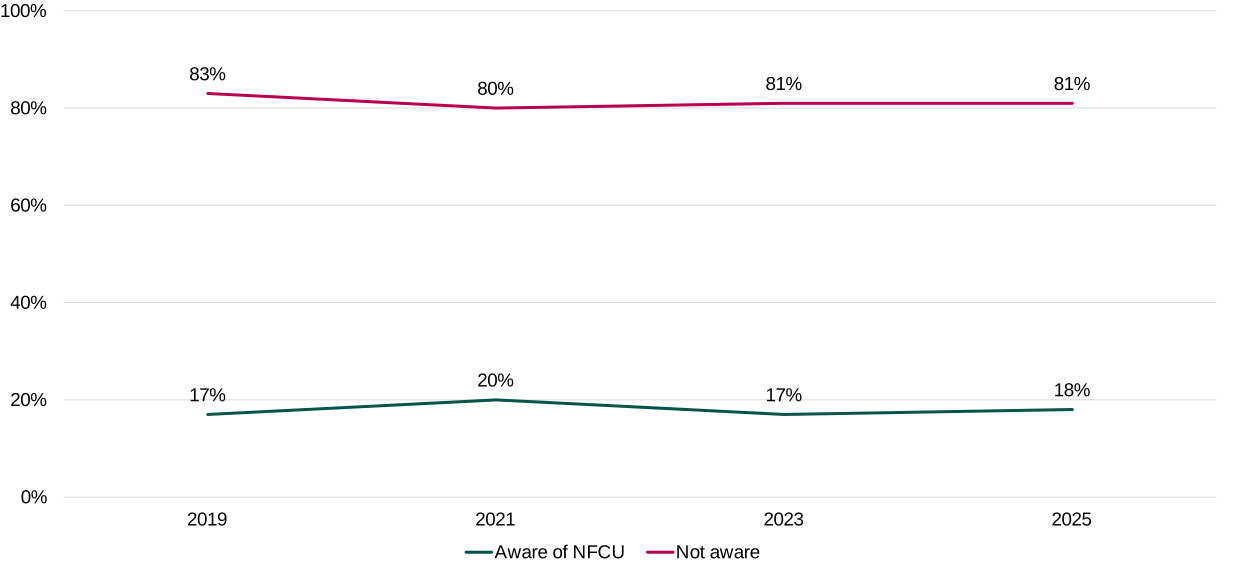
All businesses were asked whether they were aware of the National Food Crime Unit (NFCU). Less than one-in-five businesses (18%) were aware of the National Food Crime Unit (NFCU), with most respondents (81%) having no awareness of them, in line with previous years, as shown in Figure 17.
Businesses who were aware of the NFCU were subsequently asked whether they were aware of the NFCU’s online assessment tool for helping businesses prevent food crime. Of businesses that were aware of the NFCU, less than a third (29%) were aware of the NFCU’s online assessment tool to help their business prevent food crime, down from 43% in 2023. Almost seven-in ten (69%) were not aware of the tool, an increase from 57% in 2023.
Proportions of businesses experiencing food crimes
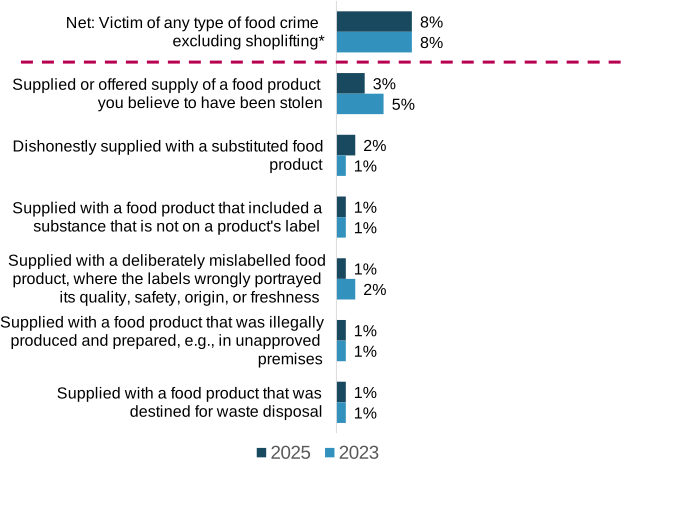
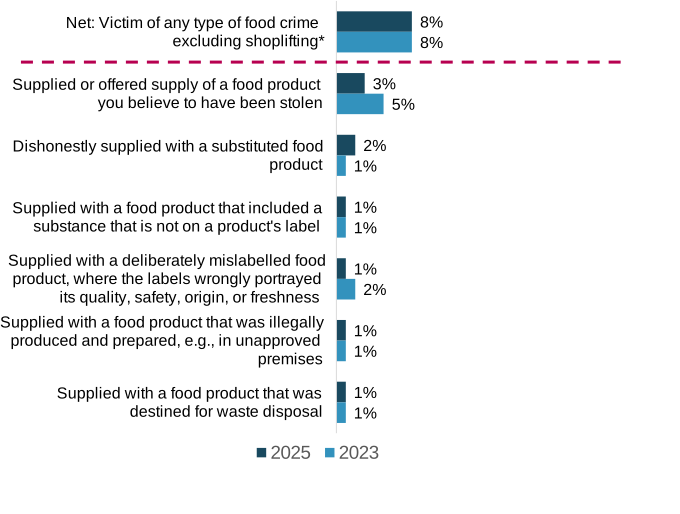
All businesses were asked whether they had been the victim of any type of food crimes over the last 12 months. As shown in Figure 18, nearly one-in-ten businesses (8%) had been victims of any food crime excluding shoplifting in the last 12 months, in line with 2023. The most common crime businesses had experienced was being supplied or offered a food product they believed to have been stolen (3%), followed by being dishonestly supplied with a substituted food product (2%). In all cases, the proportions experiencing types of food crimes had not changed significantly since 2023.
Importing and Exporting
This chapter provides evidence on the proportion of FBOs that have ever imported or exported goods or services, and how they imported or exported. It also covers whether those that do not currently import or export intend to do so in the future.
Overall proportions of businesses importing and exporting
Just under one in ten businesses (9%) had ever imported or exported goods or services. Due to changes in the questionnaire, this figure cannot be directly compared with the 2023 results.
Among the 91% of businesses that had not engaged in importing or exporting, almost all (98%) reported no intention of doing so in the future.
Businesses that had imported or exported were asked about specific destinations. Nearly all (46 out of 55) had conducted trade between EU countries (excluding the Republic of Ireland) and Great Britain or Northern Ireland. Around half (26 out of 55) had traded between non-EU countries and Great Britain or Northern Ireland.
Approximately a quarter of those based in Great Britain had imported or exported between the Republic of Ireland (12 out 55) and Great Britain. Around a quarter moved goods between Great Britain and Northern Ireland (13 out of 55).
Conclusions
This chapter is organised around the two research objectives set for Wave 5, before presenting an overall conclusion.
Objective 1. To ‘unpack’ attitudes towards regulation and deepen insights and knowledge of small and micro enterprises
Attitudes Towards Regulation
Most businesses view regulations favourably: the majority do not see them as barrier to business success and report feeling well informed about the regulations that applied to them. This was particularly evident among businesses that produced or sold food on their premises, which were more likely to report feeling well informed. Levels of confidence in regulatory processes remained high, with many businesses maintaining established approaches to food safety, allergen management and hygiene requirements.
Businesses largely continued to see regulatory expectations as clear and manageable, which was supported by the widespread use of written procedures, routine staff training and the consistent provision of allergen information. Sources of information used to understand regulation remained stable, with the FSA website remaining the most frequently used, although this varied across business groups. Awareness of FSA campaigns and guidance continued to develop, reflected by the use of the recently published allergen communication tools, and the FSA’s Safer Food Means Better Business package.
Insights Into Small and Micro Food Businesses
The results also provided important insights into how small and micro businesses were operating within the regulatory and economic environment. Many continued to demonstrate strong commitment to food safety through high levels of training participation and established procedures. However, several challenges remained. Changing consumer behaviour linked to the cost of living remained the most common concern, threat or barrier to business success faced by FBOs. Although concerns around inflation, interest rates and energy costs had lessened compared with 2023, they remained applicable to more than half of businesses. Recruitment pressures persisted for certain roles, particularly those requiring specialist skills.
Differences by typology remained notable. Micro businesses were generally less likely than small businesses to report engaging with the FSA website or subscribe to the FSA news and alerts service. Small businesses were more likely to report using online tools for training, written guidance or procedures for recalls or withdrawal, and the FSA allergen tools. They also tended to ask customers about allergens more consistently and were more likely to report using the FSA’s allergen tools.
Sector and national differences also shaped regulatory attitudes and behaviours. Businesses in the service activities sector demonstrated higher use of allergen tools and greater engagement with FSA campaigns. Businesses in Northern Ireland were more likely to rely on paper registration forms and less likely to use the FSA website for information. Retail businesses were more likely than other sectors to rely on suppliers as a key source of regulatory information. These variations highlight the importance of targeted communication and tailored support to ensure that regulatory messages reach all types of business effectively.
Objective 2. To measure trust in the FSA and extent to which FSA is considered a modern, accountable regulator
Confidence in the FSA remained high, with most businesses continuing to view the organisation as trustworthy, effective and committed to maintaining food safety and standards. Ratings of ease of contact and trustworthiness remained consistently high across all waves of the research.
However, the data showed declines across several measures compared with 2023, including perceptions of clarity and approachability. Confidence in specific regulatory functions also declined. Nonetheless, the findings highlighted the importance of clear communication, transparency and accessible guidance in maintaining confidence.
Overall Conclusion
Taken together, the Wave 5 findings show that FBOs remain strongly committed to food safety and broadly positive towards the FSA and food safety regulations. Businesses continue to demonstrate understanding of regulatory expectations and maintain a range of processes that support compliance. At the same time, there is scope to strengthen communication with micro businesses, increase visibility of recall and allergen guidance and reinforce awareness of crime prevention resources. Varied experiences across business sizes, sectors and nations highlight the value of targeted approaches and flexible regulatory support.
The sectors chosen as in-scope is consistent with those sampled in waves 1 and 2, with the exception of Primary Food Producers (who were excluded in wave 3) and sectors that specialised in the production of animal feed. The technical report (Annex A) presents the SIC codes of these in-scope sectors and their groupings.