
Executive summary
The Consumer Insights Tracker is the FSA’s online monthly tracking survey. It monitors the behaviour and attitudes of those aged 16 and over in England, Wales, and Northern Ireland in relation to a range of food-related topics.
This report presents an overview of key findings, alongside demographic comparisons, over the full tracking period (July 2023 to March 2026), with a particular focus on the most recent year of data (April 2025 to March 2026). Key findings are given below.
Concerns about food
The price of food has consistently been the most common prompted concern, with approximately nine in ten (91%) reporting concern[1] in March 2026.
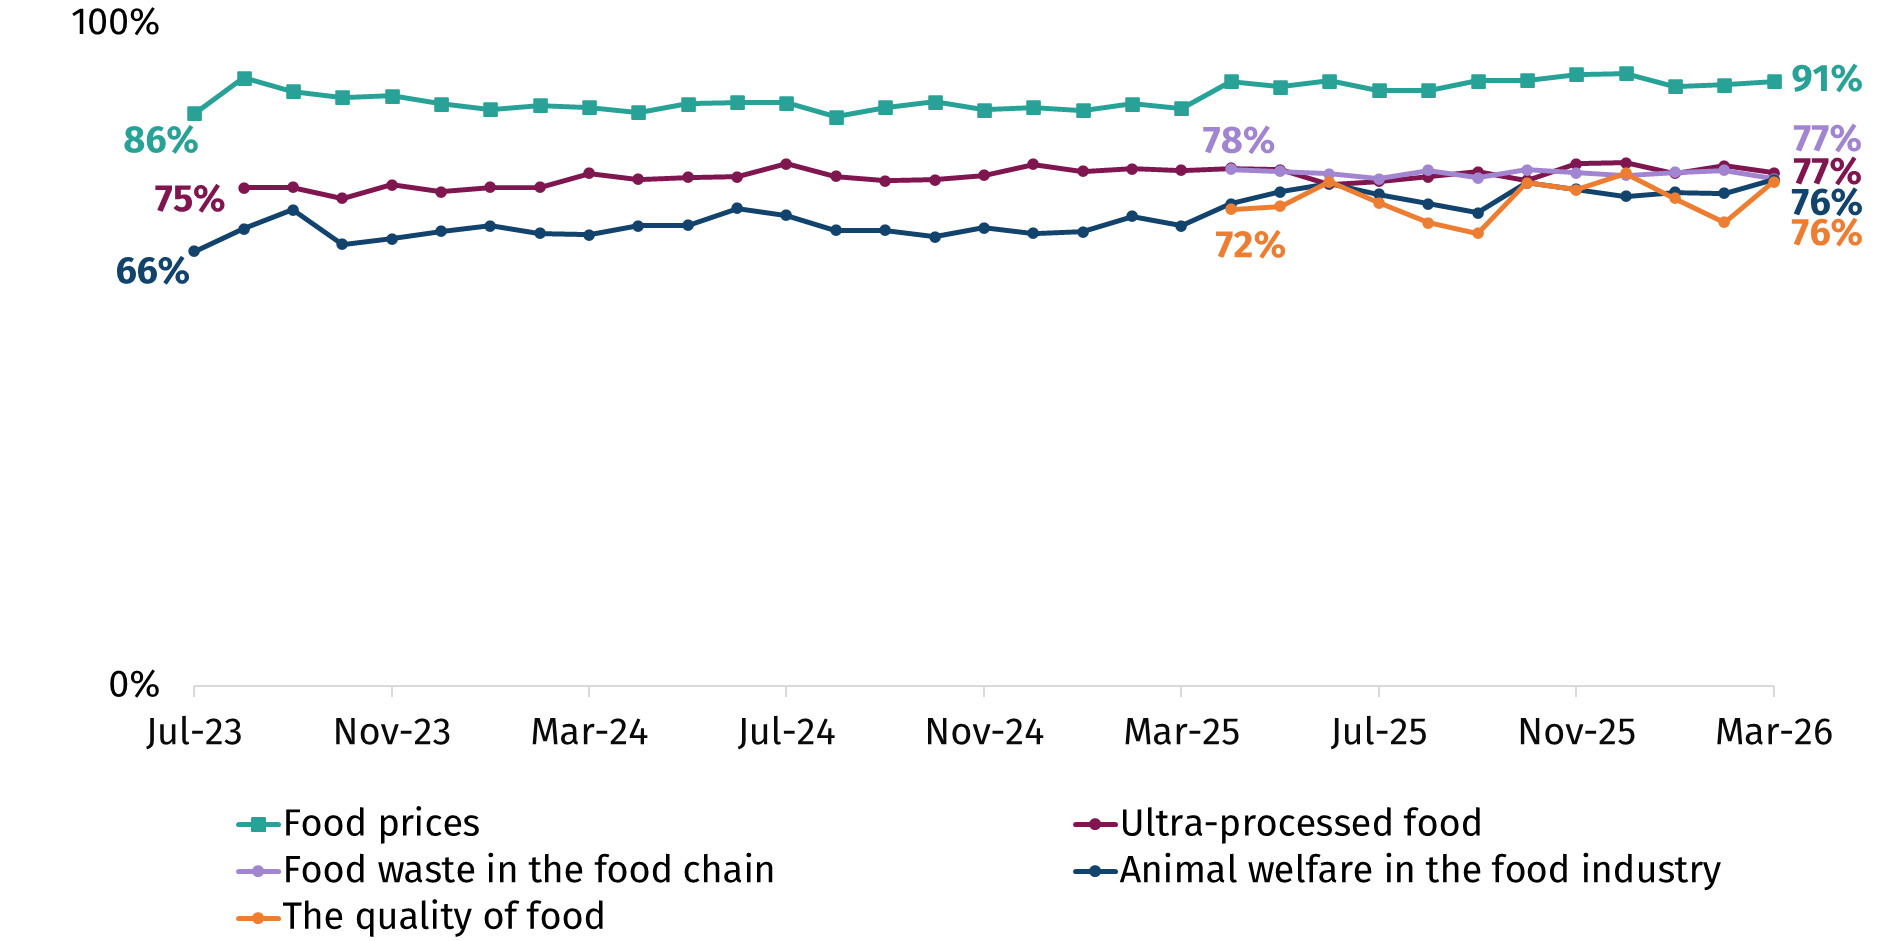
There has been relatively little variation among the top concerns over time. For example, the top concerns in March 2026 along with their range over the tracking period are food prices (ranging from 86% - 92% reporting concern), ultra-processed food (74% - 79%), food waste in the food chain (77% - 78%), animal welfare in the food industry (66% - 76%) and the quality of food (68% - 77%).
In addition to the list of prompted concerns, in some waves respondents were asked a question to capture their unprompted concerns. Overall, the unprompted responses closely mirror the prompted findings, with food affordability, including food prices, ultra-processed food and food quality featuring prominently in both. A higher percentage of respondents reported concern across all topics when prompted, likely reflecting the greater cognitive effort required to provide an unprompted answer.
Household food affordability and financially motivated behaviours
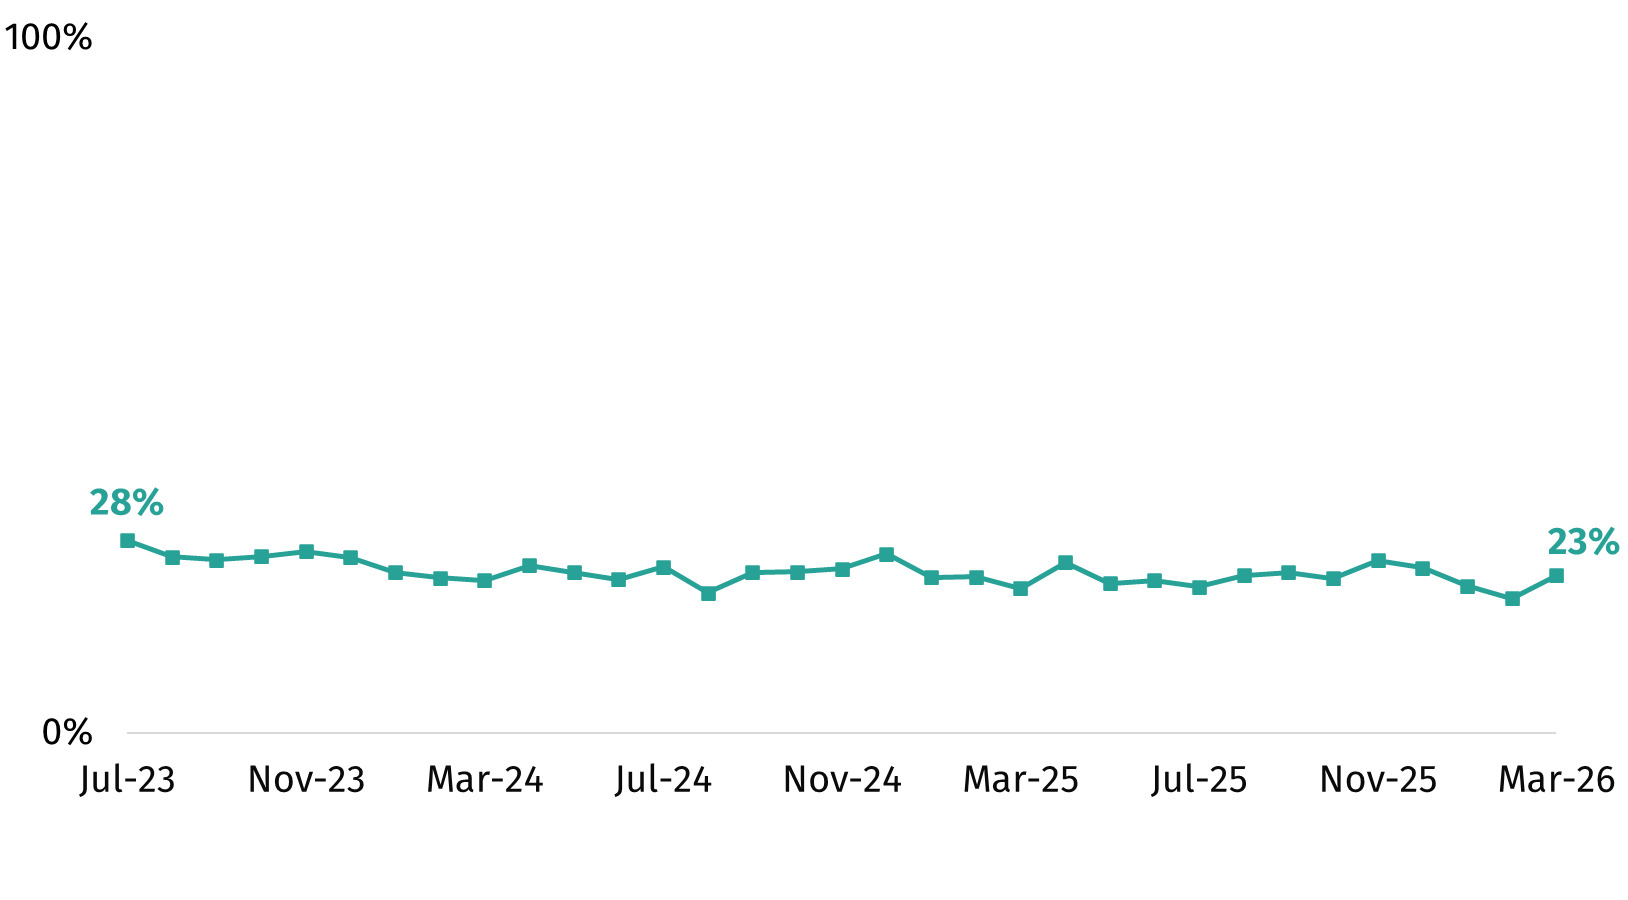
While there is high concern about food prices, a lower percentage of respondents were worried about themselves (or their household) being able to afford food in the next month (23% in March 2026). Across the full time series (since July 2023), levels of worry about food affordability have fluctuated within a relatively narrow range (19% in February 2026 – 28% in July 2023). This pattern continued over the past year, with worry falling slightly between November 2025 and February 2026 (25% to 19%), before slightly increasing again in March 2026 (23%).
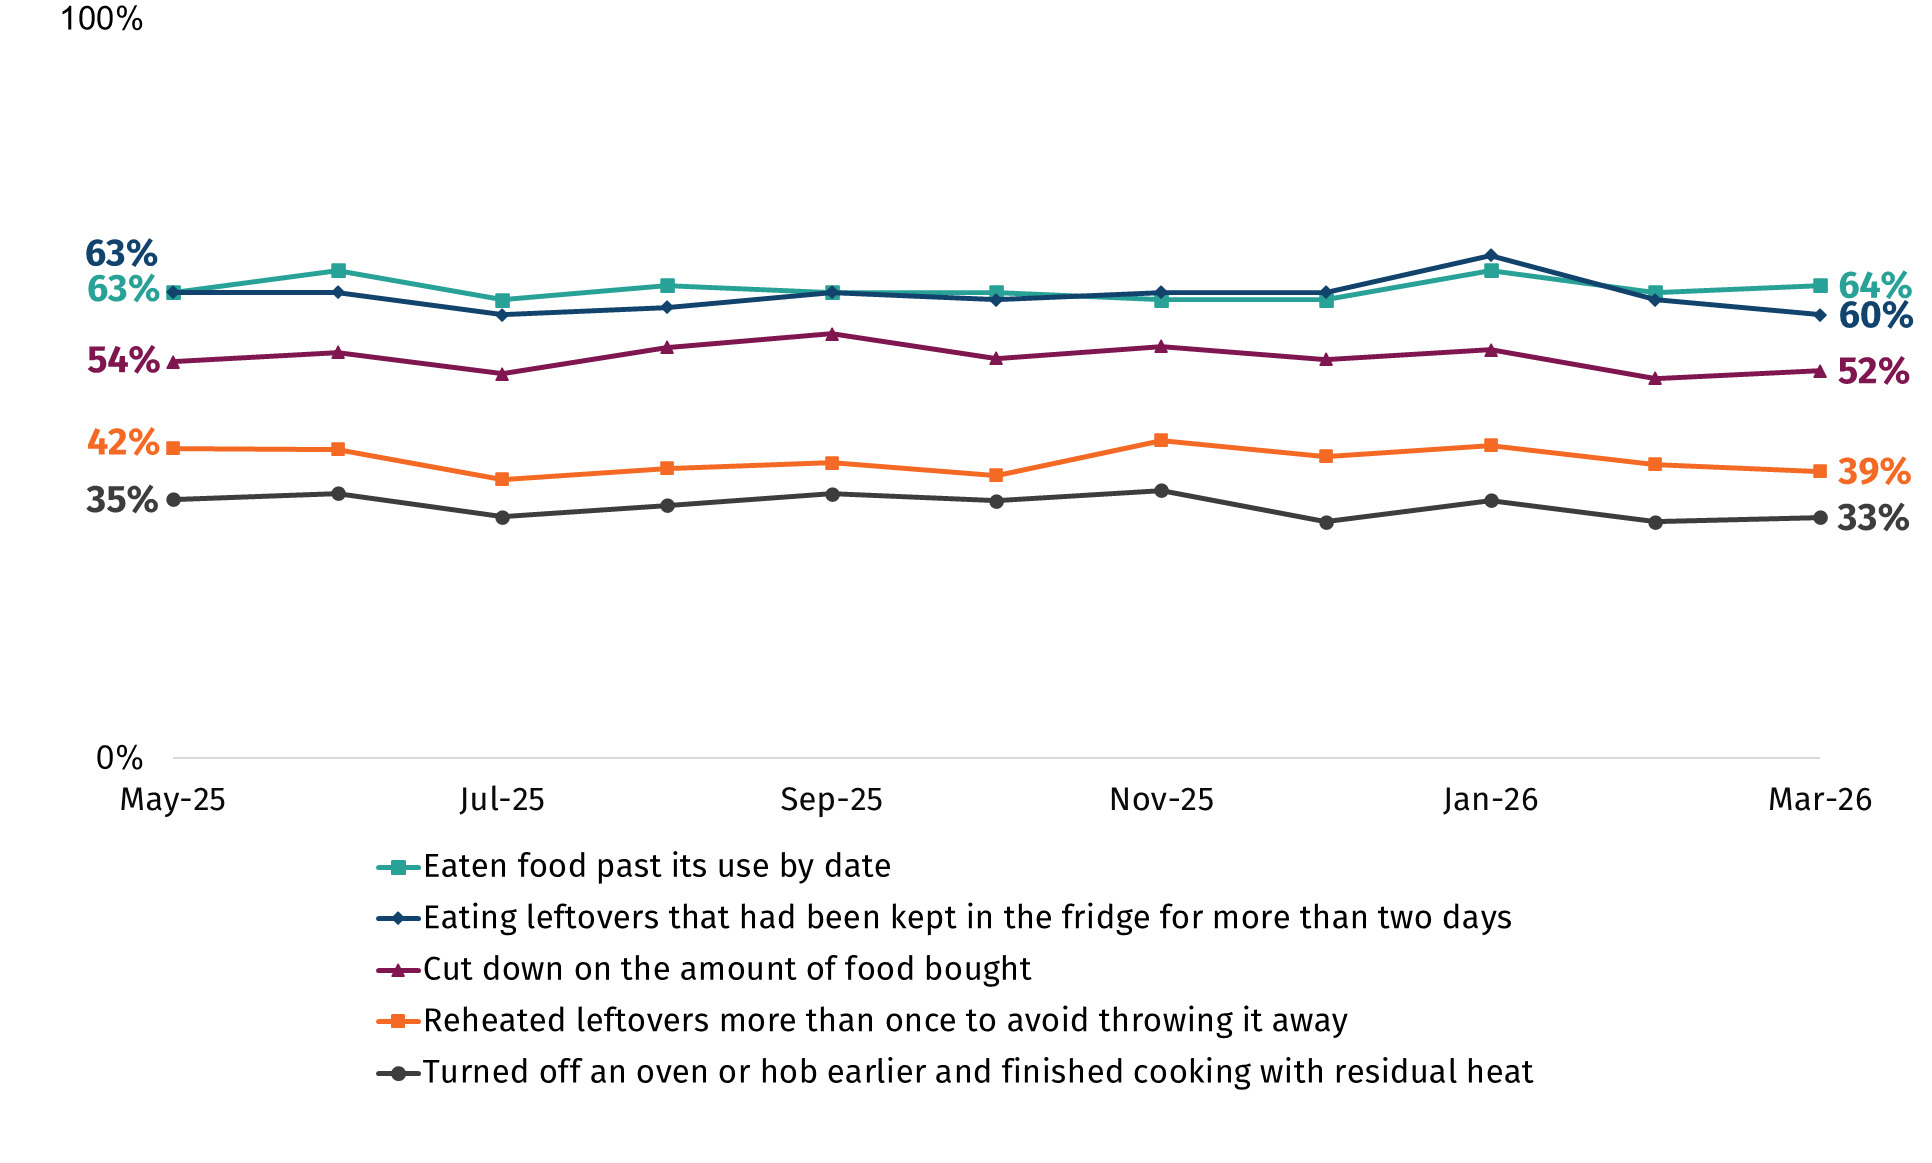
When prompted, a high percentage of respondents reported engaging in financially motivated food-related behaviours in the past month to save money. The most common reported behaviours were eating food past its use by date (64% in March 2026) and eating leftovers that had been kept in the fridge for more than two days (60% in March 2026).
When looking at a number of these behaviours over time, the percentage of respondents who reported that they or someone in their household had engaged in them has remained broadly stable since tracking began in May 2025, with a slight peak in January 2026. This reflects actions respondents reported taking in December 2025, before returning to more typical levels in February 2026.
The behaviours that increased slightly were eating leftovers that have been left in the fridge for more than two days (68% in January 2026 compared to 63% in December 2025), eating food past its use by date (66% in January 2026 compared to 62% in December 2025), eating food cold rather than heating it (29% in January 2026 compared to 24% in December 2025) and storing food that should be refrigerated outside the fridge (21% in January 2026 compared to 14% in December 2025).
Other behaviours are asked about within the survey but are reported by fewer respondents and have remained broadly stable over time.
Awareness, trust and knowledge of the FSA
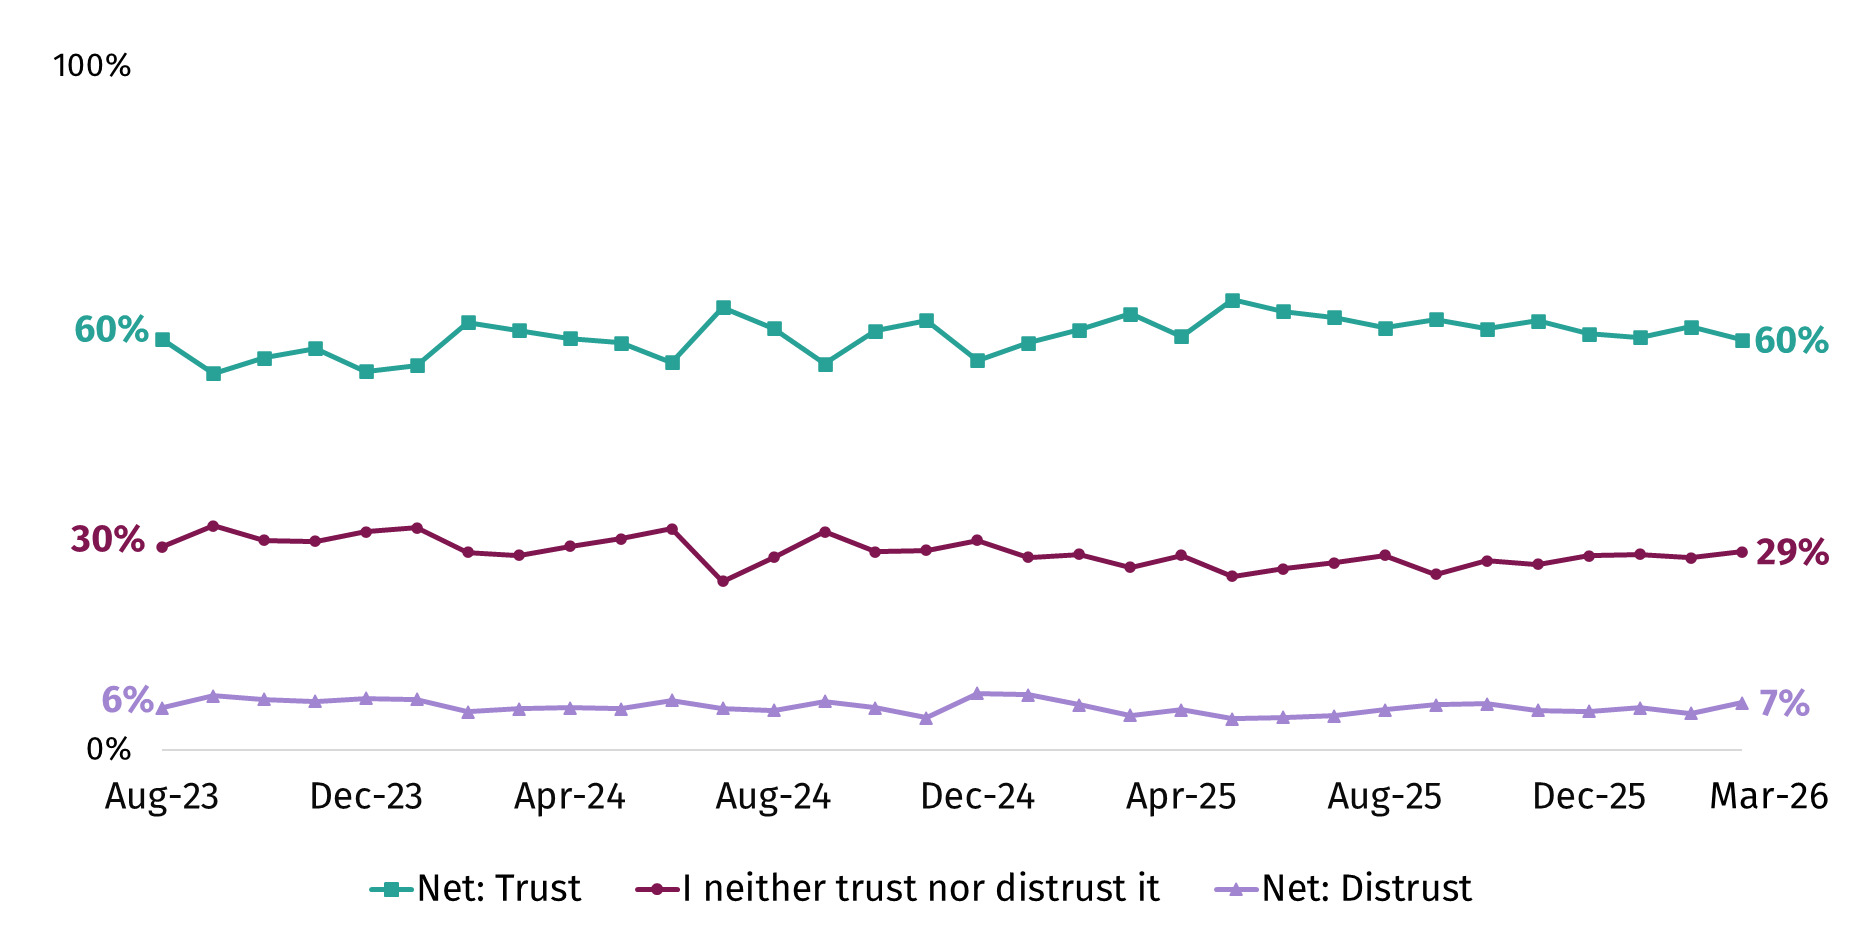
Among respondents with some knowledge of the FSA and what it does, the percentage who trust the organisation has remained comparable between April 2025 (61%) and March 2026 (60%), although there have been some monthly fluctuations. Trust in the FSA has also remained stable since tracking began in August 2023 (60%).
Food safety information encountered in the past month
New questions were added in April 2025 about food safety information that has been encountered in the month prior to fieldwork. When prompted, respondents most commonly reported hearing about recall of food products (35% in March 2026), food hygiene ratings of businesses (31%) and allergies and intolerances (22%). This has been consistent across the year.
Novel foods and food production techniques
A range of questions on novel foods and food production techniques were asked between April 2025 and March 2026. These questions are only included in the survey every 6 months.
In March 2026, 13% of respondents said they had heard of precision breeding before. This has fluctuated slightly over time between March 2024 and March 2026 (range between 13% and 18%). Precision breeding of plants (49%) was more likely to be seen as acceptable than precision breeding of animals (26%) – a pattern that is consistent over time.
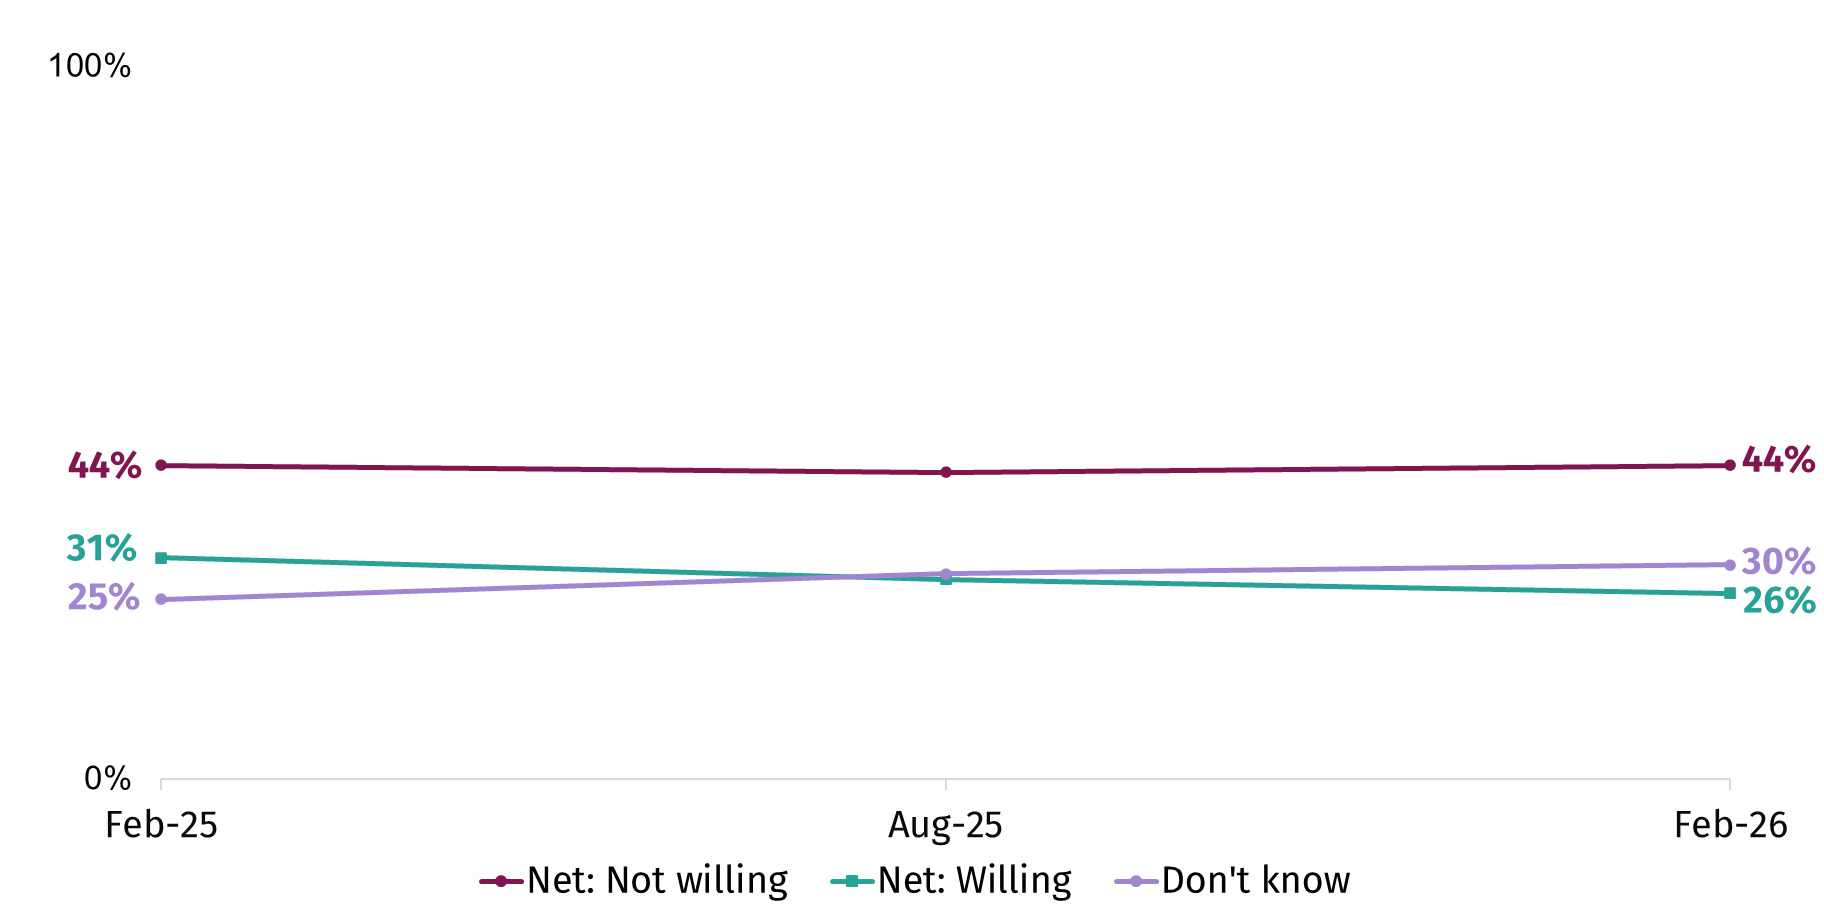
In February 2026, when prompted with definitions of what various terms mean, most respondents said they had heard of fermentation (82%), with the majority of this group saying they knew what it was (66%). Fewer had heard of precision fermentation (20%) and precision fermented dairy (15%). Around one in four (26%) said they would be willing to include precision-fermented dairy products in their diet if authorised for sale in the UK. A higher percentage (44%) said they would not be willing to, and 30% said they didn’t know.
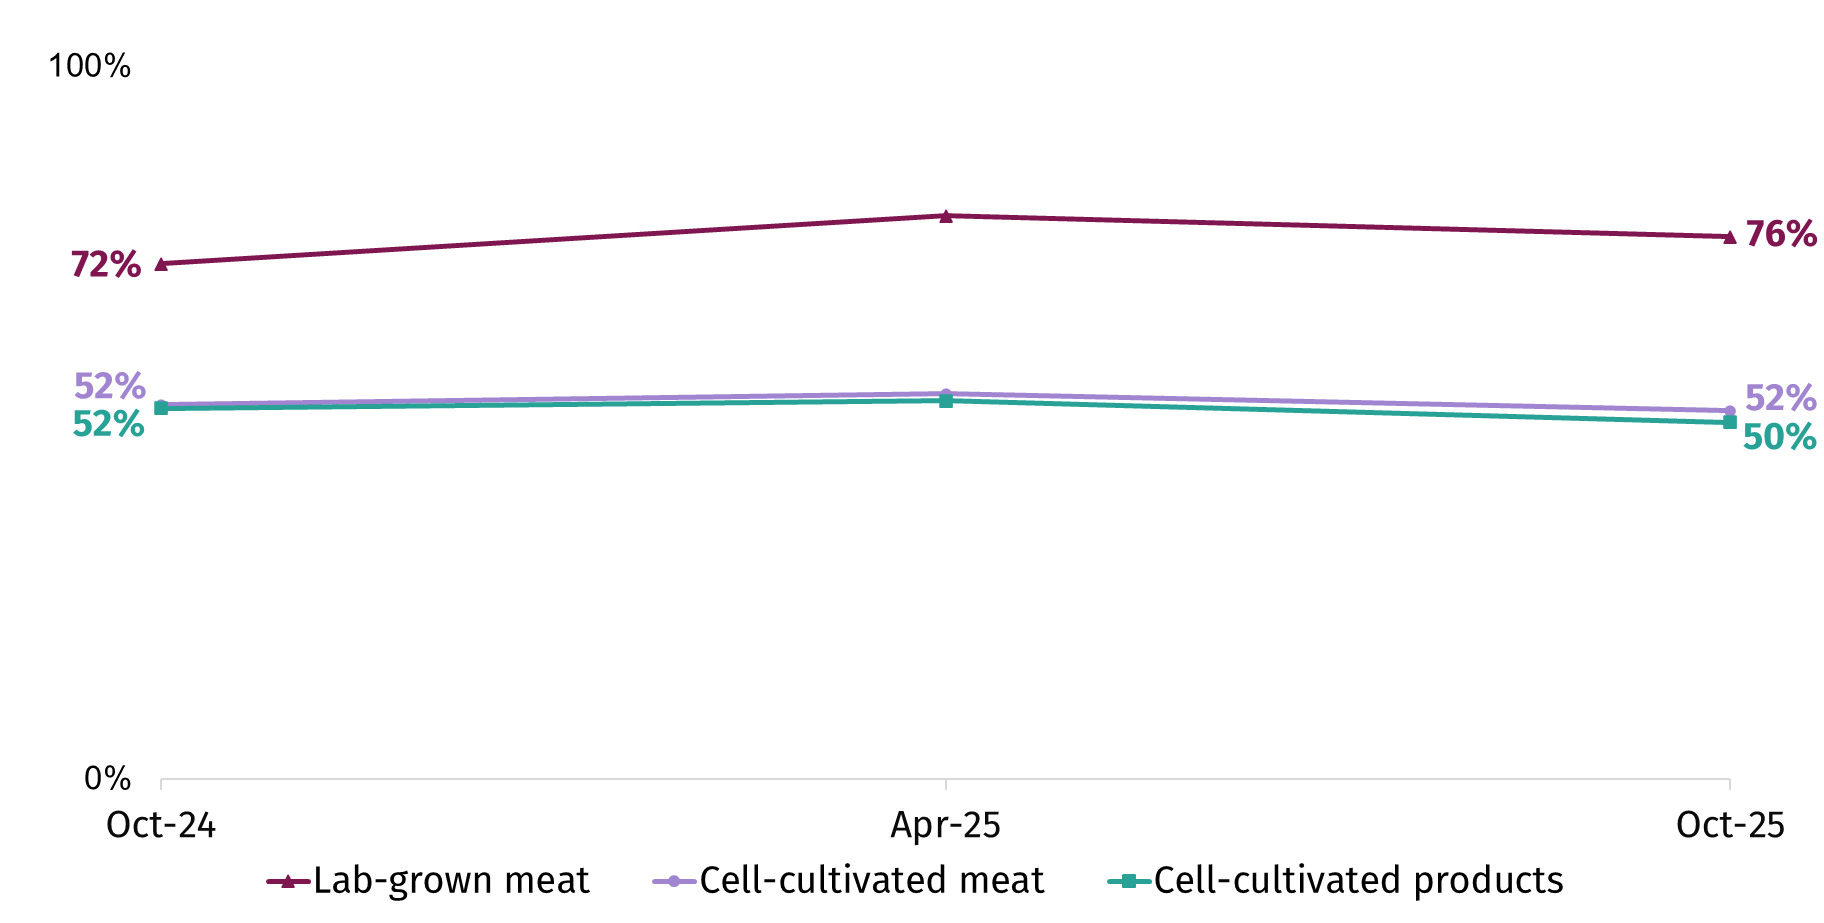
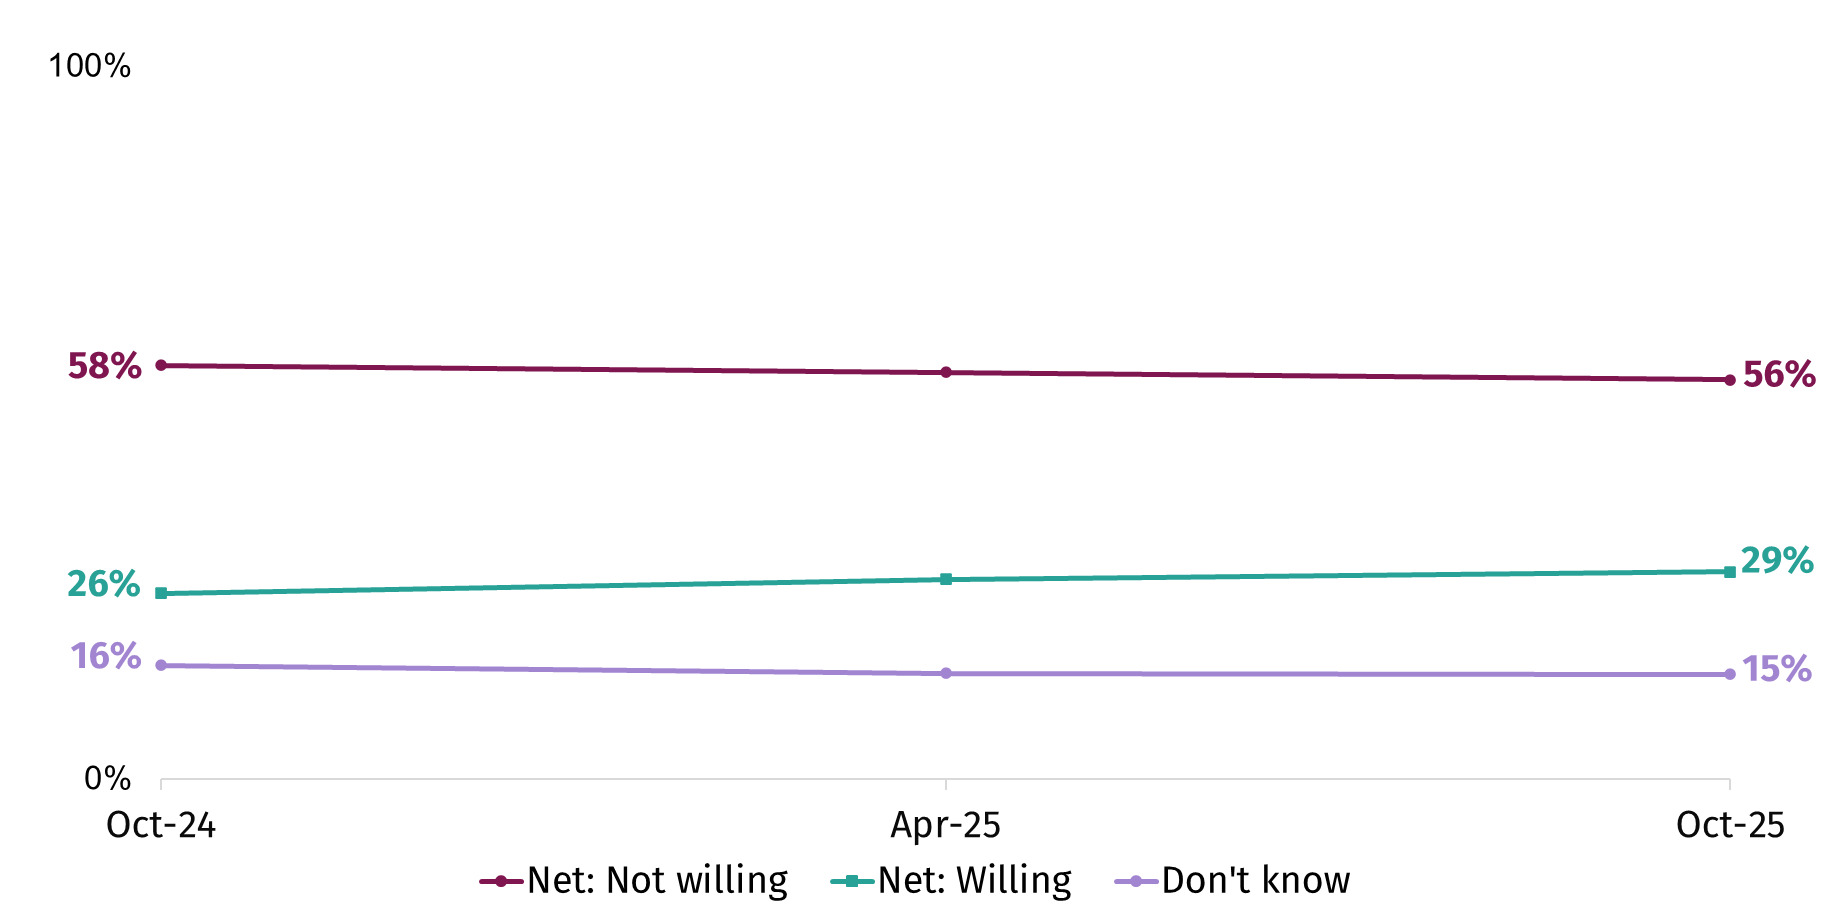
The percentage of respondents who have heard of the term ‘lab-grown meat’ when prompted with a definition has fluctuated slightly (between 72% in October 2024 and 79% in April 2025). Respondents in October 2025 were more likely to think that cell-cultivated meat should not be on sale in the future (44%) than should be (34%). The majority (56%) would not be willing to include it in their diet, which has been consistent over time.
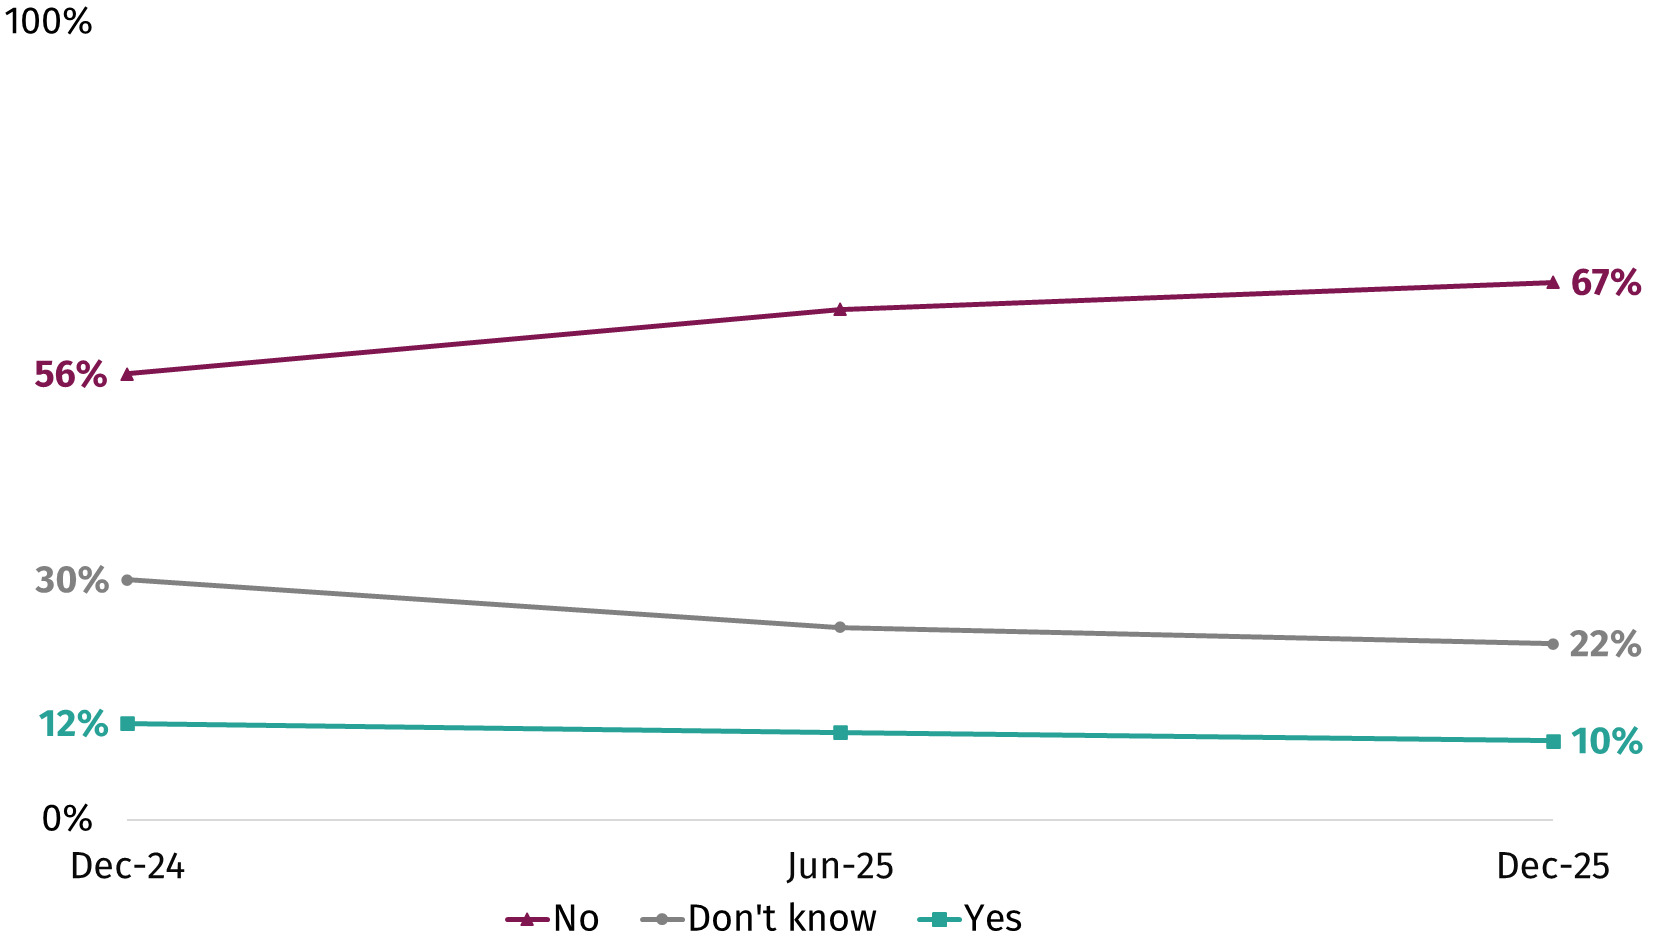
In December 2025, one in ten (10%) respondents said they had used or consumed products containing cannabidiol (CBD) in the last 6 months, consistent with June 2025 (11%) and slightly lower than December 2024 (12%). Of these, around one in three (32%) said that they typically consume 1-10mg when they have CBD, in line with the FSA’s recommendation that healthy adults should limit their consumption of CBD to 10mg per day. However, over two in five (44%) reported that they don’t know how much they typically consume.
Introduction
Background
The Consumer Insights Tracker is the FSA’s monthly survey that monitors changes in consumers’ behaviour and attitudes in relation to food. The survey is conducted with consumers across England, Wales and Northern Ireland and covers a range of food-related topics that are of strategic interest to the FSA. This includes concerns about food-related issues and attitudes and behaviours relating to food affordability. The survey also covers a range of additional topics on an ad-hoc basis, such as novel foods (e.g. CBD) and food production techniques (e.g. precision breeding, cell-cultivated products). A full list of the additional topics covered from April 2025 to March 2026 can be found in Appendix A.
The regularity of data collection (monthly) allows for the monitoring of trends over time and helps to identify emerging issues. The data gathered, alongside other robust sources of evidence, supports policy decisions, helps prioritise areas for further research, and supports the development of FSA communication campaigns.
This report presents an overview of key findings, alongside demographic comparisons, over the full tracking period (July 2023 to March 2026), with a particular focus on the most recent year of data (April 2025 to March 2026). Due to question changes in April and May 2025, some questions are only presented from May 2025 onwards. Further information on these changes can be found in the technical report.
History of the Consumer Insights Tracker
The FSA has been conducting monthly surveys since April 2020, when the FSA established the COVID-19 Tracker to monitor attitudes and behaviour during the COVID-19 pandemic. This survey was designed to provide more regular and timely insights than the FSA’s official statistic survey; Food and You 2[2]. In April 2022, the survey was renamed the Consumer Insights Tracker. YouGov was appointed as the supplier of the Consumer Insights Tracker from July 2023.
Wider context
Since 2022, the cost of living has risen both in the UK and globally, with this survey series (from July 2023 onwards) taking place during a period of easing pressures in England, Wales and Northern Ireland. Inflation, as measured by the consumer price inflation (CPI) index, fell from 6.8% in July 2023 to 1.7% in September 2024, before rising again to 3.8% in July 2025 (remaining at that level until September 2025) and then easing slightly to 3% in February 2026, according to the Office for National Statistics (ONS). Although inflation declined from the elevated levels seen between February 2022 and late 2023, it remained above the Bank of England’s 2% target for most of the period, with the exception of May, June and September 2024.
Between July 2023 and April 2024, inflation for food and non-alcoholic beverages was higher than CPI, generally lower for the rest of 2024, and then higher again from January 2025 onwards. In practice, this means that for large parts of the tracking period food shopping costs increased faster than the overall cost of living. This indicates that food prices were a significant contributor to overall inflation for large parts of the tracking period, although their contribution did vary somewhat over time.
Since October 2024 the FSA has delivered coordinated communications on cell-cultivated products and precision fermented foods, including videos, webpages and social media content. This activity featured prominently in the news in October/ November 2024 and March 2026. In parallel, it has maintained ongoing communications on CBD, including safety and reformulation updates, a public consultation, consumer research, expert advice, and businesses guidance.
High profile food safety issues in the 12 months prior to March 2026 included the risks to young children when consuming glycerol in slush ice drinks (Summer 2025); how some imported Dubai style chocolate could pose a risk to those with food allergies (Summer 2025, with advice repeated before Christmas 2025) and the widescale recall of Infant Formula (February 2026).
During the past 12 months there was also ongoing geopolitical instability, including the continued conflict between Russia and Ukraine, and increased tensions in the Middle East, culminating in wider conflict and the closure of the Straits of Hormuz in late February 2026. These conflicts potentially disrupt global supply chains, such as energy and commodities including food.
It is possible that some of these events may have impacted consumers’ views and behaviours towards food and attitudes towards the food system more broadly.
Method
The Consumer Insights Tracker is carried out monthly among a representative sample of approximately 2,000 adults aged 16 and over living in England, Wales and Northern Ireland. All respondents who take part in the survey are drawn from the YouGov panel of over 400,000 active panel members who live in the UK.
The sampling approach used is quota sampling, with quotas taken from the 2021 Census. The sample for each wave is representative of the England, Wales and Northern Ireland population by age, gender, social grade, region and education level. A sample boost is also applied in Northern Ireland (achieving 100 respondents each month), to improve the representation of this group and to enable demographic comparisons between countries. Once fieldwork has been completed, weighting is applied to ensure that the sample more accurately reflects the demographics of the target population by age, gender, social grade, region and education level.
Full details of the methodology can be found in the Technical Report.
Reporting conventions
How significance testing is used
The Consumer Insights Tracker uses t-tests to assess differences over time and between groups, and highlights those where the p value is <0.05. Due to the quota sampling methodology used, this is not an exact test of whether differences are statistically significant and indicative of real changes in the wider population. However, they may highlight where there could be shifts in behaviour or attitudes, and further research would be required to assess if these changes are real.
How changes over time are described
Differences between waves are described based on both statistical significance and magnitude.
To highlight ‘notable’ differences, variations in responses are reported whenever the absolute difference is 10 percentage points or larger and is statistically significant at the 5% level (p<0.05).
Where a variation in response between waves is less than 10 percentage points but is judged to be of interest, and is statistically significant at the 5% level, these are reported as ‘slight’ changes.
Where there is no significant difference between responses across waves, the pattern of responses is described as being stable or comparable.
Criteria for including demographic differences
Key demographic variables analysed include gender, age, region, presence of children under 18 in the household, health condition or disability status, Index of Multiple Deprivation (IMD) decile and social grade (see Appendix B).
All demographic differences included in this report are statistically significant at the 5% level and:
-
represent a difference of 5 percentage points or more between the groups in March 2026
-
are considered of interest or meaningful to the FSA
-
the difference has been statistically significant across the last quarter (3 months) consistently
Other demographic cross breaks are available in the data tables but are not captured in this report for brevity. There are some other statistically significant differences in the data tables, however these were considered of less interest to this report.
How the data is presented and trends are discussed
Data is presented as trends over time by default, showing results across the full tracking period (July 2023 to March 2026) where possible. This is followed by a more detailed focus on the most recent year (April 2025 to March 2026).
Data labels on graphs are shown only for the earliest and most recent waves to maintain readability.
Notes for interpretation
It should also be noted that there are some limitations of the online methodology used as part of this survey. For example, respondents in opt-in panel surveys may be more engaged in current issues, which means they are more motivated to opt-into panel surveys. This means measures for some attitudes and behaviours may not truly reflect the total population. Additionally, some groups are underrepresented in online opt-in panels, for example those who do not have internet access or who are not comfortable going online, who also tend to be older and in lower socio-economic groups.
YouGov’s large nationwide panel, from which the survey sample is drawn, acts to mitigate these impacts by enabling data to be gathered that is representative of the population in England, Wales and Northern Ireland across a range of demographic characteristics. In addition, the online methodology helps to reduce certain forms of bias (such as social desirability bias) compared to alternative survey methods, which can ensure that results better reflect people’s true behaviours and beliefs.
Some findings in this report are based on only three data point. Trends for these questions should be interpreted with caution, as with limited data points, changes may reflect natural fluctuation (e.g., sampling variation) rather than meaningful change. Trends over time may become clearer as more data points are added to the time series.
Further information about the research strengths and limitations are available in the Technical Report.
Detailed findings
Concerns about food
This section of the report captures respondents’ concern about food including the demographic groups who felt most concerned between July 2023 and March 2026.
What were respondents concerned about in relation to food when prompted?
The price of food has consistently been the most common prompted concern, with approximately nine in ten (91%) reporting concern (either ‘highly’ or ‘somewhat’ concerned) in March 2026. There has been relatively little variation among the top concerns over time.
The most common prompted concerns in March are outlined below and shown in Figure 1. The data in brackets shows the range across the tracking period.[3]
-
Food prices (ranging from 86% - 92% reporting concern)
-
Ultra-processed food[4] (74% - 79%)
-
Food waste in the food chain (77% - 78%)[5]
-
Animal welfare in the food industry (66% - 76%)
-
The quality of food (68% - 77%)
Of the top concerns listed, animal welfare shows the greatest variation, having increased notably over the whole time series from 66% in July 2023 to 76% in March 2026. Since March 2025, there is also some evidence of a slight upward trend (from 69% to 76%).
Food quality is another area where concern has varied over the tracking period. The percentage of respondents reporting concern about this has fluctuated slightly between waves, with no clear upward or downward trend.[6]
.png)
The figures above show the percentage who were either ‘highly’ or ‘somewhat’ concerned about each issue. Looking specifically at the percentage that said they were ‘highly’ concerned, the pattern is broadly similar in March 2026:
-
Food prices (55%)
-
Ultra-processed food (42%)
-
Food poverty and food inequality (37%)
-
Animal welfare in the food industry (37%)
-
Food waste in the food chain (32%)
In March 2026, respondents were least concerned about food allergen information (e.g. availability and accuracy) (range from 43% in August/September 2025 and February 2026 to 49% in October 2025), food poisoning (e.g. Salmonella and E. Coli) (51% in February 2026 to 58% in October 2025) and food shortages (45% in March 2025 to 58% in October 2025). Respondents have typically been less concerned about these issues in comparison to others.
Demographic differences: Food concerns
In the sections below, demographic differences for the top 3 prompted concerns (food prices, ultra-processed foods and food waste in the food supply chain) are explored where they meet the reporting criteria. Data from March 2026 has been provided as an example, but similar patterns have been observed over time.
Who was most concerned about food prices?
Concern was slightly higher among women surveyed than men (March 26: 93% vs. 89%), without any other notable differences by demographic subgroup.[8]
Who was most concerned about ultra-processed food?
High levels of concern were also reported about ultra-processed food in March 2026. Those most concerned were:
-
Women surveyed (81% vs. 74% of men)
-
Respondents in older age groups (83% of those aged 55+ vs. 76% of those aged 35-54 and 72% of those aged 16-34)
-
Respondents in the least deprived IMD deciles (8-10) (80% vs 74% of those in the most deprived IMD deciles (1-3))
Who was most concerned about food waste in the food chain?
Concern about food waste in the food chain was also high, though concern was higher among:
-
Women surveyed (82% vs. 71% of men)
-
Respondents in older groups (79% of those aged 55+ vs. 71% of those aged 16-34)
-
Respondents from higher social grades (80% of those in social grade AB vs. 73% in social grade DE)
What were the top unprompted concerns among respondents?
In addition to the list of prompted concerns, in some waves[9] respondents were first asked a closed question about whether, or not, they had concerns about food in the UK in general. This was followed by an open question to capture unprompted concerns. The aim of this qualitative measure was to identify whether respondents spontaneously raised different issues over time, and to compare these findings with the prompted list of concerns asked elsewhere in the survey.
In February 2026 when these questions were last asked, 45% of respondents said they had any concerns about food in the UK in general. Respondents who said they had concerns about food in the UK were invited to describe these in their own words. Their comments covered a broad range of issues or sub-themes, that can be organised under five main themes explored below.
Food affordability and inequality
Among those who expressed general concerns about food in the UK, food affordability was a common theme. This included comments around rising food prices, the affordability of everyday essentials, the need to change eating and cooking behaviours to manage costs, and food poverty/inequality. These are illustrated by the quotes below.
“Becoming very expensive and price rises seem to be outpacing inflation”
“Too expensive for working people to afford a good balanced nutritional diet”
“Not everyone has enough and there’s too much waste”
Food quality and safety
Food quality and safety was also a common area of concern among respondents. This included general views on food quality (e.g., poor quality fruit and vegetables), as well as concerns about processed and ultra-processed foods. Respondents also raised issues around the ability to maintain a healthy diet, alongside concerns about ingredients, additives, and food safety or hygiene. Some respondents mentioned concerns around public health and the role of new or novel foods. These concerns are illustrated by the quotes below.
“Quality of fresh fruit and veg, especially the cheaper ones are rotten really quick”
“Concerned about what processed food actually is and what’s in it”
“Fast food everywhere, no incentive to do home-cooked food, as the prices of fresh ingredients are too high”
UK food system resilience
Less commonly mentioned concerns centred around UK food system resilience. This included concerns about food security, challenges facing British farming, alongside issues with food availability and choice. Supply chain reliability was also mentioned, with some highlighting vulnerabilities in the system. These concerns are illustrated by the quotes below.
“The UK is not able to supply and grow enough crops to be self sufficient”
“We don’t produce enough food to feed our population so are reliant in [sic] imports”
“That we import too much instead of producing it ourselves”
Governance, trade and industry practises
With regards to governance, trade and industry practises, respondents mentioned concerns about retail and industry practices, as well as the impact of trade and imports on standards. Respondents also mentioned regulatory standards, farming and production practices, the role of government policy and labelling and transparency. These concerns are illustrated by the quotes below.
“Supermarkets should pay farmers the correct prices”
“Poor governance of where food actually comes from and what is actually in our food”
“I’m worried about food from other countries with lower food standards being sold as UK products”
Sustainability and ethics
Sustainability and ethical issues were another area of concern. Respondents mentioned animal welfare, the sustainability of food production, and the impact of food waste and packaging. These concerns are illustrated by the quotes below.
“We waste too much”
“All of the large supermarkets sell fresh food with far too much plastic packaging”
“I’m concerned about animal welfare”
How do the unprompted concerns compare to the prompted ones?
Overall, the unprompted responses closely mirror patterns from the prompted concerns. For example, food affordability and inequality, and in particular food prices, are of concern to a high percentage of respondents in both. Ultra-processed food also features prominently in both, as does the quality of food. A higher percentage of respondents report concern about topics when prompted, likely reflecting the greater cognitive effort required to provide an unprompted answer.
Household food affordability and financially motivated behaviours
This section of the report explores respondents’ perceptions and experiences of food affordability, as well as engagement in specific food-related behaviours to save money.
How have worries about food affordability changed over time?
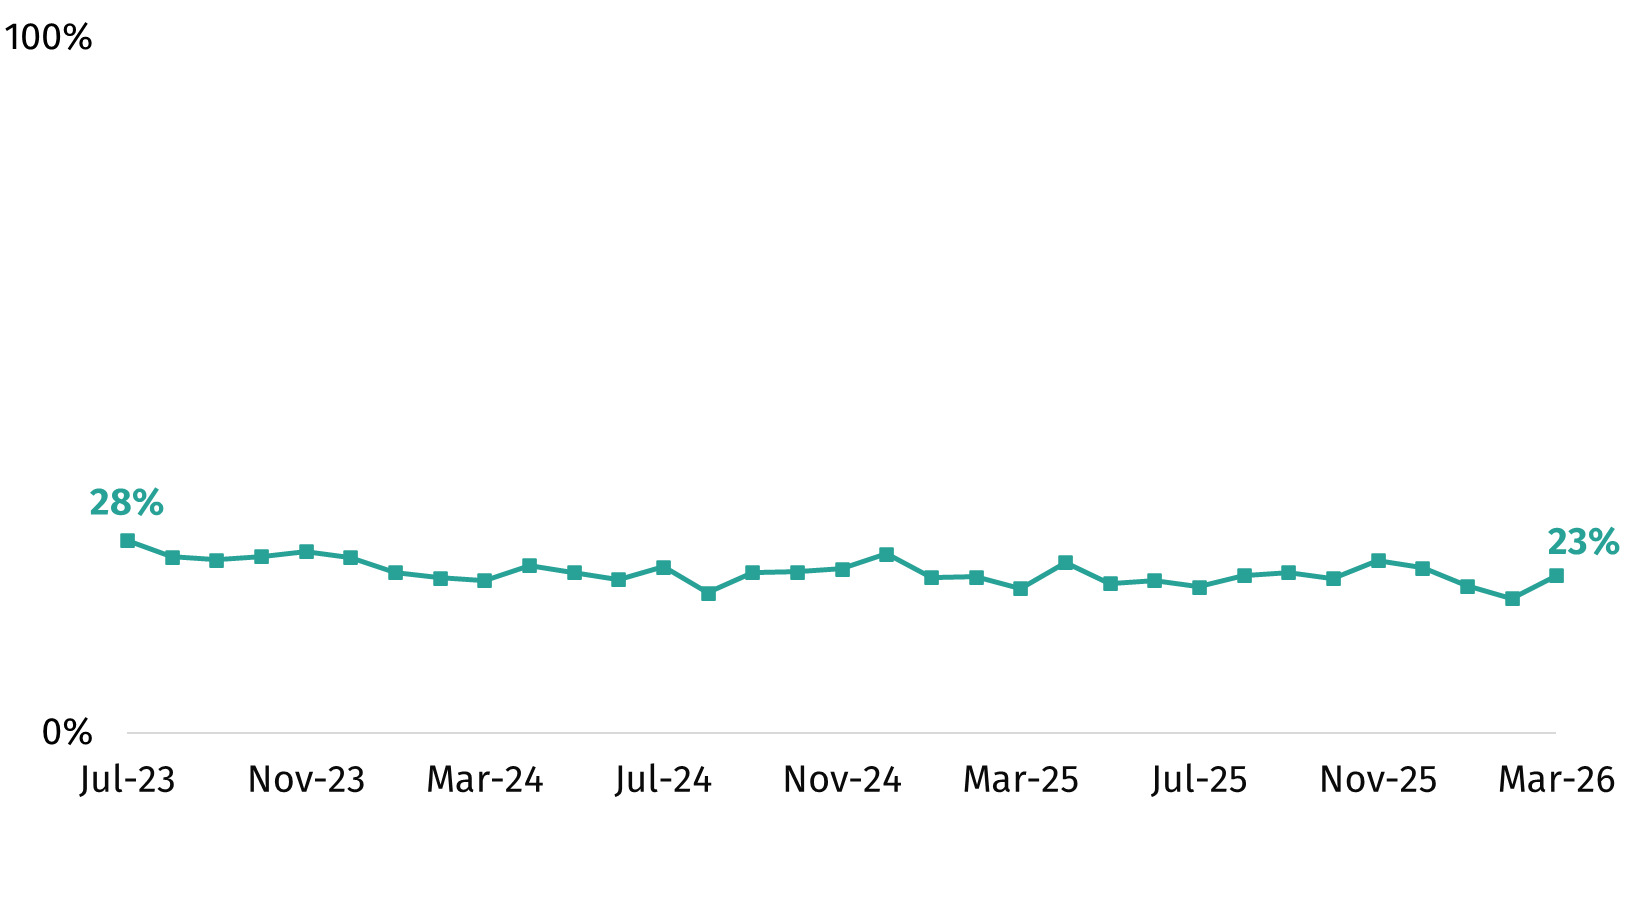
Since July 2023, the percentage reporting they were worried[10] about being able to afford food in the next month has fluctuated (19% in February 2026 and 28% in July 2023 – see Figure 2). In recent months, this fell slightly between November 2025 and February 2026 (from 25% to 19%), before increasing slightly again in March 2026, reaching 23%.
Who was most worried about food affordability?
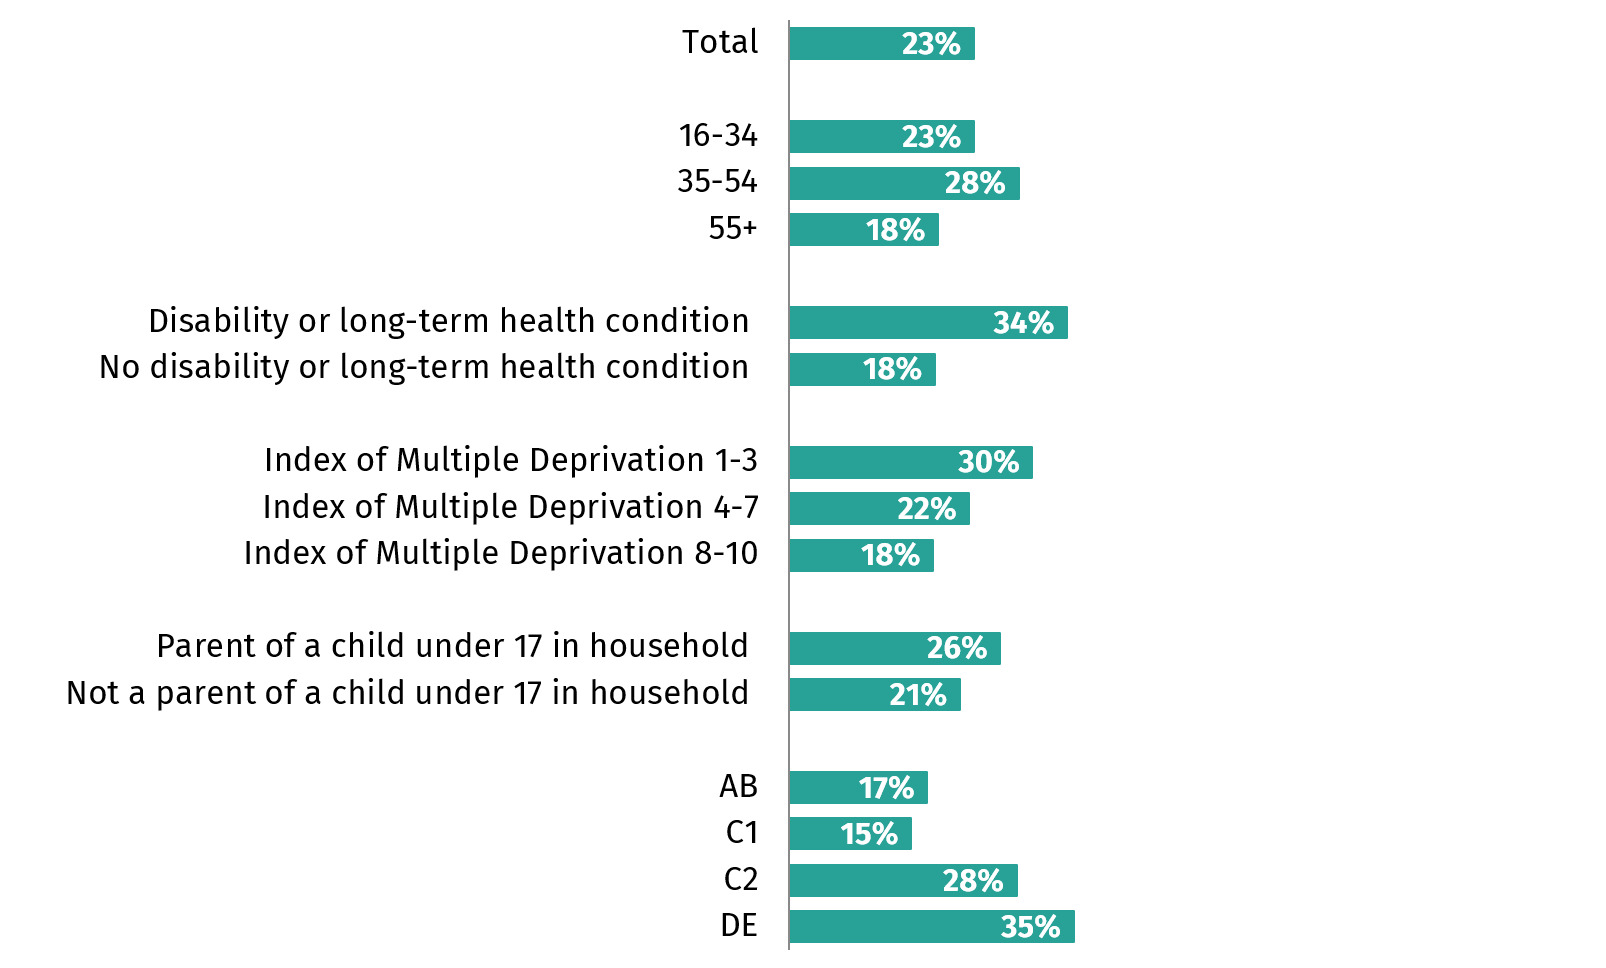
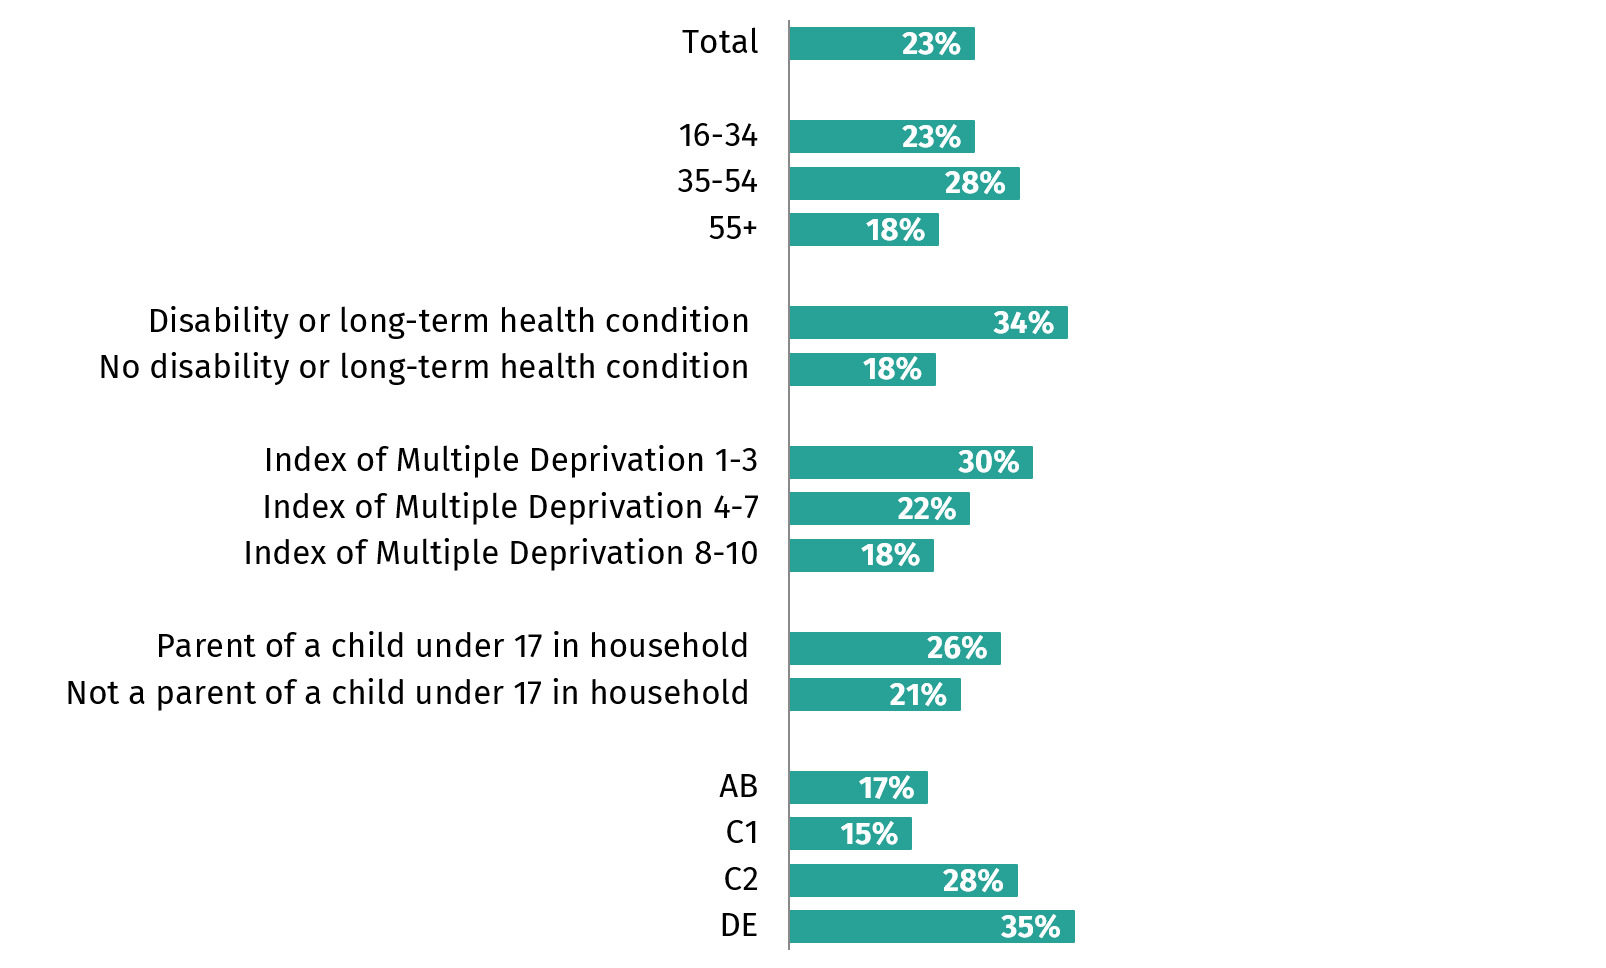
Respondents who have a disability or long-term health condition (34% compared to 18% of respondents without), in social grades C2 (28%) and DE (35% vs. 17% AB and 15% C1), live in the most deprived IMD deciles (1-3 - 30% vs. 8-10 18%), are in the middle age group (28% of 35-54s vs. 18% of those aged 55+) and who are parents of children under 17 (26% vs. 21% who are not) were more likely than others to report being worried about food affordability in March 2026 (Figure 3).
These groups were consistently the most worried about food affordability between April 2025 and March 2026.
Has trying to save money led to changes in food related behaviours?
Respondents were presented with a list of behaviours and asked whether they, or anyone in their household, had engaged in them in the past month to save money. In March 2026, the most common reported behaviours were eating food past its use by date (64%) and eating leftovers that had been kept in the fridge for more than two days (60%). The next most reported behaviours were cutting down on the amount of food bought (52%), reheating leftovers more than once to avoid throwing them away (39%) and turning off an oven or hob earlier and finishing cooking with residual heat (33%). These have consistently been the most commonly reported behaviours since tracking began in May 2025 (see Figure 4).
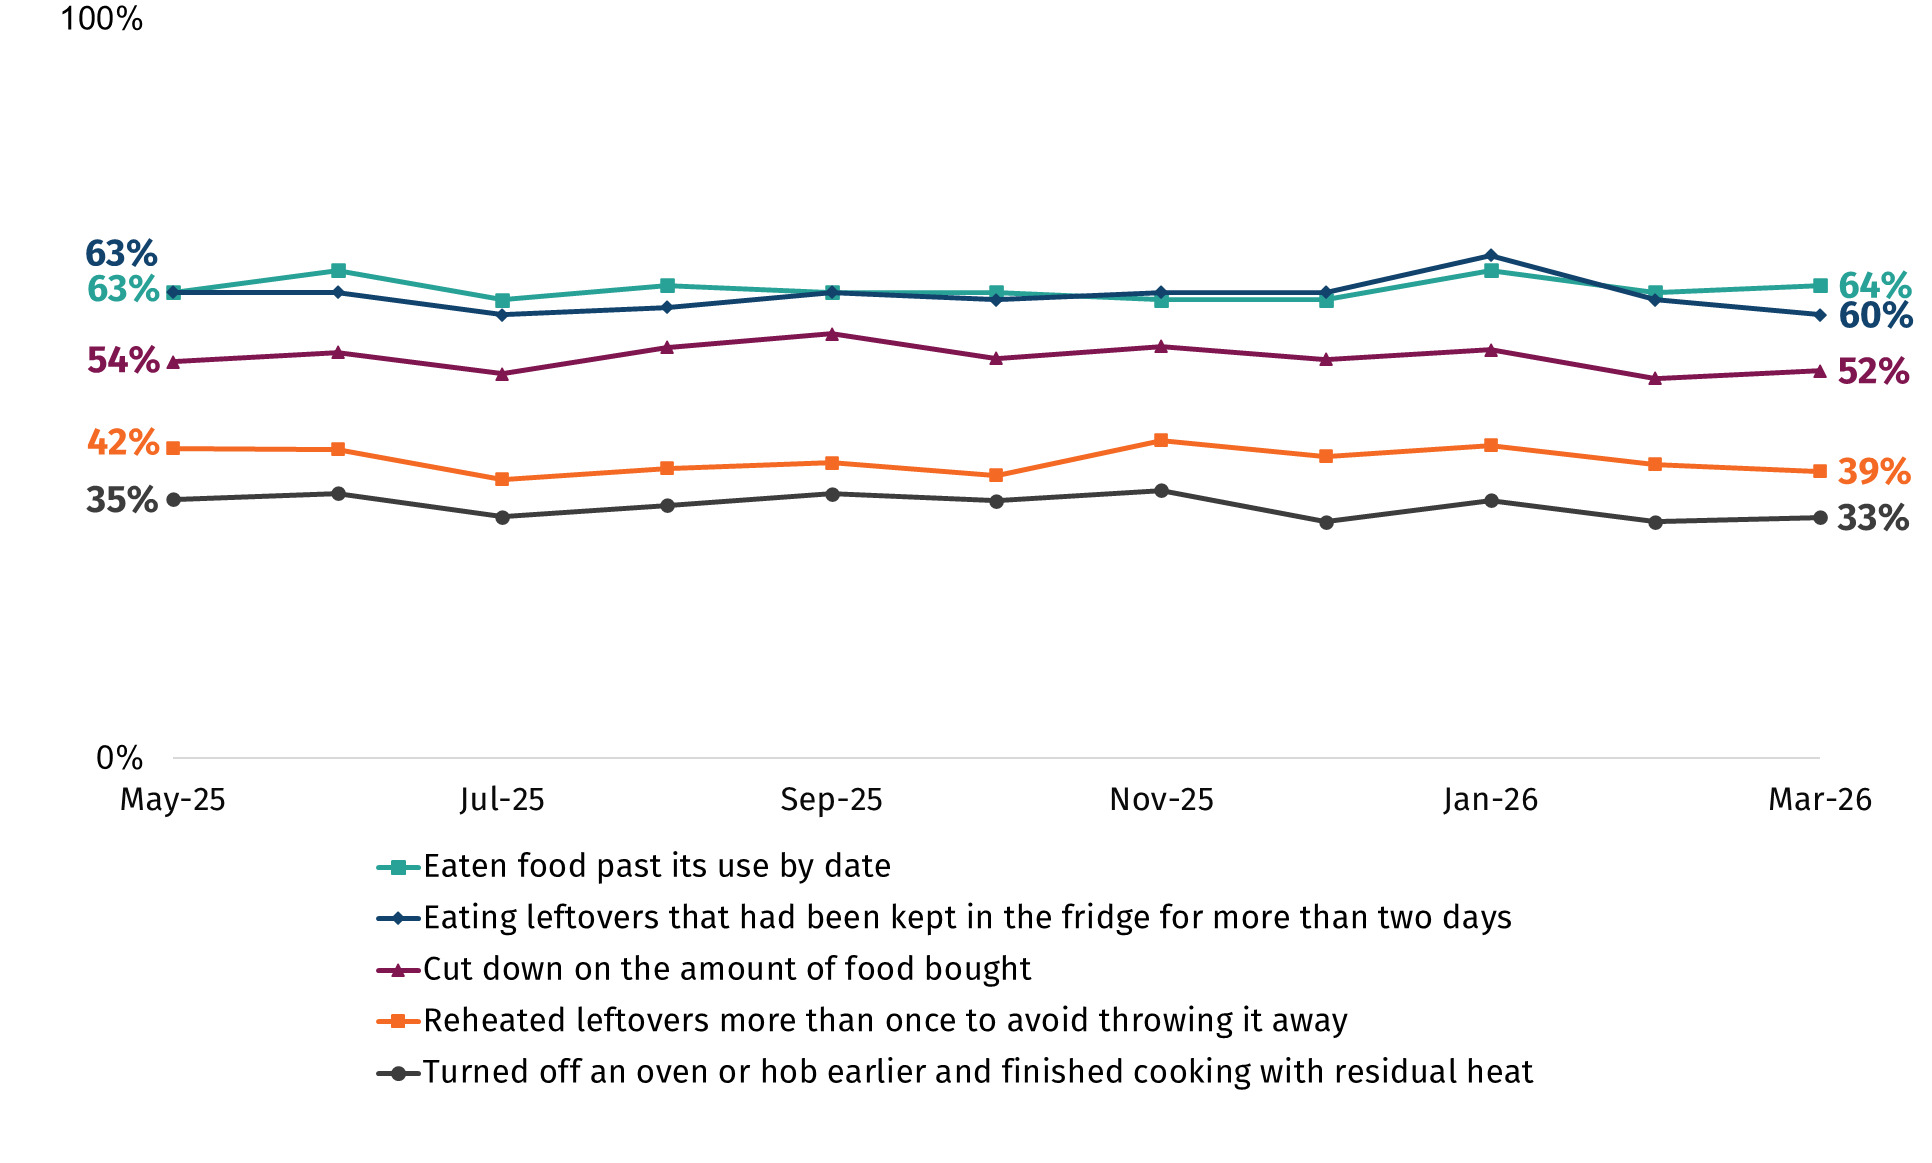
In January 2026 there was a slight increase in some of the behaviours asked about in the survey. This reflects actions respondents reported taking in December 2025. These then returned to more typical levels in February 2026. The behaviours that increased slightly were:
-
Eating leftovers that have been left in the fridge for more than two days (68% in January 2026 compared to 63% in December 2025)
-
Eating food past its use by date (66% in January 2026 compared to 62% in December 2025)
-
Eating food cold rather than heating it (29% in January 2026 compared to 24% in December 2025)
-
Storing food that should be refrigerated outside the fridge (21% in January 2026 compared to 14% in December 2025)
Other behaviours are asked about in the survey but are reported by fewer respondents and have remained broadly stable over time.
Awareness, trust and knowledge of the FSA
This section of the report explores respondents’ awareness, knowledge of, and trust in, the FSA, comparing results over time from August 2023 when comparable data is first available.
How many respondents reported knowing about the FSA?
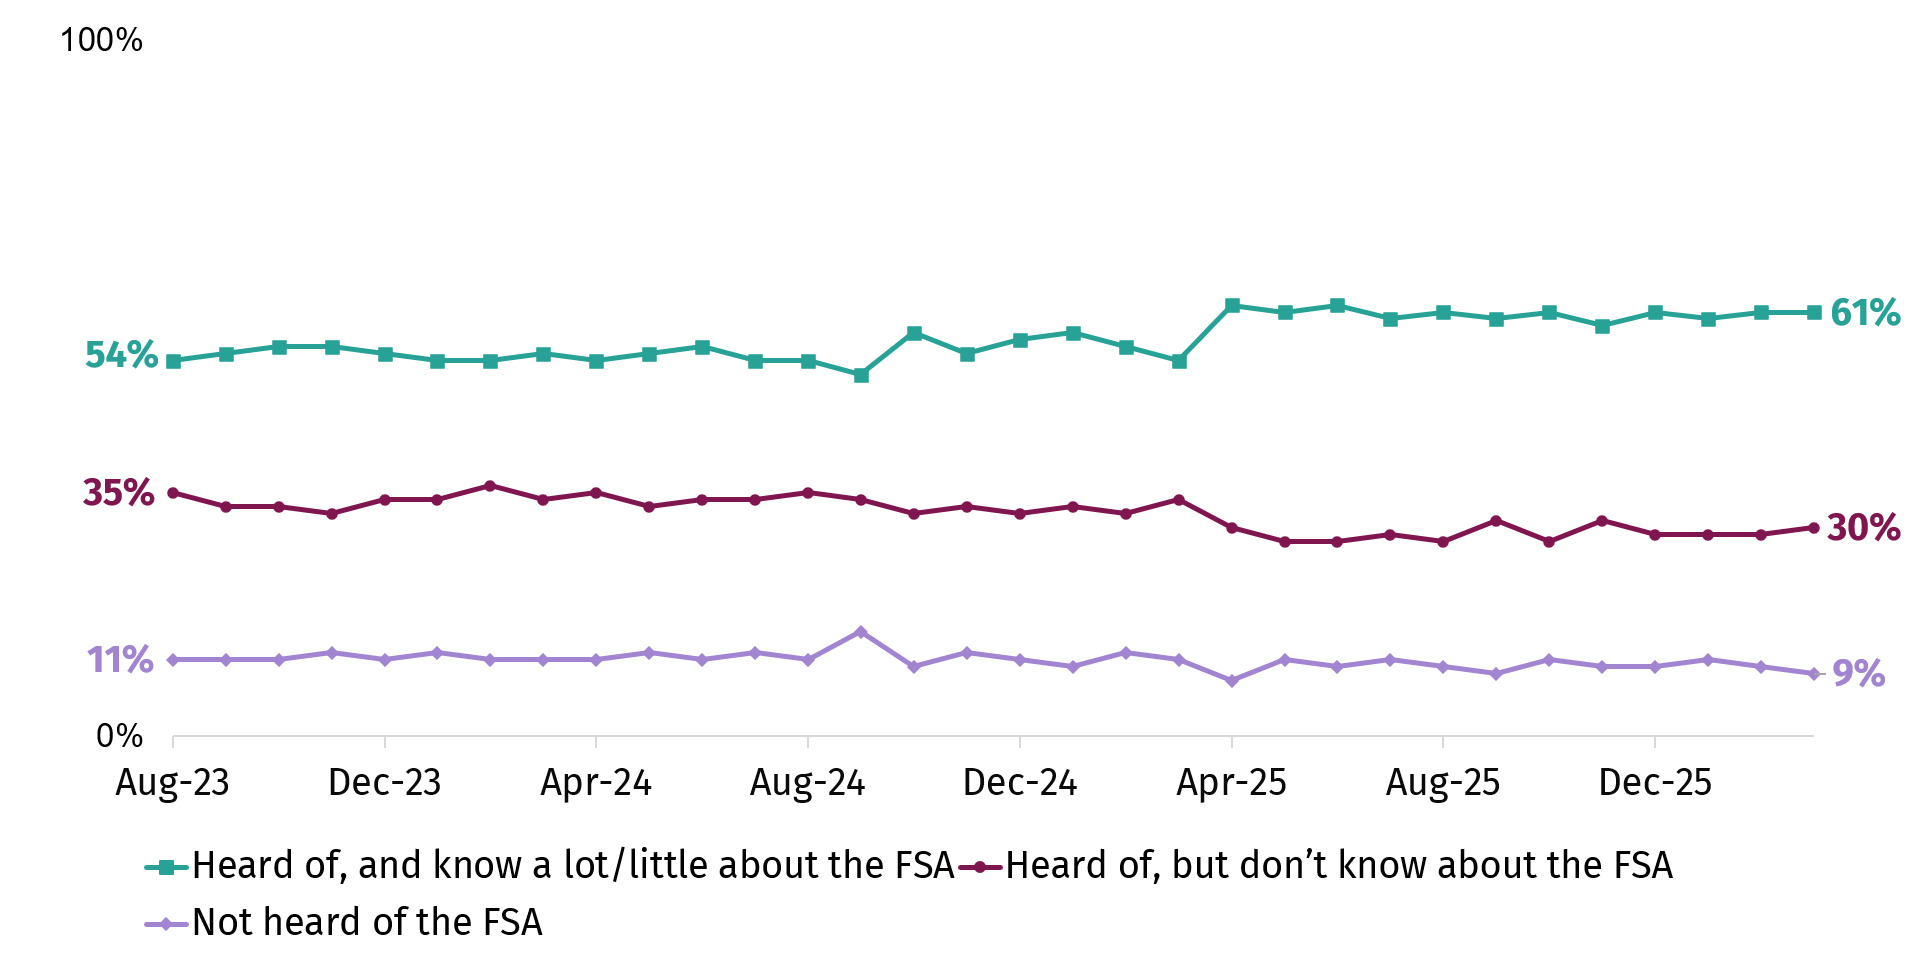
Awareness[11] of the FSA has been broadly stable over the past year (91% aware of the FSA in March 2026 and 92% aware in April 2025). This continues a trend since tracking began in August 2023 (89%).
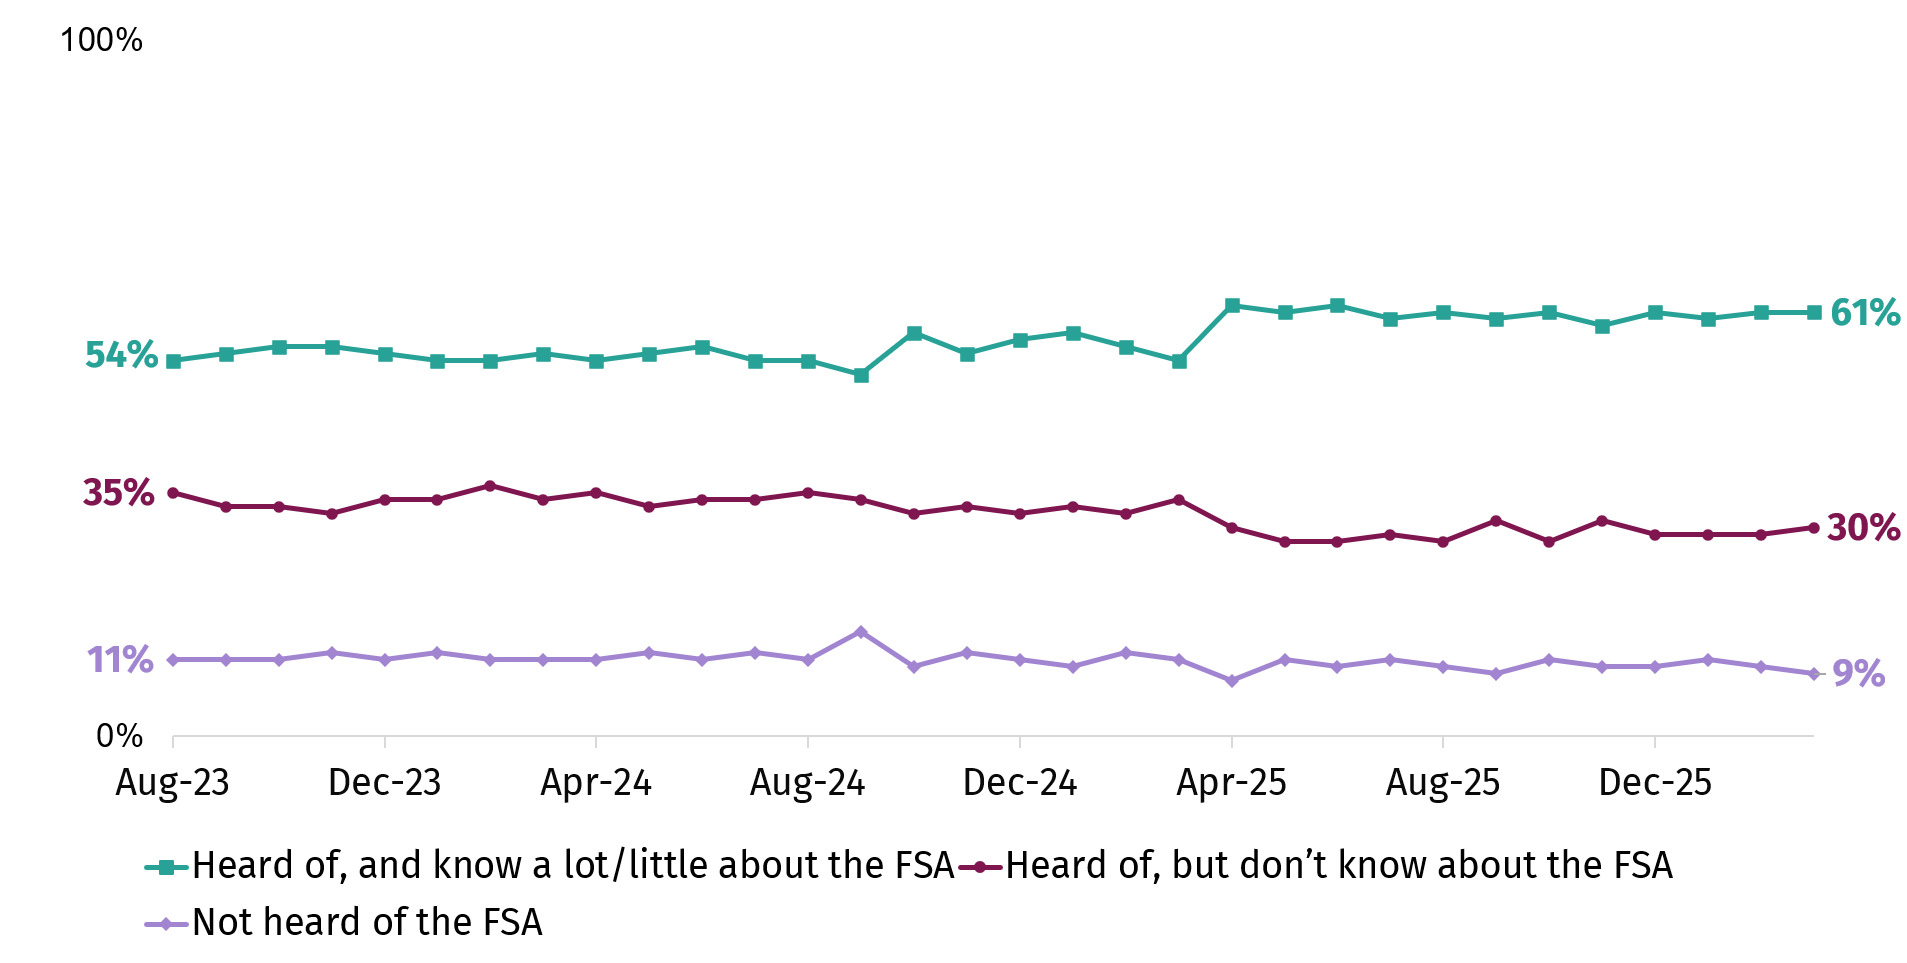
In March 2026, approximately three in five (61%) respondents stated they had at least some knowledge of the FSA (Figure 5); most of this group reported they know ‘a little’ (56%) compared with 4% who reported they know ‘a lot’. While the percentage who have some knowledge of the FSA remained stable between April 2025 (62%) and March 2026 (61%), it was slightly higher than in the previous year’s tracking (March 2025: 54%; April 2024: 54%). A minor change to one of the response options was introduced in April 2025 and then reversed from May 2025 onwards, which may explain the increase observed in April. However, it is notable that levels did not return to their previous baseline. Changes to other questions in the questionnaire were also were also implemented in this timeframe, which could be linked to the differences.[12]
Who was more likely to report knowing about the FSA?
Self-reported knowledge of the FSA has been consistently higher among certain groups over time. In March 2026, respondents aged 35-54 or 55+ (both 67% compared to 45% of those aged under 35), those surveyed in social grades AB (66% compared to 56% in social grades DE) and those who are not parents of child(ren) under 17 (63% compared to 57% who are) were more likely to report having knowledge of the FSA.
For the remainder of this section on trust, analysis is filtered to only include those with some knowledge of the organisation[13].
How has trust in the FSA changed over time?
Among respondents with some knowledge of the FSA and what it does, the percentage who trust the organisation has remained comparable between April 2025 (61%) and March 2026 (60%), although there have been some monthly fluctuations (Figure 6). Trust in the FSA has also remained stable since tracking began in August 2023 (60%).
The percentage who reported that they do not trust the FSA has been more consistent over time and remains low (ranging from 5% to 8%).
.png)
Which groups expressed lower levels of trust in the FSA?
In March 2026, there were some groups less likely to say they trust the organisation, including[14]:
-
Respondents aged 55+ (50%), compared to 67% of those aged 35-54 and 70% of those surveyed aged 16-34
-
Respondents in social grades DE (53%), compared to 62% of those in social grades AB
Food safety information encountered in the last month
This section of the report explores the food safety information seen, read and heard by respondents in the last month, and where the information was encountered.
Have respondents heard about food safety information?
In April 2025, two new questions were added to the tracker to measure whether respondents have seen, read or heard something about food safety information in the previous month and the sources of this information.
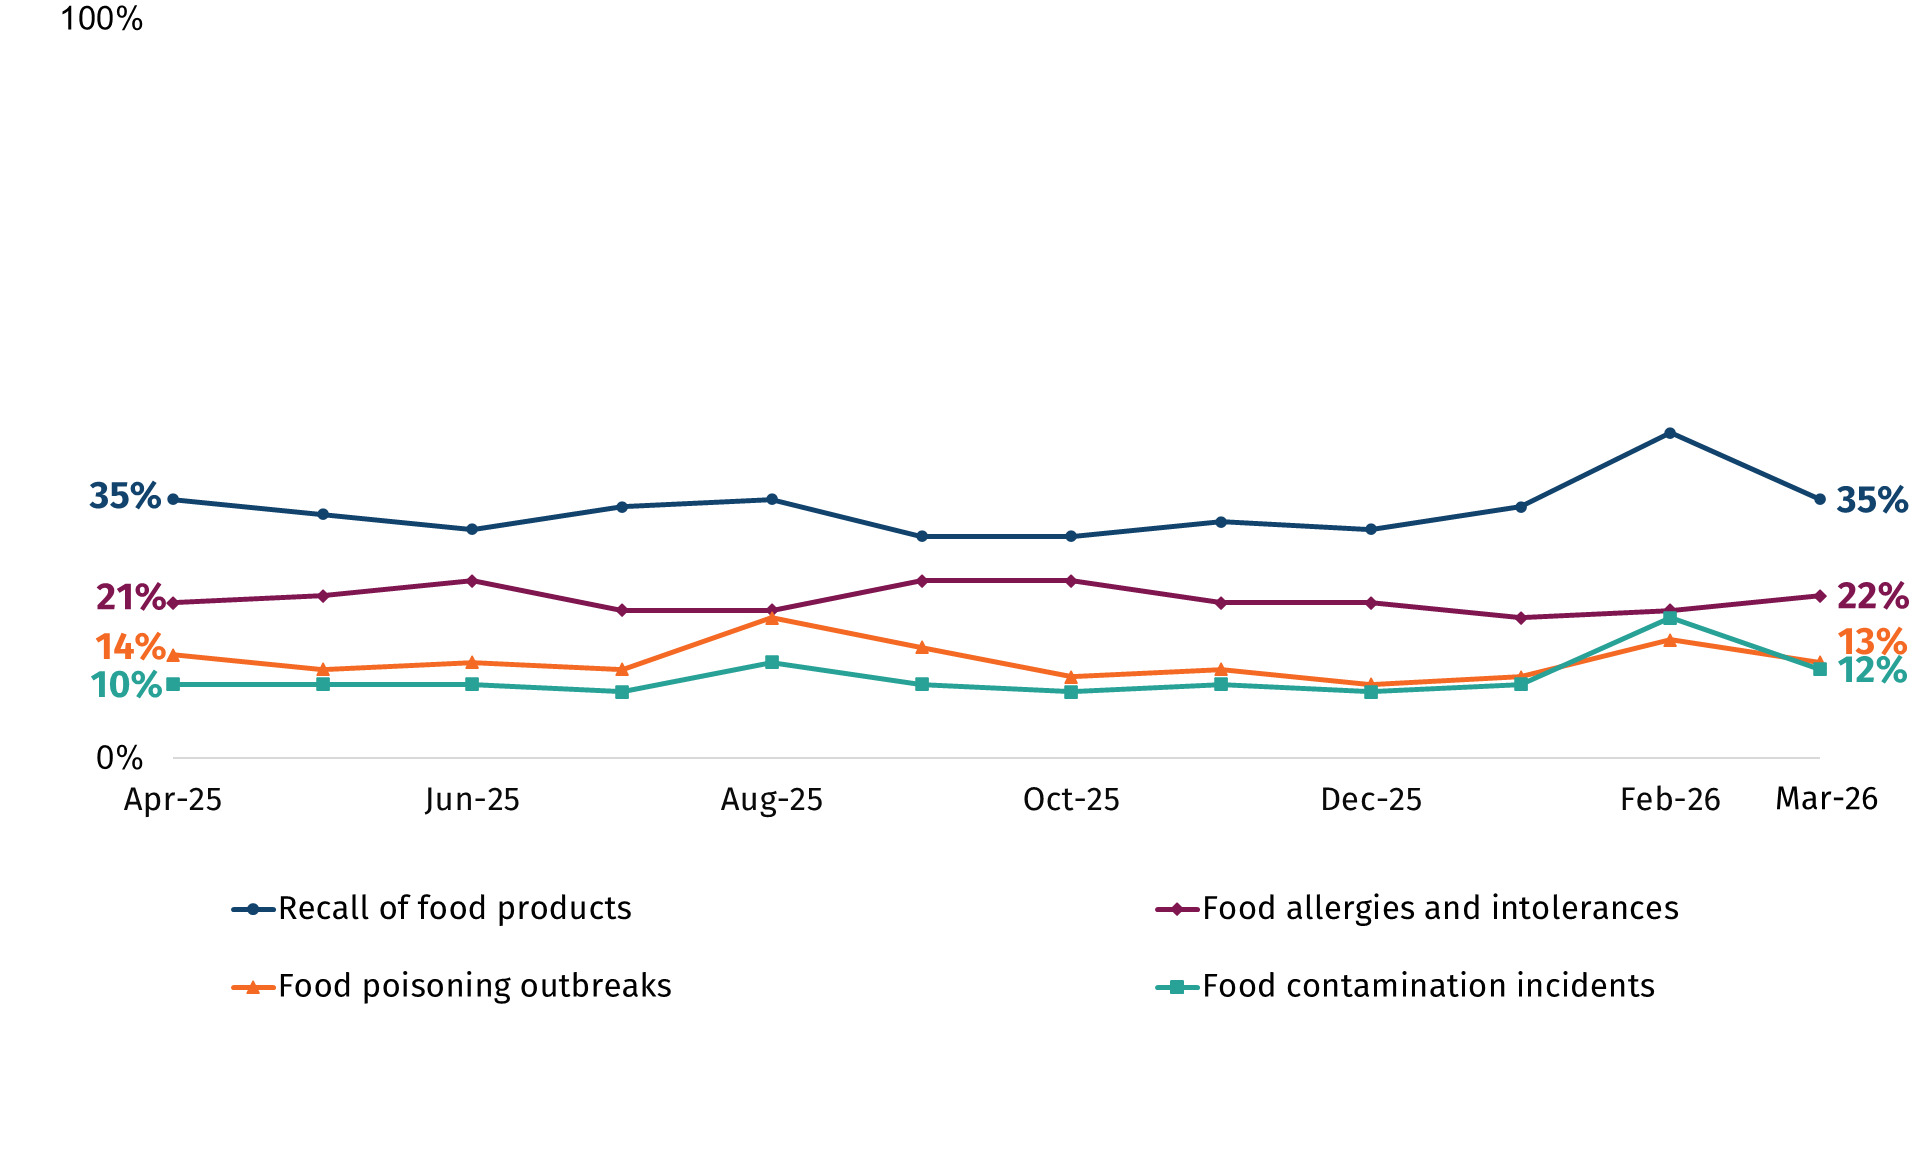
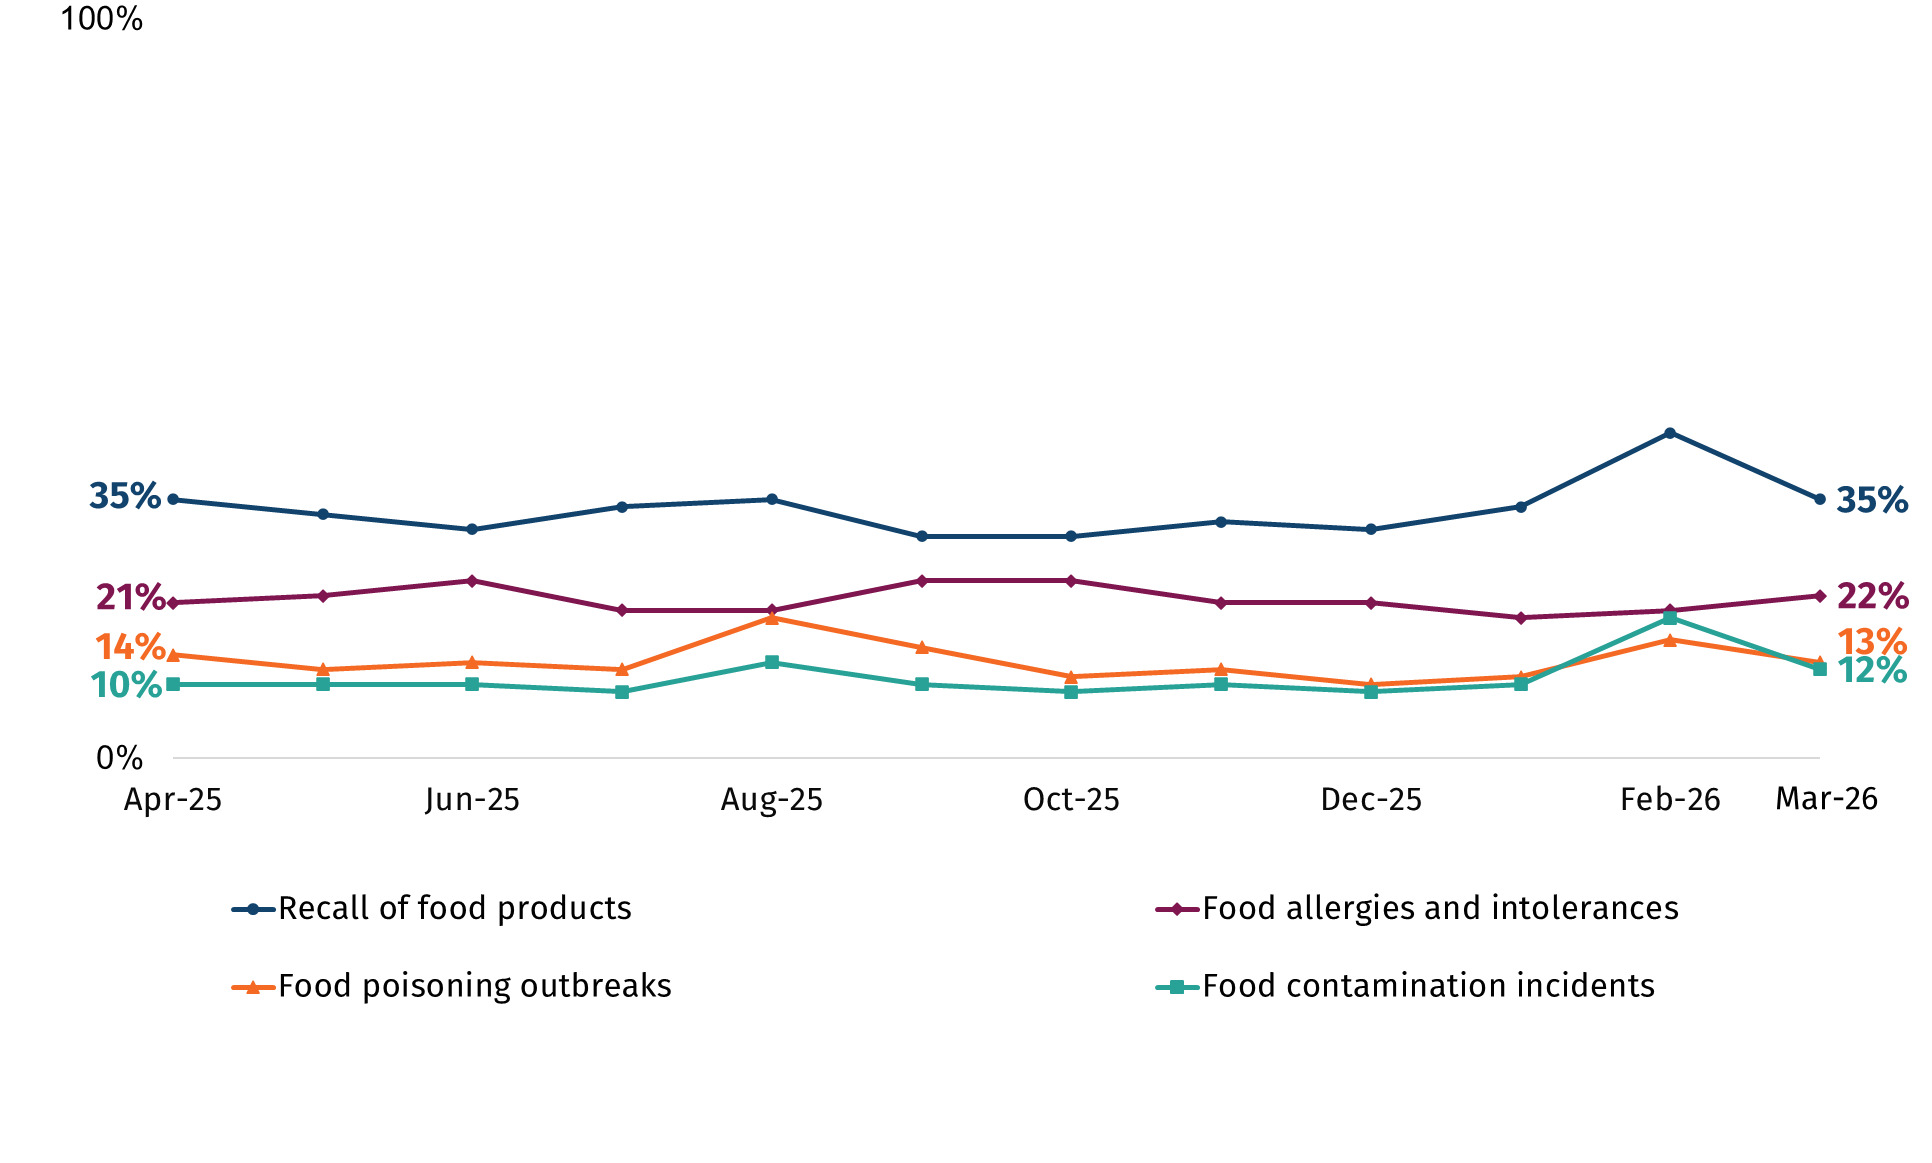
Respondents were prompted with a list of food safety topics and asked whether they had seen, read or heard anything about them. The most commonly recalled topic was ‘recalls of food products’ (35% in March 2026), followed by ‘food hygiene ratings of businesses’ (31%), and ‘food allergies and intolerances’ (22%). Forty percent of respondents reported they had not seen, read or heard about any of the topics.
How has the percentage who have seen, read or heard about food safety topics changed over time?
There has been some fluctuation in the percentage who reported they had seen, read or heard of recalls of food products (when prompted). There was a notable increase between January (34%) and February 2026 (44%), before falling to 35% again in March. During this period, there was also a slight increase in the percentage who recalled seeing, reading or hearing about food contamination incidents (rising from 10% in January 2026 to 19% in February 2026), and food poisoning outbreaks (rising from 11% in January 2026 to 16% in February 2026) (Figure 7).
When looking at the percentage who reported seeing, reading or hearing about food allergies and intolerances this has also fluctuated over time. There was a slight increase in the percentage who reported this in June 2025 (24%), before slightly declining in July 2025 (20%). This slightly increased again in September 2025 (24%) and slightly declined in November 2025 (21%) (Figure 7).
Other topics are asked about in the survey, and reported awareness of these have remained broadly stable over time:
-
Food hygiene ratings of businesses (range between 27% and 31%)
-
Food storage guidelines (e.g., refrigeration, use by dates) (range between 12% and 16%)
-
Safe food handling practices (e.g., washing hands, cooking temperature) (range between 13% and 15%)
-
Food fraud or food crime (range between 5% and 8%)
Where did respondents hear about food safety topics?
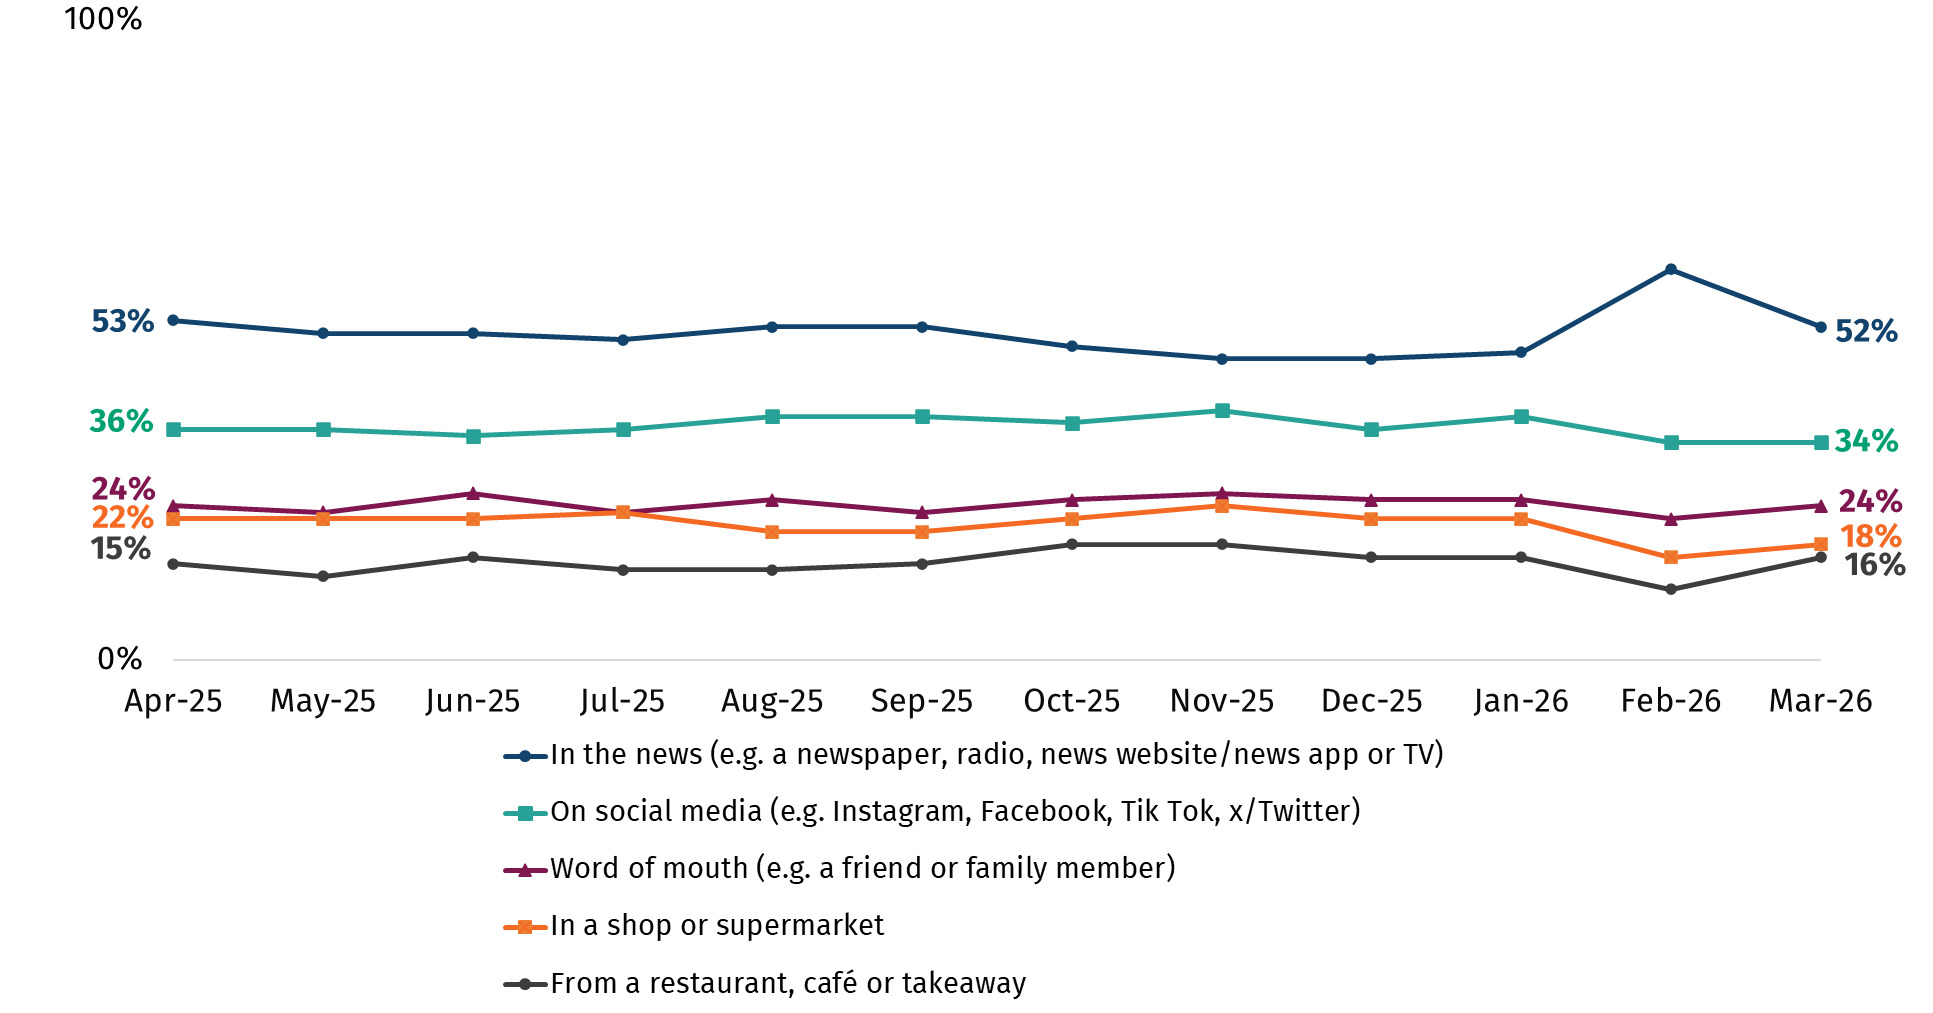
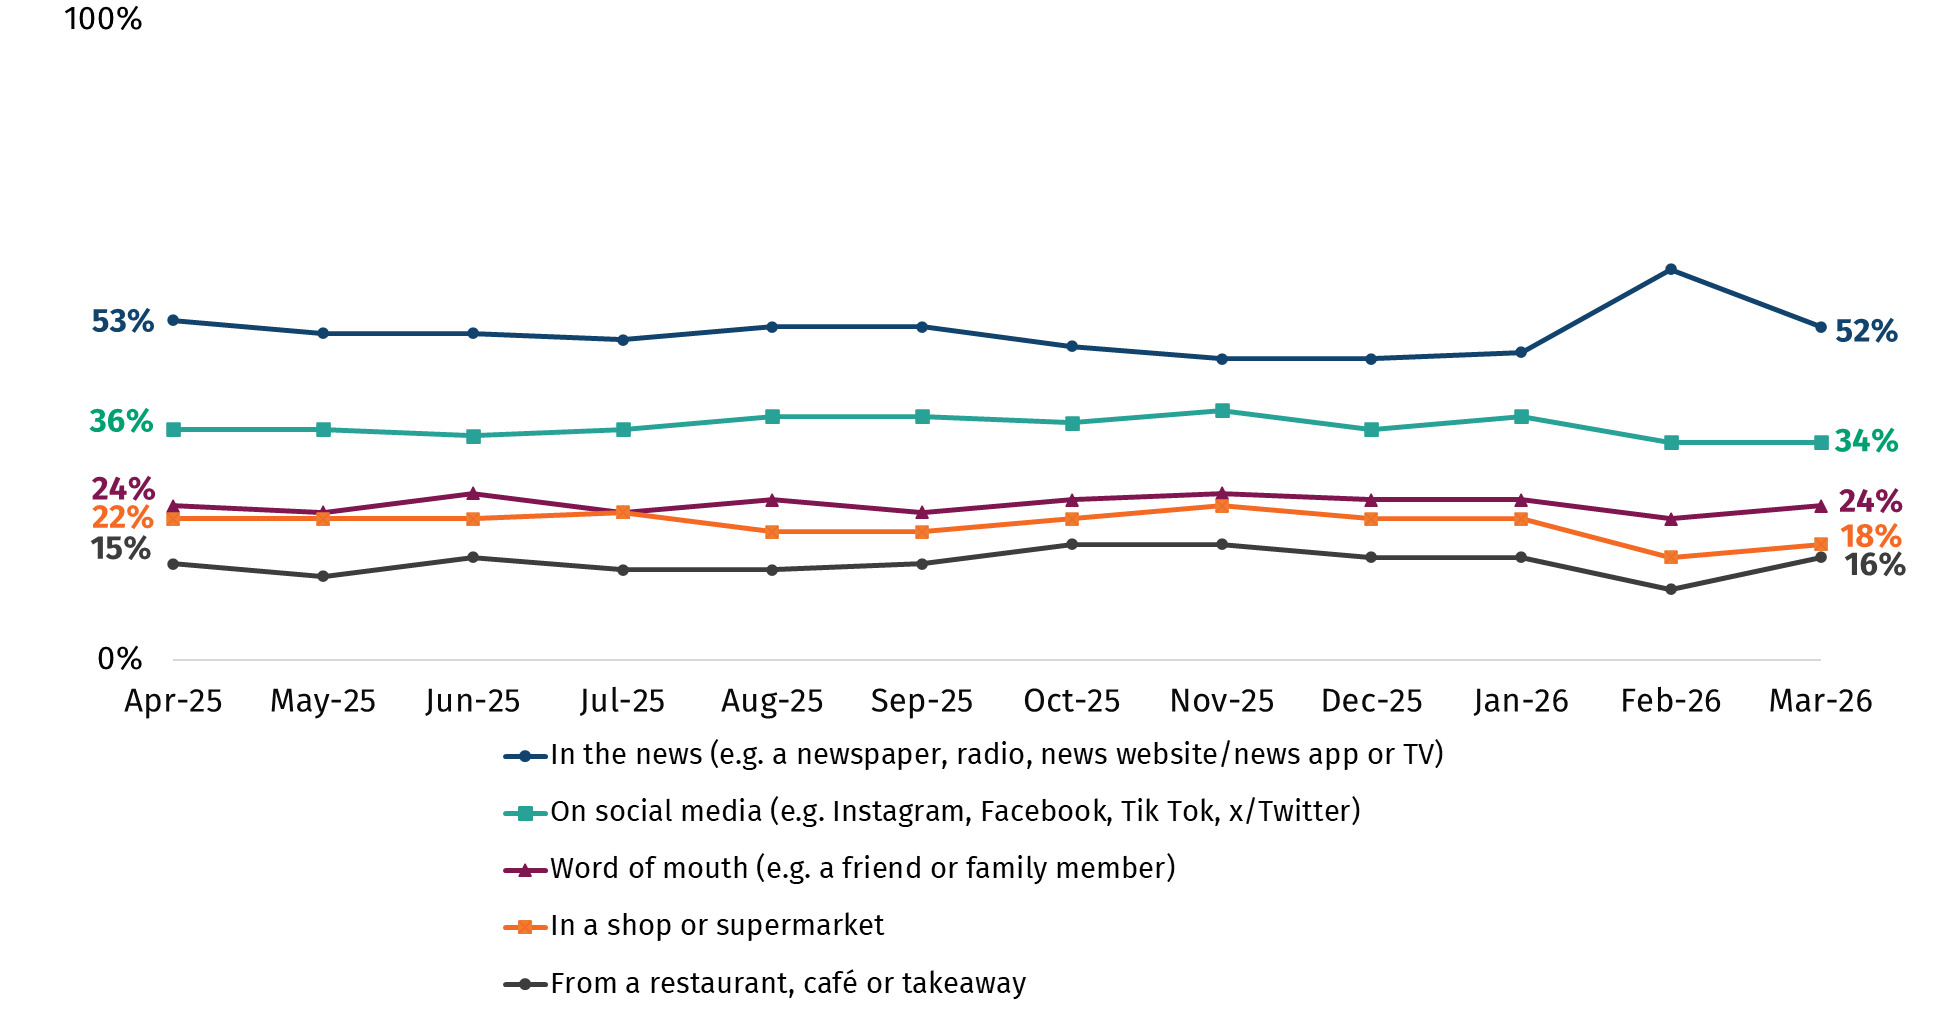
Respondents were most likely to report coming across food safety topics ‘in the news’, ‘on social media’ and through ‘word of mouth’; consistent between April 2025 and March 2026. In March 2026, around half (52%) of respondents who had heard of at least one of the topics said they had heard about it in the news, a third (34%) said they had heard of them on social media and a quarter (24%) by word of mouth (Figure 8).
In February 2026, there was a notable increase in the percentage who reported they had seen, heard or read about any of the topics ‘in the news’ (from 48% in January 2026 to 61%). This returned to a more typical level in March 2026 (52%).
Novel foods and food production techniques
The following section presents findings from a range of questions on novel foods and food production techniques including precision breeding, precision fermentation, cell-cultivated products and cannabidiol (CBD). These questions are only included in the survey every 6 months. The findings presented for each topic relate to the most recent time those questions were asked (up to March 2026). These dates vary for each topic.
How has awareness of precision breeding changed over time?
“Precision breeding” refers to a range of scientific techniques that can be used to make changes to plant or animal DNA that could have happened through traditional breeding but can now be done more quickly or precisely. It has the potential to help create plants and animals that are more disease-resistant, require less water, and have higher nutritional value, amongst other outcomes. Currently there are no crops or animals resulting from precision breeding technology that have been authorised for sale as food or animal feed in the UK.
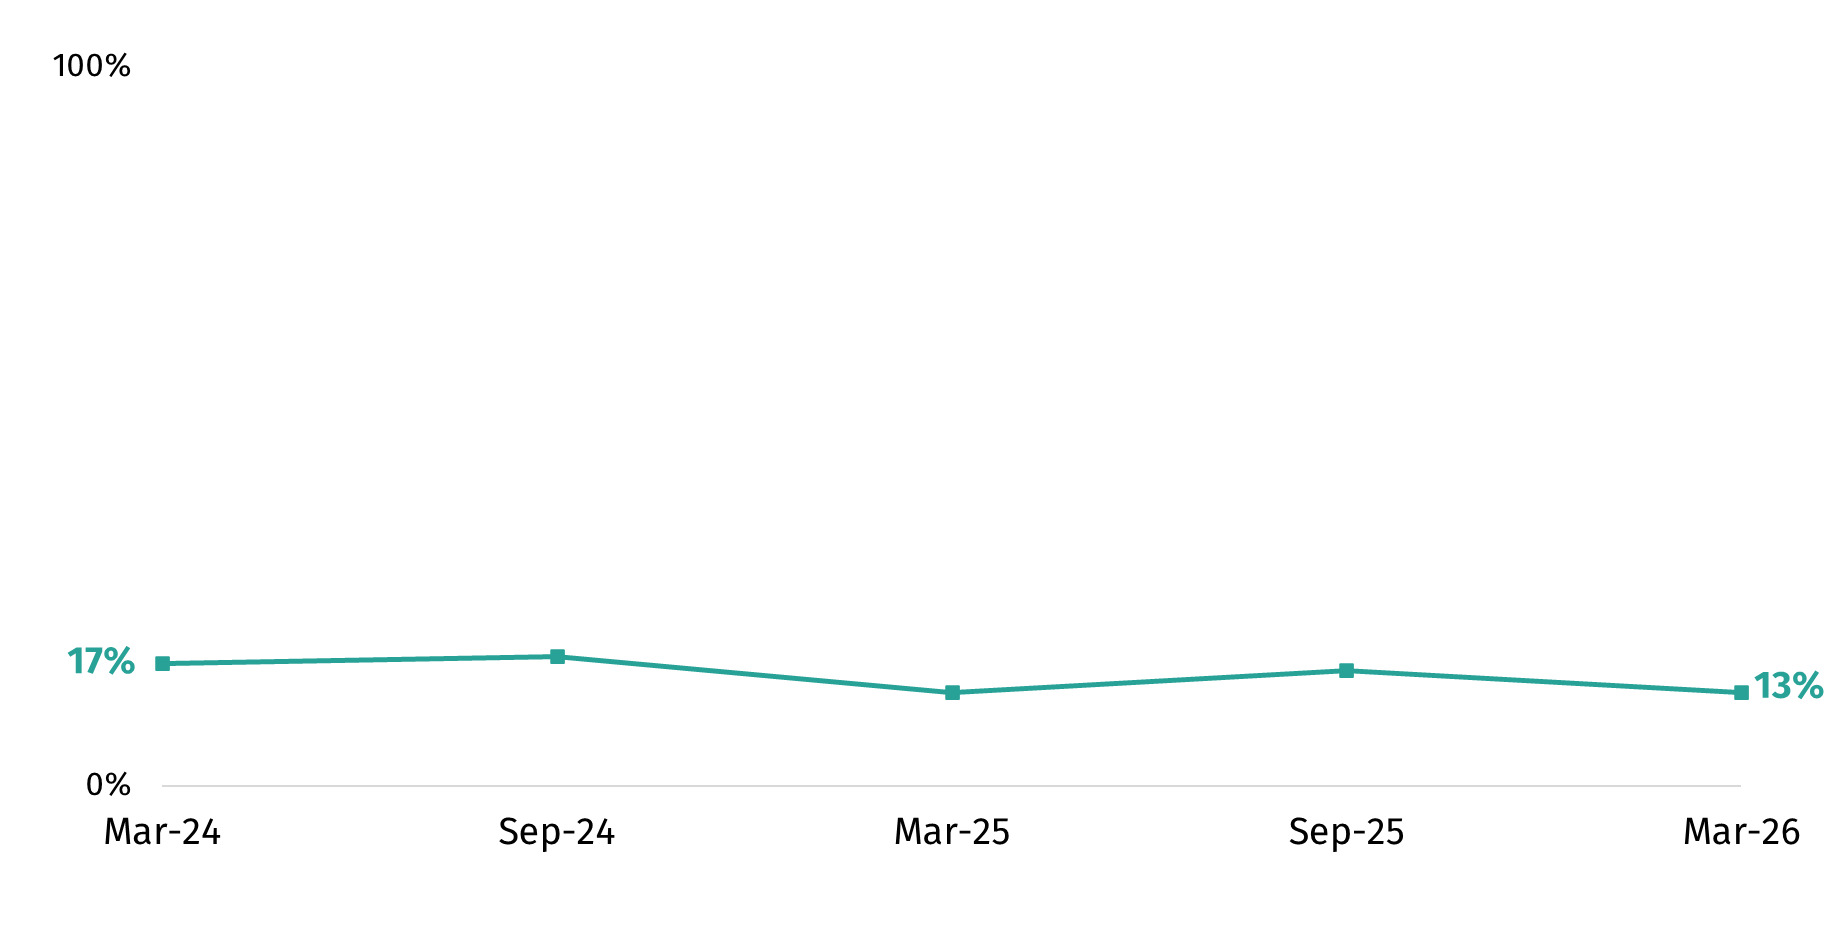
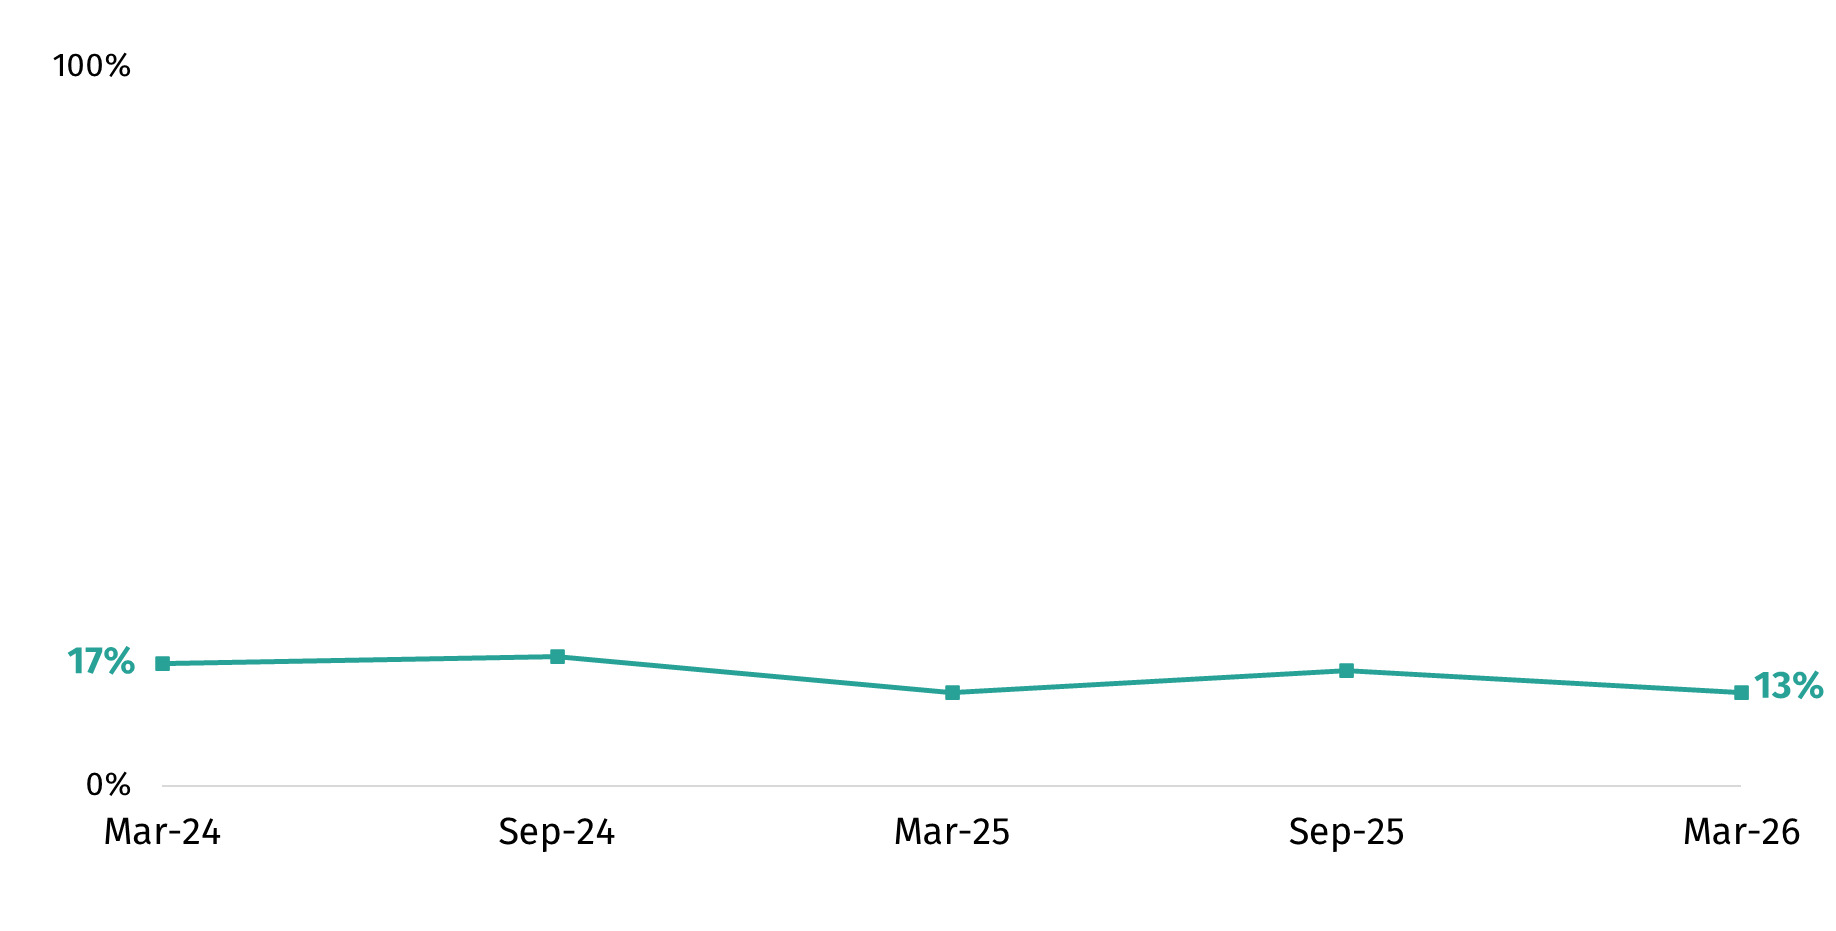
In March 2026, one in seven (13%) respondents said they had heard of precision breeding before. This included 5% who said they know what it is and 9% who had heard of it but did not know what it is. Awareness of precision breeding has fluctuated slightly over time between March 2024 and March 2026 (range between 13% and 18% - Figure 9).
Did respondents think precision breeding is acceptable?
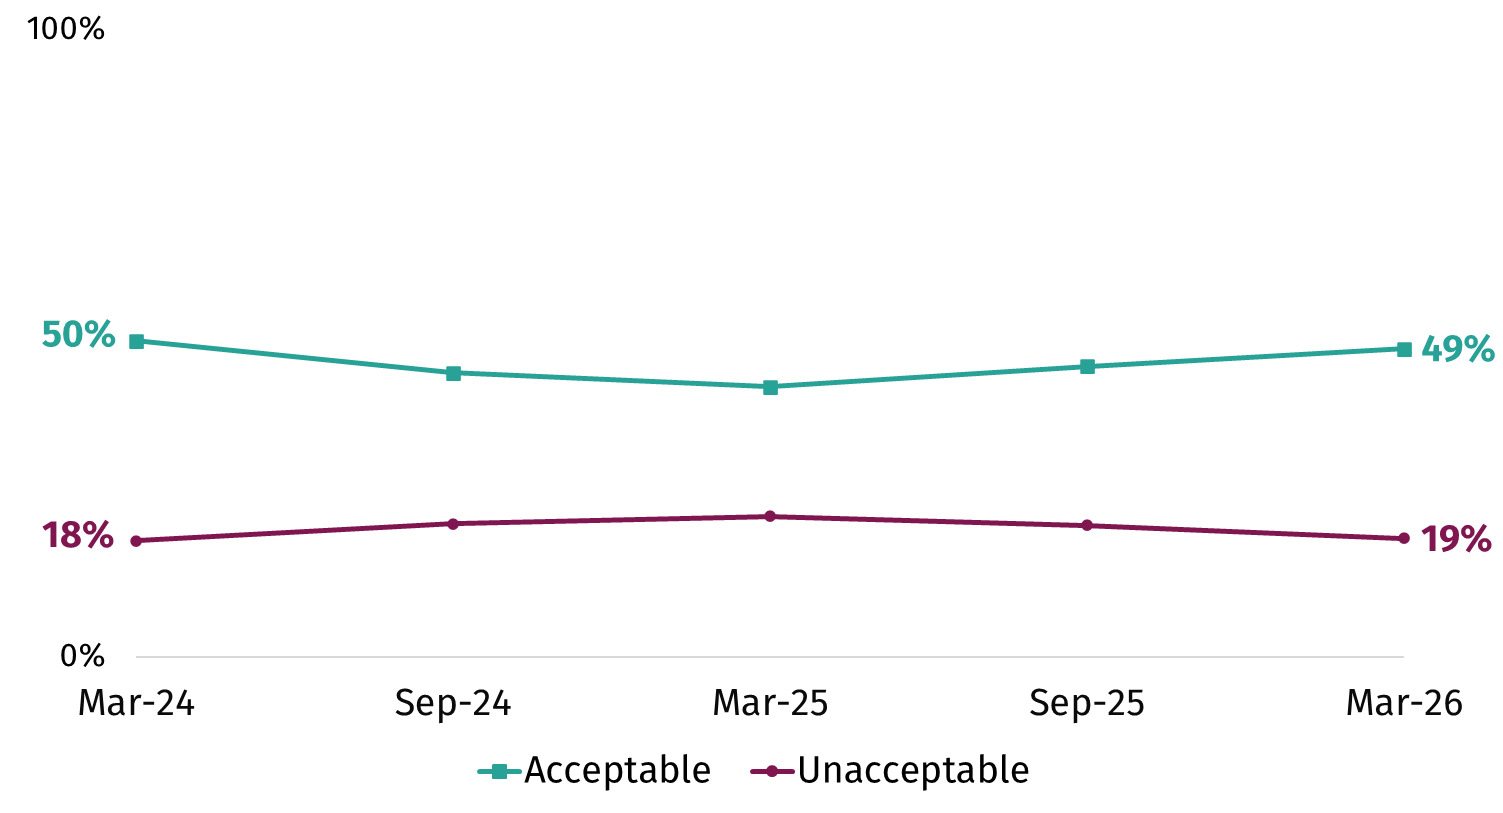
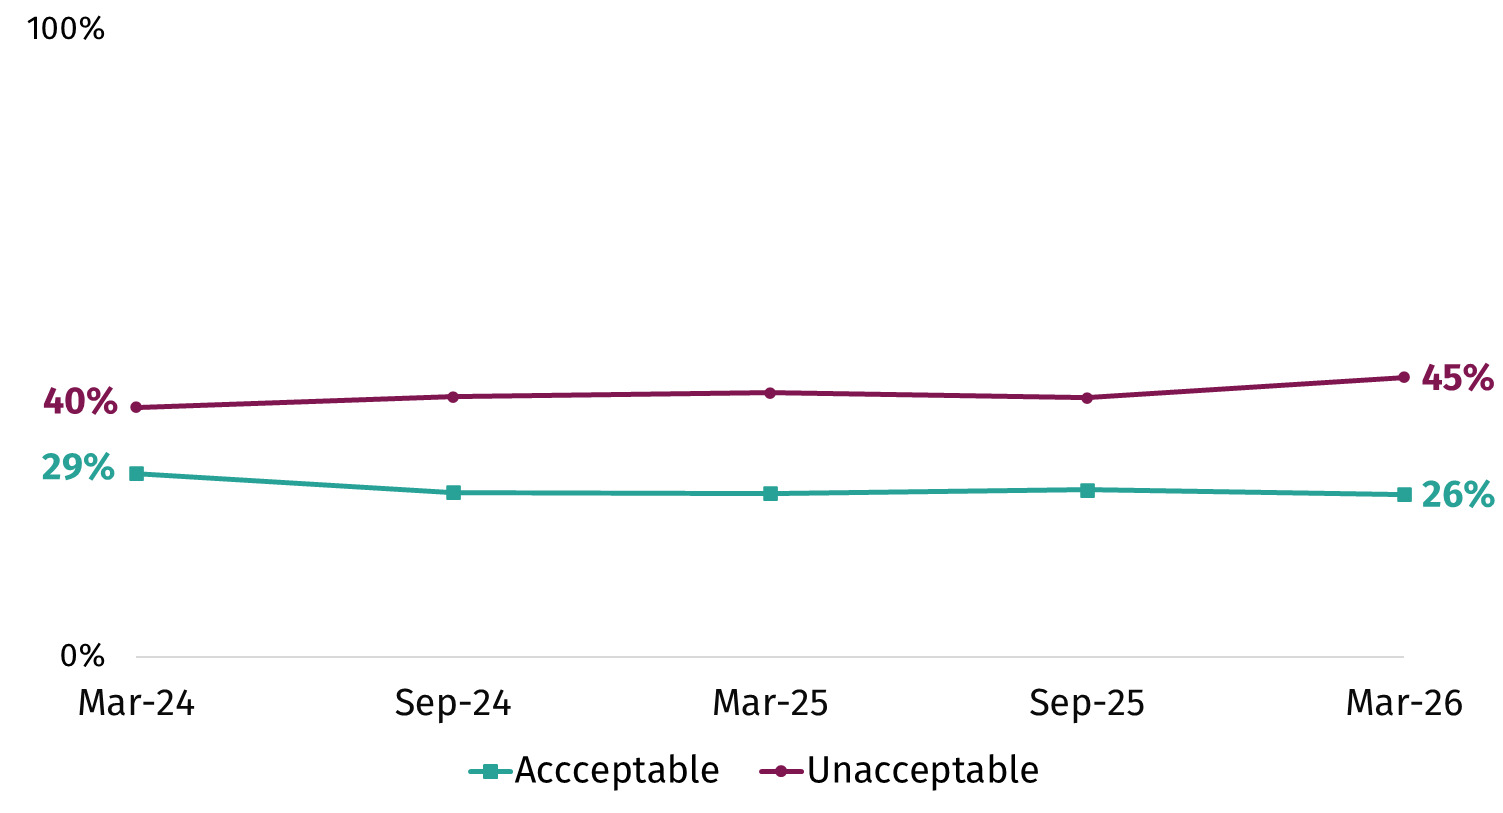
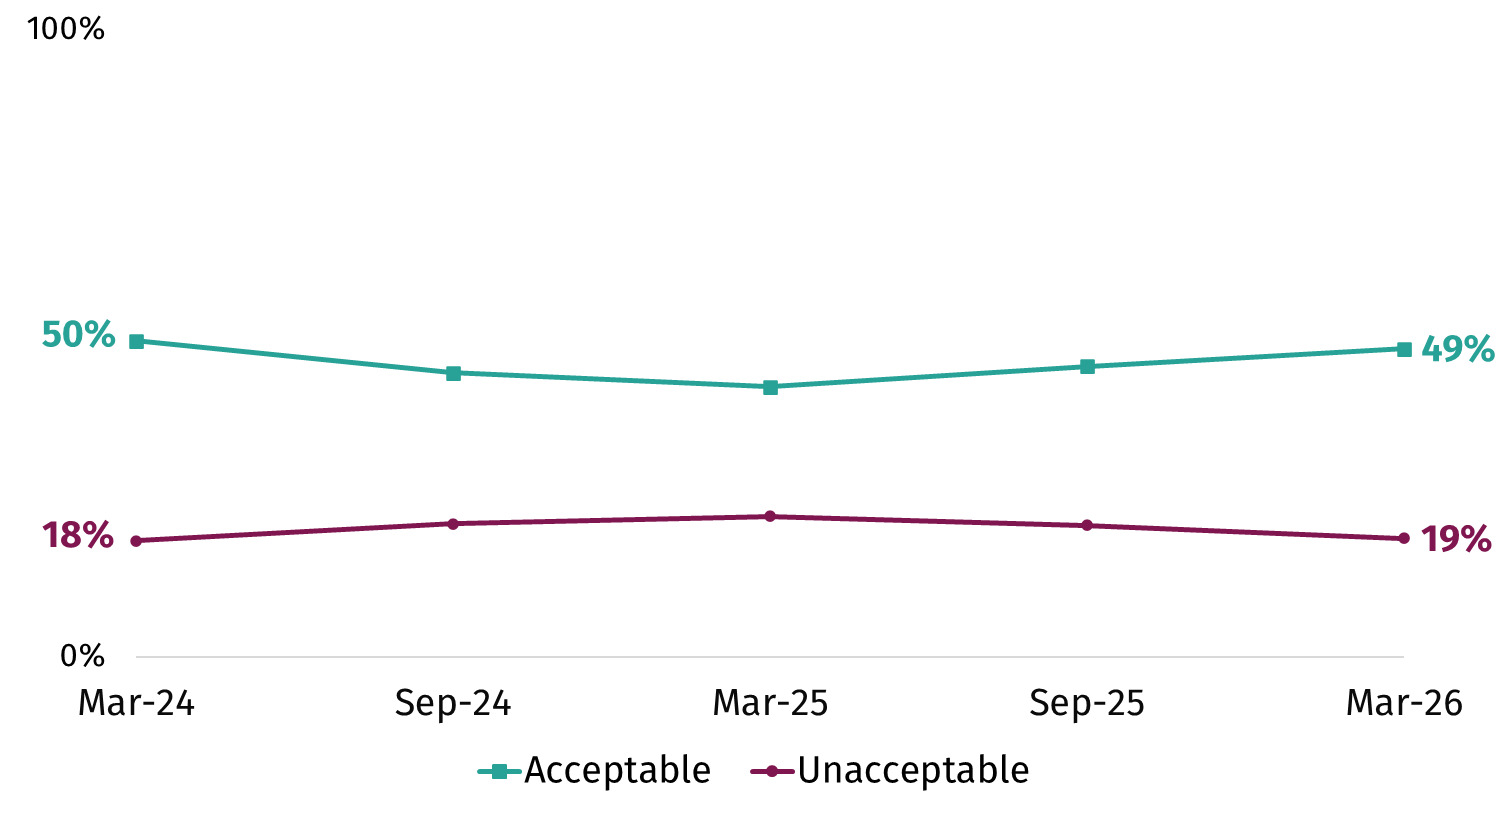
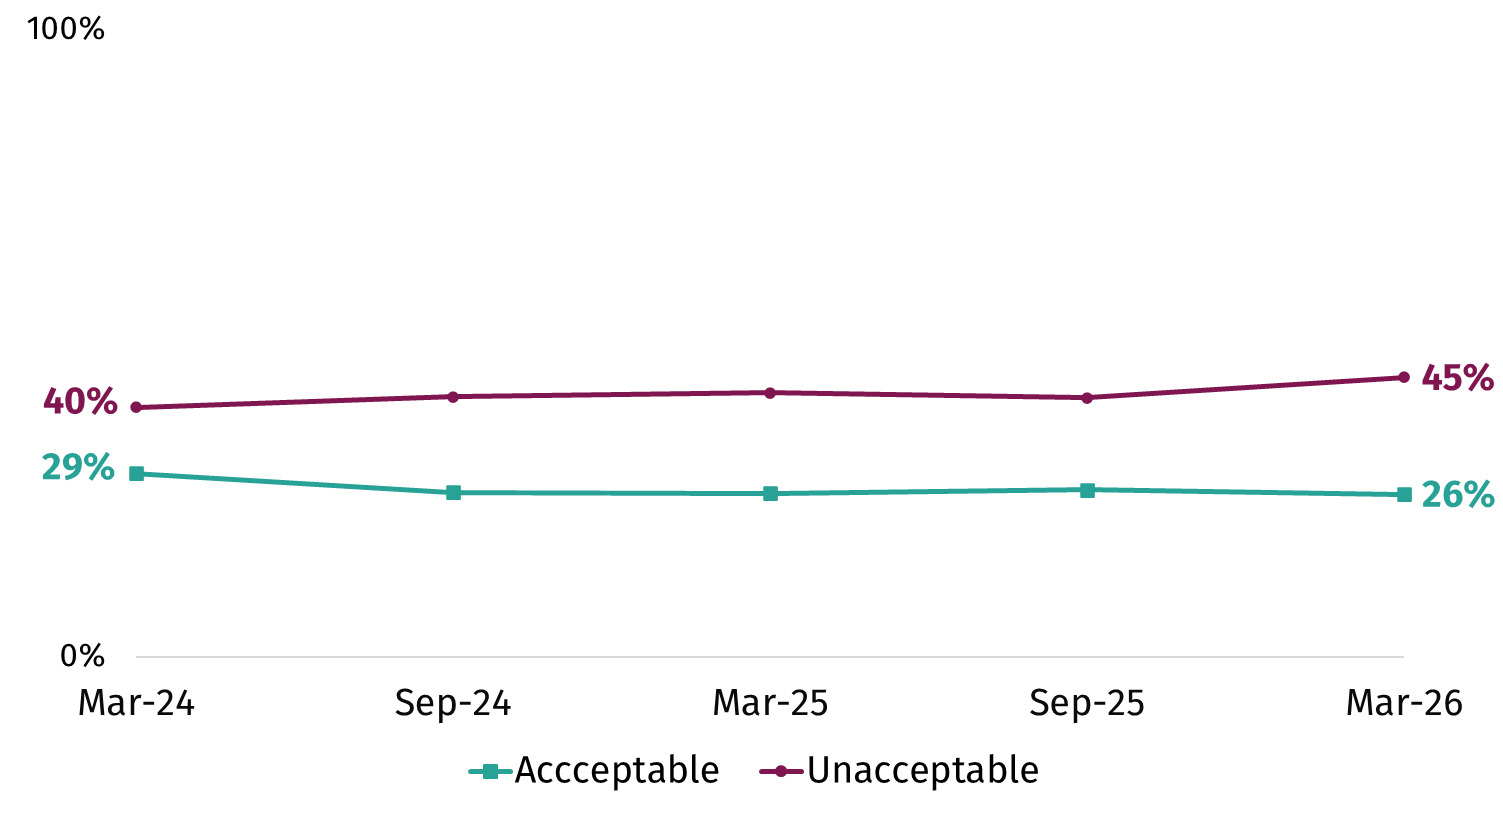
In the survey, respondents were shown a definition of precision breeding and then asked how acceptable or unacceptable they found its use in plants and animals. In March 2026, precision breeding of plants (49%) was more likely to be seen as acceptable than precision breeding of animals (26%). This pattern has been consistent since tracking began in March 2024.
When thinking about precision breeding of plants, a higher percentage of respondents thought this was acceptable (49%) than unacceptable (19%), with a further 32% not having an opinion either way or reporting they didn’t know.[15] This pattern has also been consistent since tracking began (Figure 10).
When thinking about precision breeding of animals, a higher percentage thought this was unacceptable (45%) than acceptable (26%). A further 30% did not have an opinion either way or said they did not know. This pattern has also remained consistent over time (Figure 11).
Had respondents heard of precision fermentation?
Precision fermentation is a modern form of the traditional fermentation process. Fermentation has been used for centuries to produce things known to the public, like beer or yoghurt. Precision fermentation is different because scientists program microbes (tiny living organisms like yeast or bacteria) to make new, specific food ingredients. These include proteins, sugars and fats. These foods are created without using animals or plants.
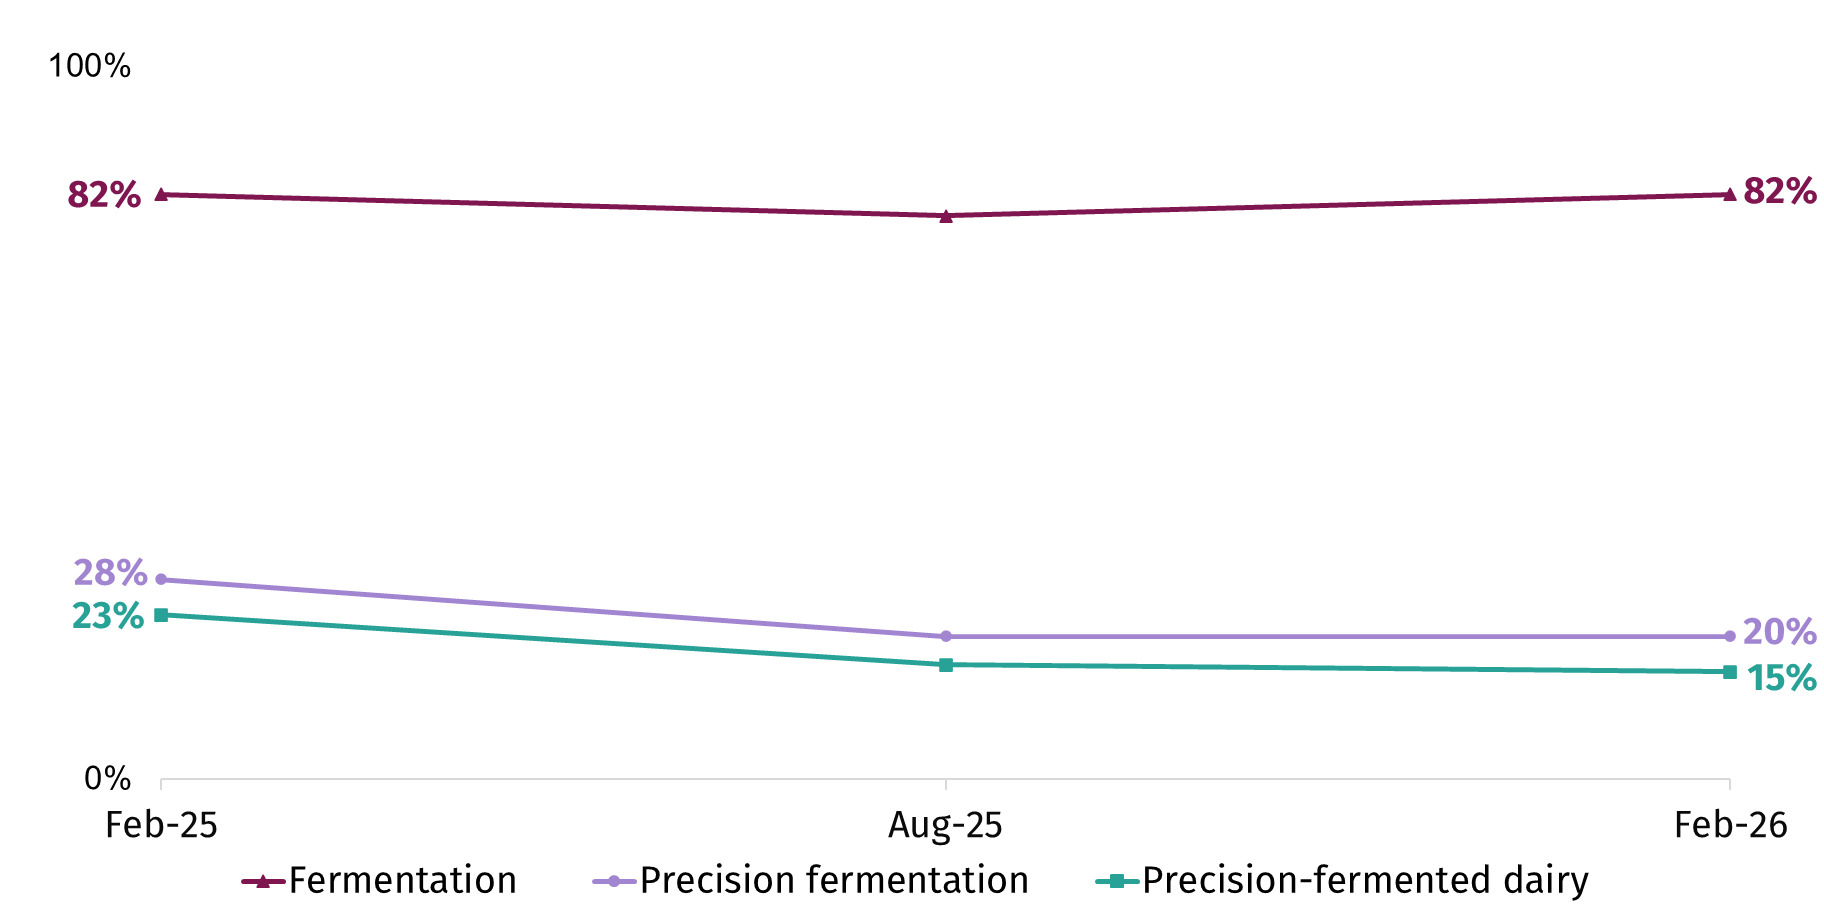
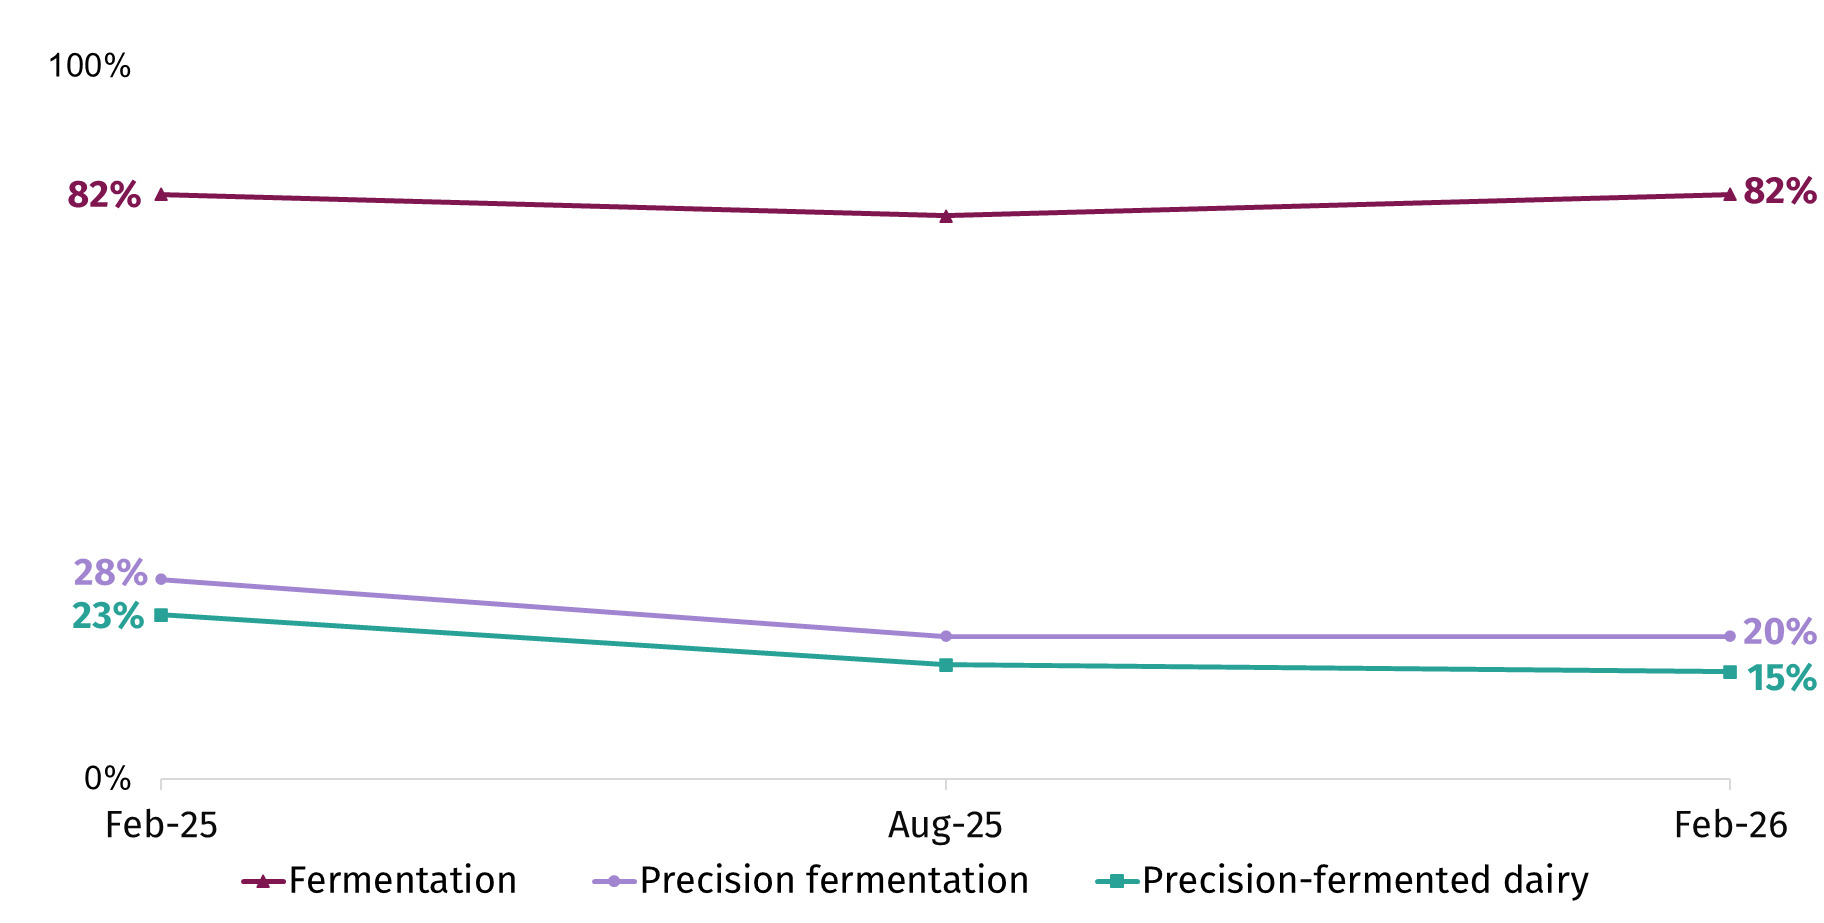
When last asked in February 2026, most respondents (when prompted with definitions) said they had heard of fermentation (82%), with the majority of this group saying they knew what it was (66%). Fewer had heard of precision fermentation (20%) and precision fermented dairy (15%). Awareness of both precision fermentation and precision fermented dairy has decreased slightly over time (Figure 12): precision fermentation (28% to 20% between February 2025 to 2026) and precision fermented dairy (23% to 15% in the same time period).
What did respondents think about the sale and consumption of precision-fermented products?
Views were mixed around the sale and consumption of precision-fermented dairy. In February 2026, similar percentages said it should (26%) and should not (30%) be on sale in the future. A sizable percentage (44%) said they did not know.
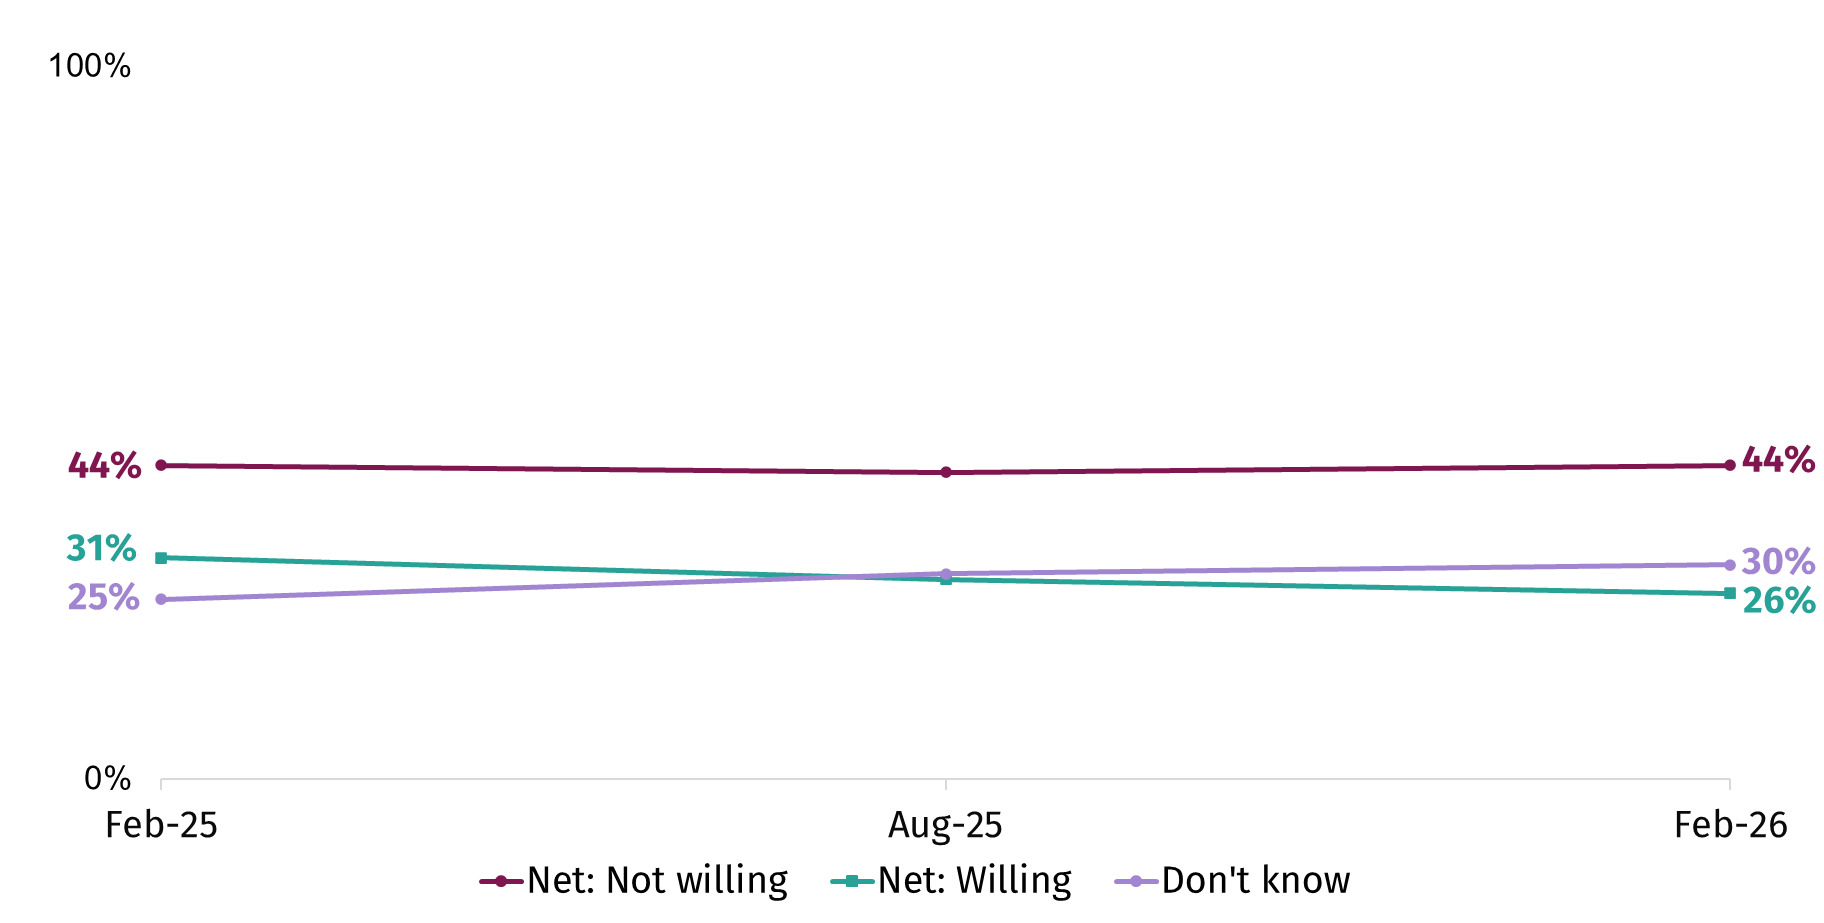
Around one in four (26%) said they would be willing to include precision-fermented dairy products in their diet if authorised for sale in the UK; this decreased slightly from 31% in February 2025 (Figure 13). A higher percentage (44%) said they would not be willing to, which has remained stable over time. Again, a sizable percentage said they did not know (30%).
When deciding whether to buy a product which was made using precision fermentation, it being safe to eat and properly regulated came out as the most important factors (84% and 82% in February 2026). Factors linked to the product itself were also seen as important; for example, tasting good and knowing it was better for someone’s health in comparison to other products (both 74%).
Had respondents heard of cell-cultivated products?
Cell-cultivated products cover a variety of foods that can be made using a production process without slaughter or traditional farming and agricultural practices. They are made by taking cells from plants or animals, which are then grown into food. Cell-cultivated products produced from animal cells can also be known as ‘lab-grown meat’ or ‘cell-cultivated meat’. These products are not yet on the market in the UK for human consumption; however, the FSA is conducting research into the safety of these products.
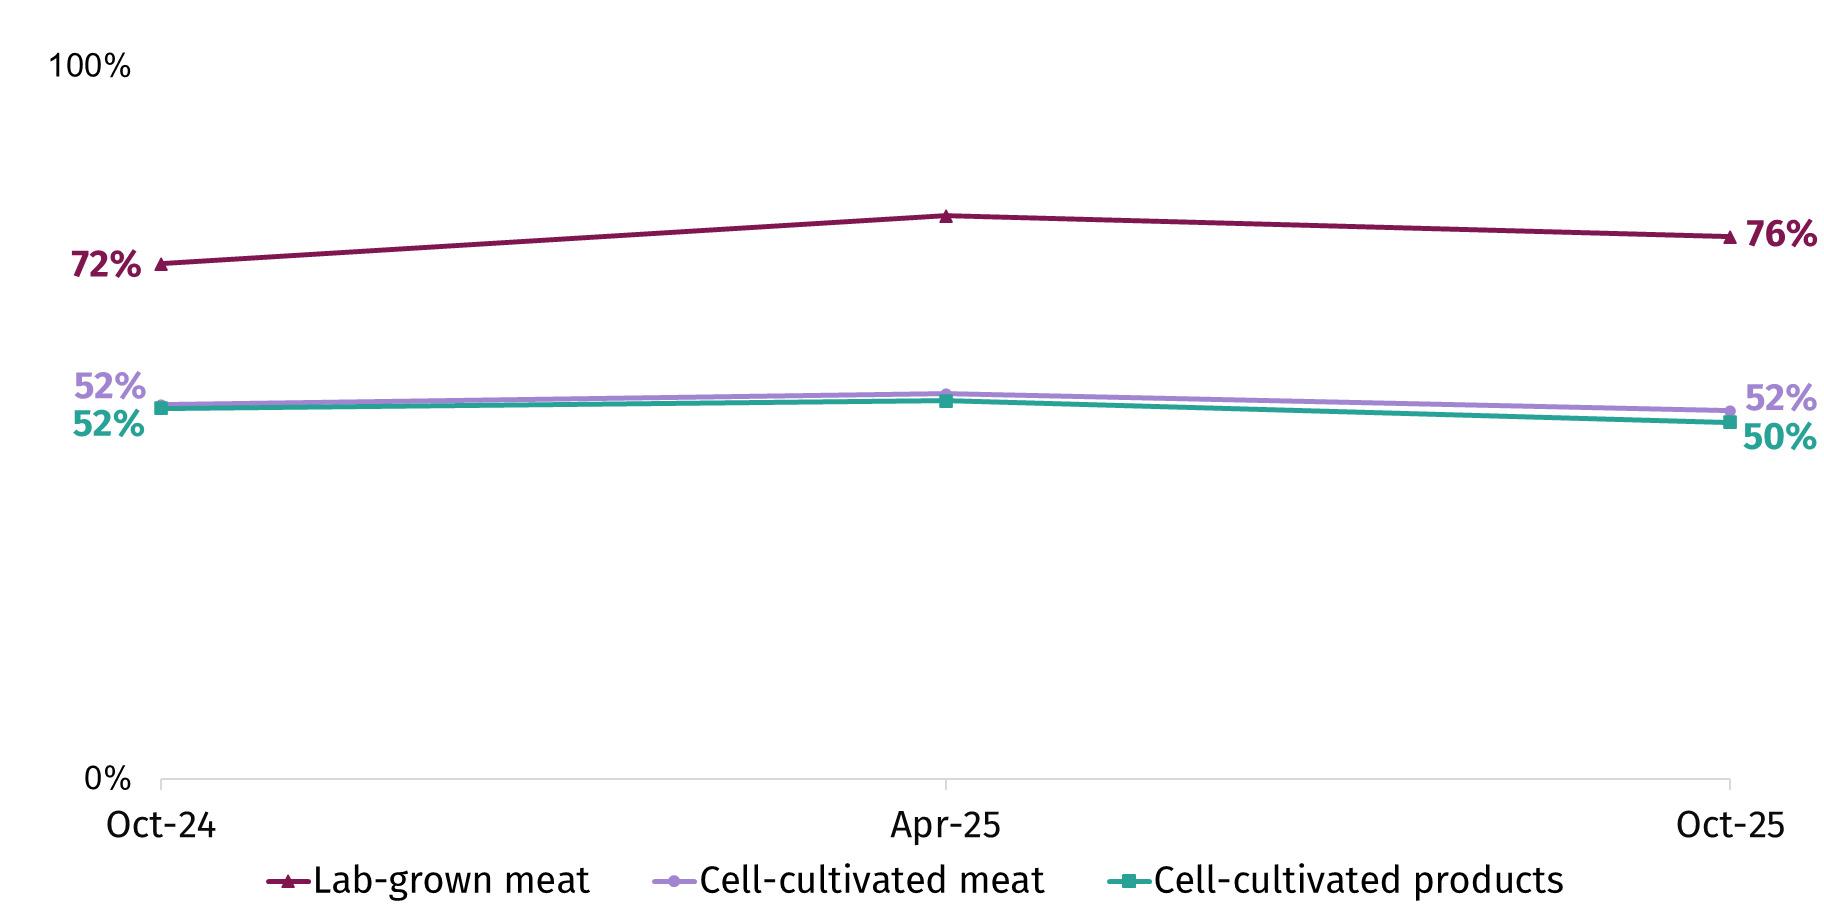
In the October 2025 survey, respondents were shown definitions of cell-cultivated products, lab-grown meat and cell-cultivated meat and asked whether they had heard of the terms before. Awareness of the term ‘lab-grown meat’ (76%) was higher than awareness of the terms ‘cell-cultivated meat’ (52%) and ‘cell-cultivated products’ (50%).
First asked in October 2024, there has been some fluctuation in the percentage reporting awareness of the term ‘lab-grown meat’ (when prompted with a definition). In October 2024, 72% were aware of the term; this increased slightly to 79% in April 2025 then decreased slightly to 76% in October 2025. Awareness of the terms cell-cultivated products and cell-cultivated meat have remained broadly stable between October 2024 and 2025 (see Figure 14).
What did respondents think about the sale and consumption of cell-cultivated meat in the UK?
When thinking about the sale of cell-cultivated meat in the UK in the future, 44% of respondents in October 2025 thought that it should not[16] be on sale in the future (compared with 34% who said it should be on sale in the future). Nearly one in four (23%) were unsure.
The percentage who thought that cell-cultivated meat should be on sale in the UK has remained comparable from October 2024 (31%) to October 2025 (34%). In the same period, the percentage who thought it should not be on sale has also remained comparable (46% October 2024 and 44% October 2025).
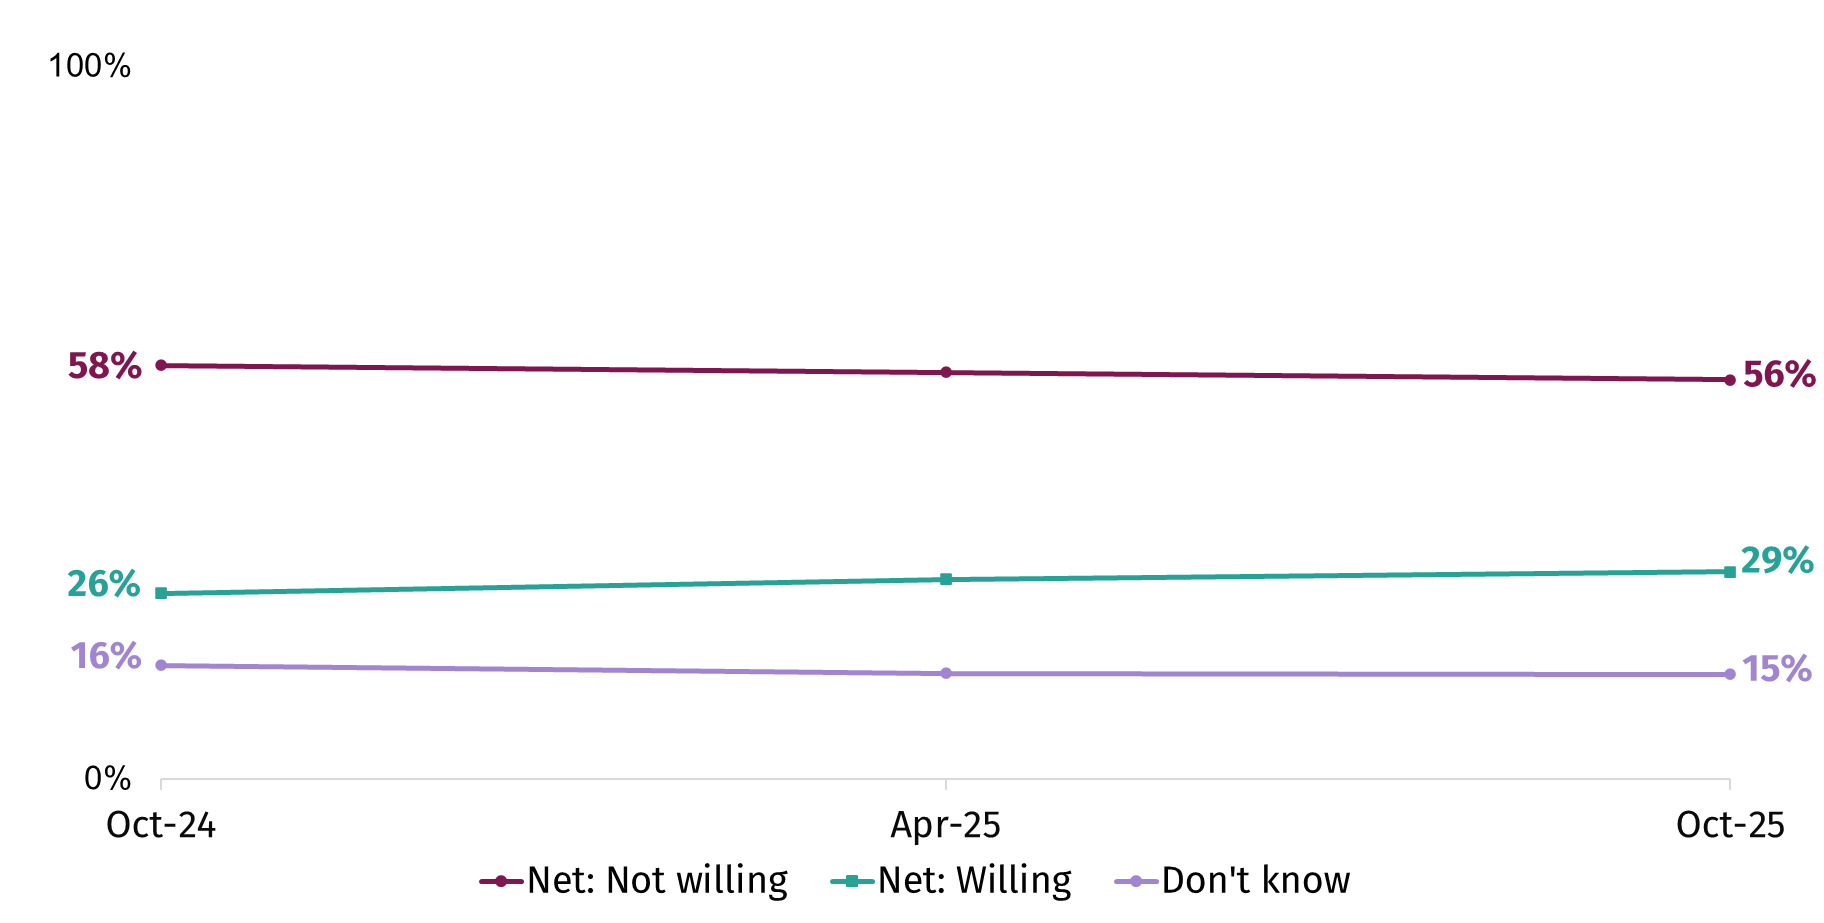
Over half of respondents (56%) said that they would not be willing[17] to include cell-cultivated meat in their diet, whilst around three in ten (29%) said they would be willing in October 2025 (Figure 15). Although this difference has been consistent over time, compared to October 2024, there was a slight increase in the percentage who were willing (26% in October 2024 to 29% in October 2025). The percentage who reported they don’t know has been stable between October 2024 (16%) and October 2025 (15%).
How often did respondents use products containing cannabidiol (CBD)?
Cannabidiol, commonly known as CBD, is an ingredient that is sometimes contained in food, drinks, supplements, oils or other products sold in the UK. These products are widely available in shops, cafés and online.
In December 2025, one in ten respondents (10%) said they had used or consumed products containing CBD in the last 6 months. Over time there was a slight decrease in the percentage who said they had consumed CBD products in the last 6 months from 12% in December 2024 to 10% in December 2025 (Figure 16). There was also a slight decrease in the percentage saying they don’t know if they had used or consumed products containing CBD in the last 6 months (30% to 22%), and a notable increase in the proportion who said they had not consumed CBD in the last 6 months (56% to 67%).
_over_time.png)
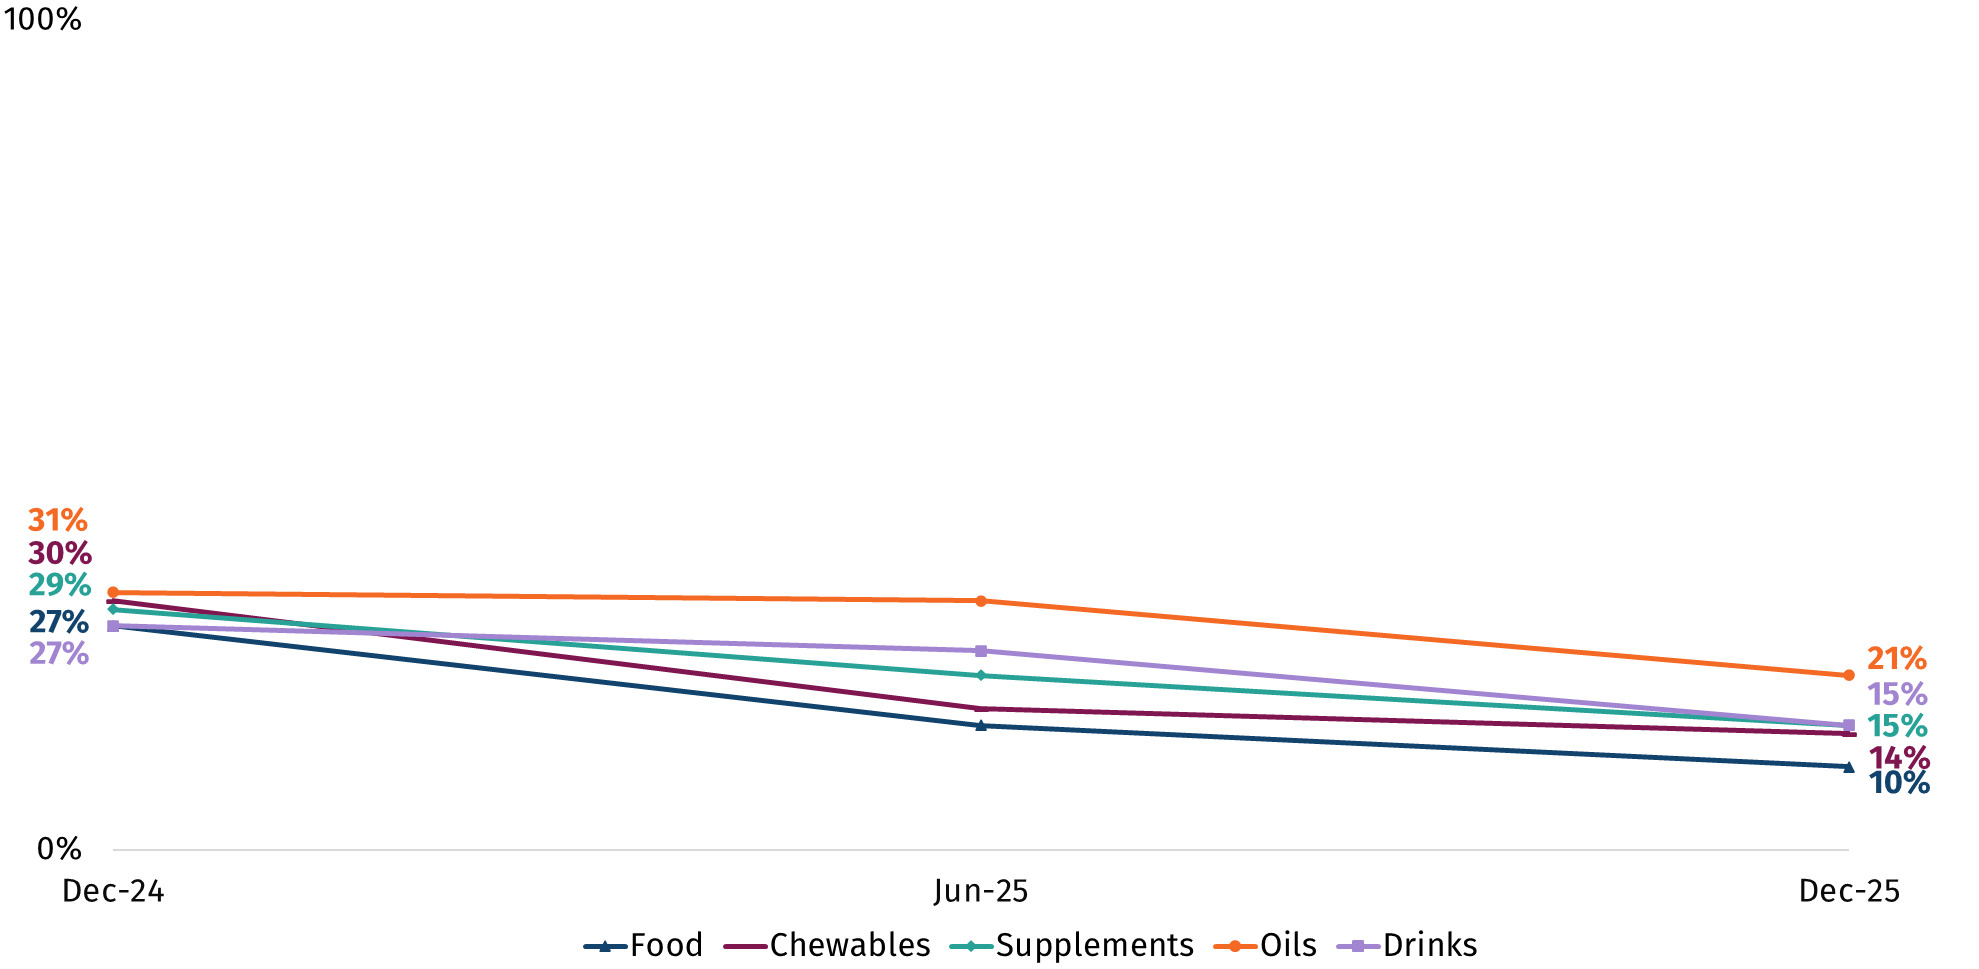
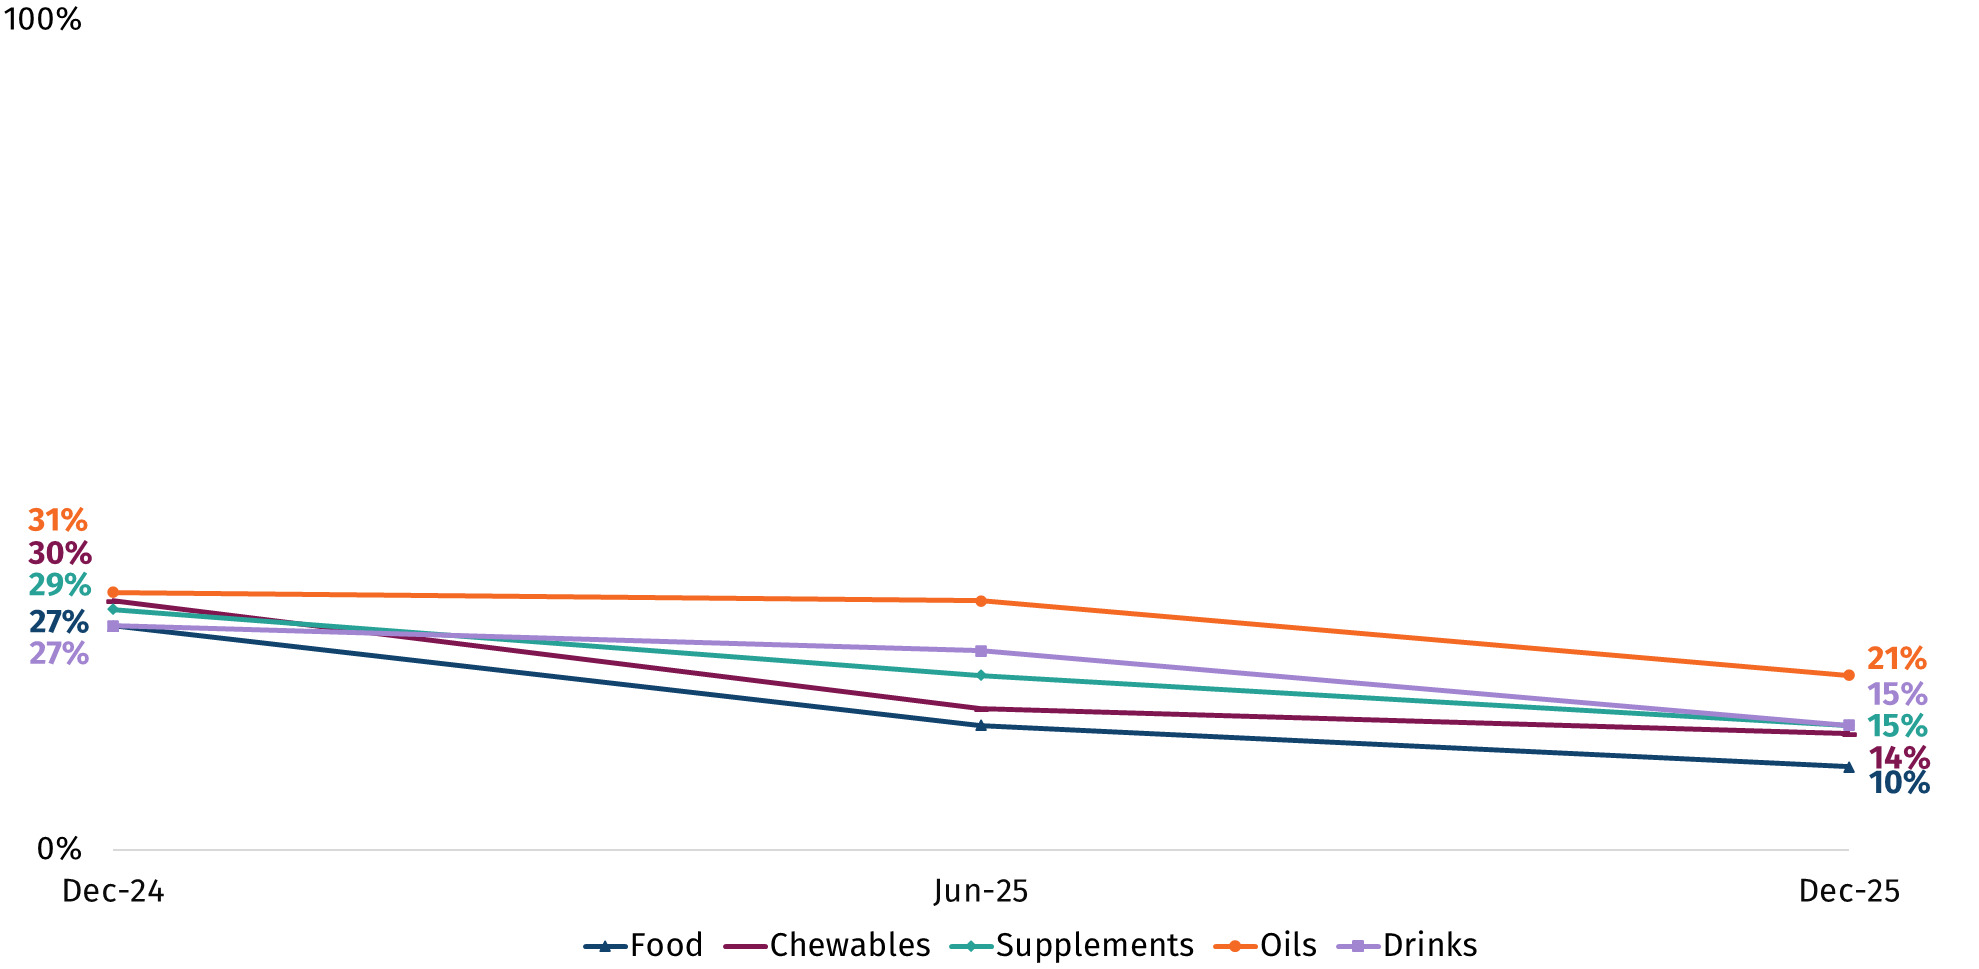
In December 2025, among those who have consumed CBD in the last 6 months, between 10% and 21% said they use each of the products asked about once a week or more. This includes CBD in oils (21%), supplements (15%), drinks (15%), chewables (14%) and food (10%) – see Figure 17. Between December 2024 and December 2025 reported weekly use notably declined for all CBD products asked about.
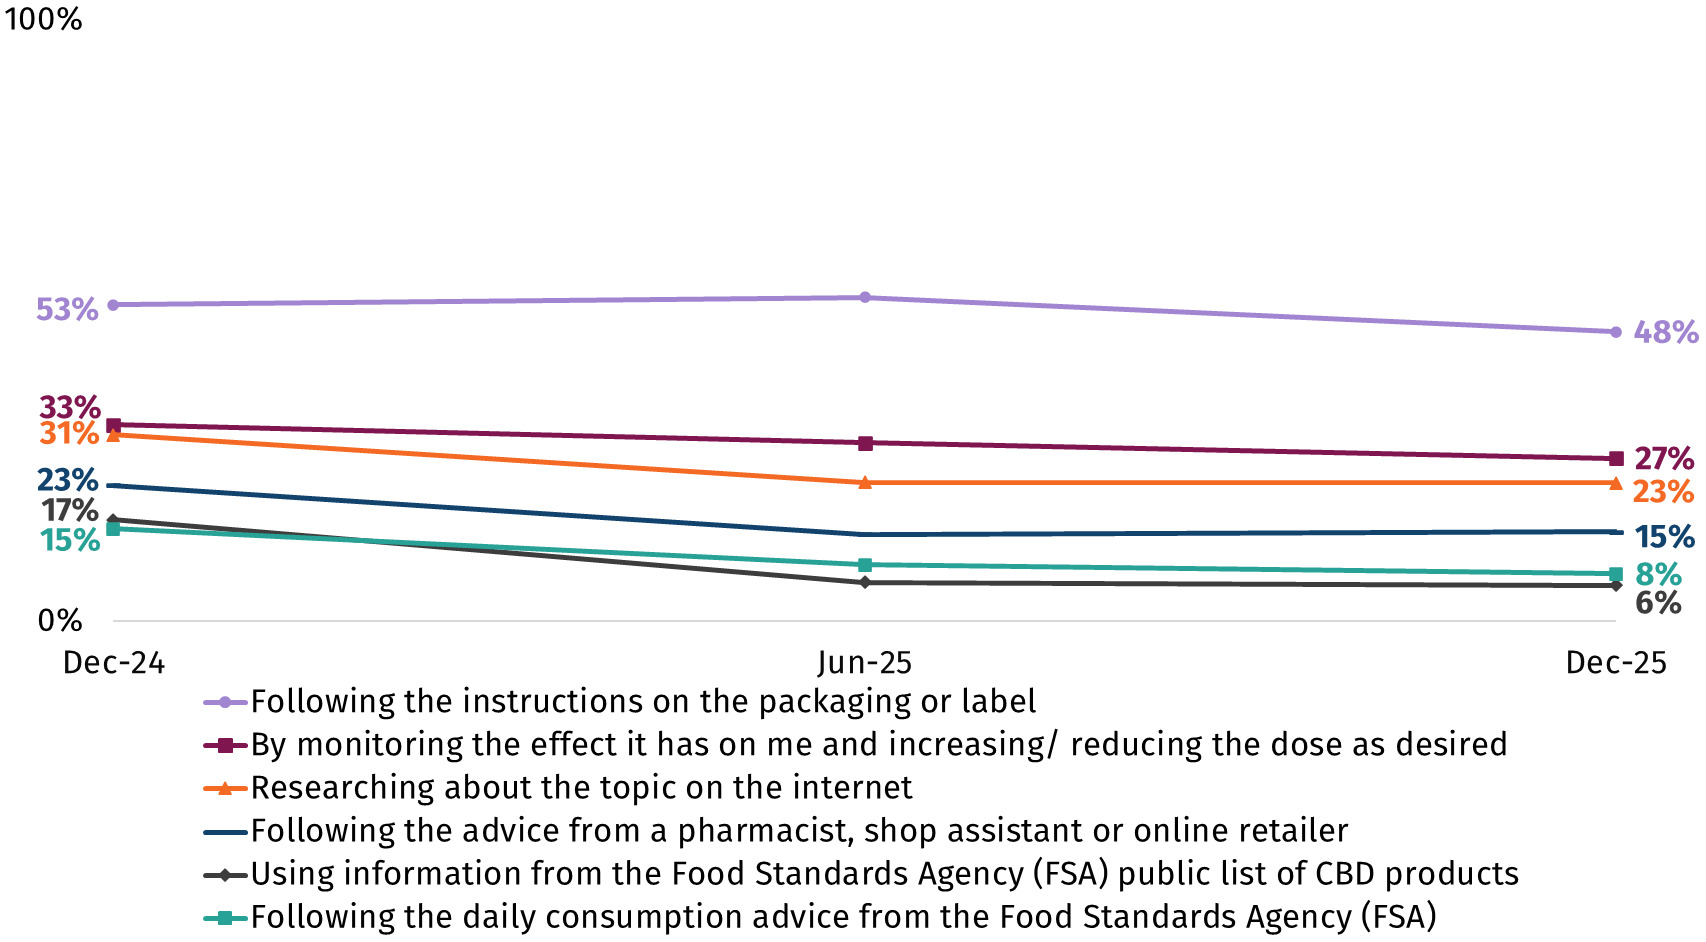
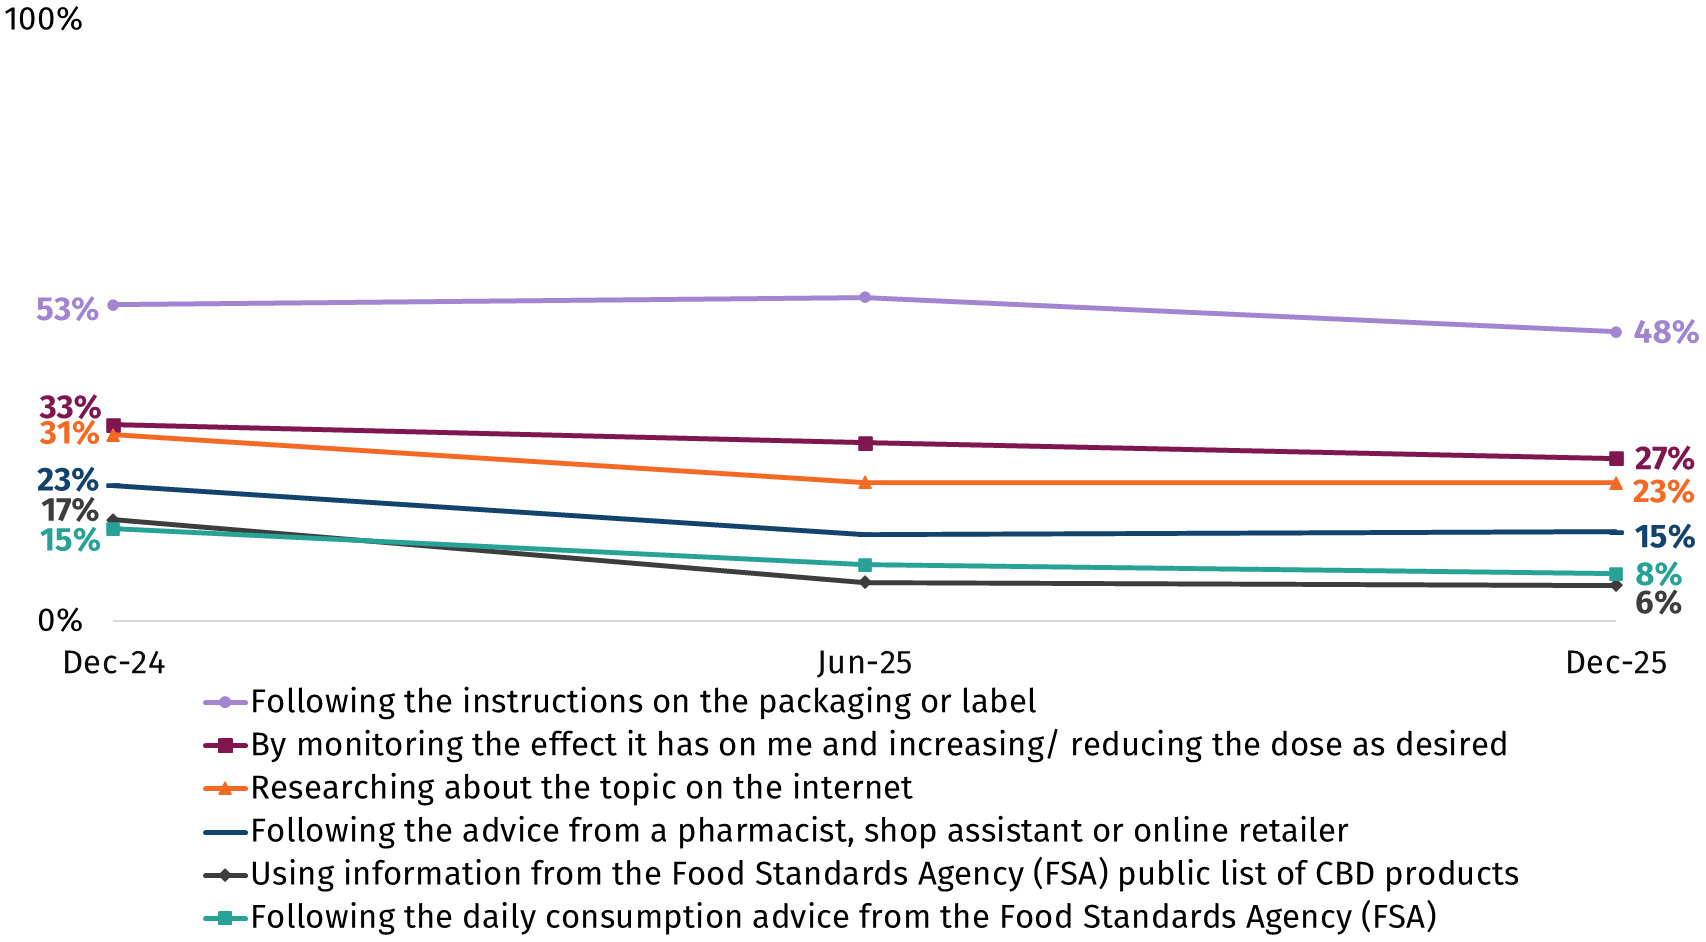
In December 2025, among those who had used or consumed CBD in the last 6 months, respondents most commonly said they determine a suitable dose by following the instructions on the label (48%), monitoring the effect it has on them and increasing/reducing the dose as desired (27%) or researching about the topic on the internet (23%). Fewer than one in ten (8%) said they follow daily consumption advice from the FSA, while 6% use information from the FSA public list of CBD products. The determinants remained relatively stable between June 2025 and December 2025. However, the longer-term trend indicates a slight decline in the percentage who reported they followed advice from pharmacists or retailers (23% in December 2024 to 15% in June 2025) or used the daily consumption advice from the Food Standards Agency (FSA) (15% in December 2024 to 8% in June 2025). There was also a notable decline in the percentage reporting they used information from the FSA public list of CBD products (17% in December 2024 to 6% in June 2025 – see Figure 18). It is worth noting that there was a slight increase over time in the percentage who reported ‘this isn’t something I think about’ (from 13% in December 2024 to 21% in December 2025).
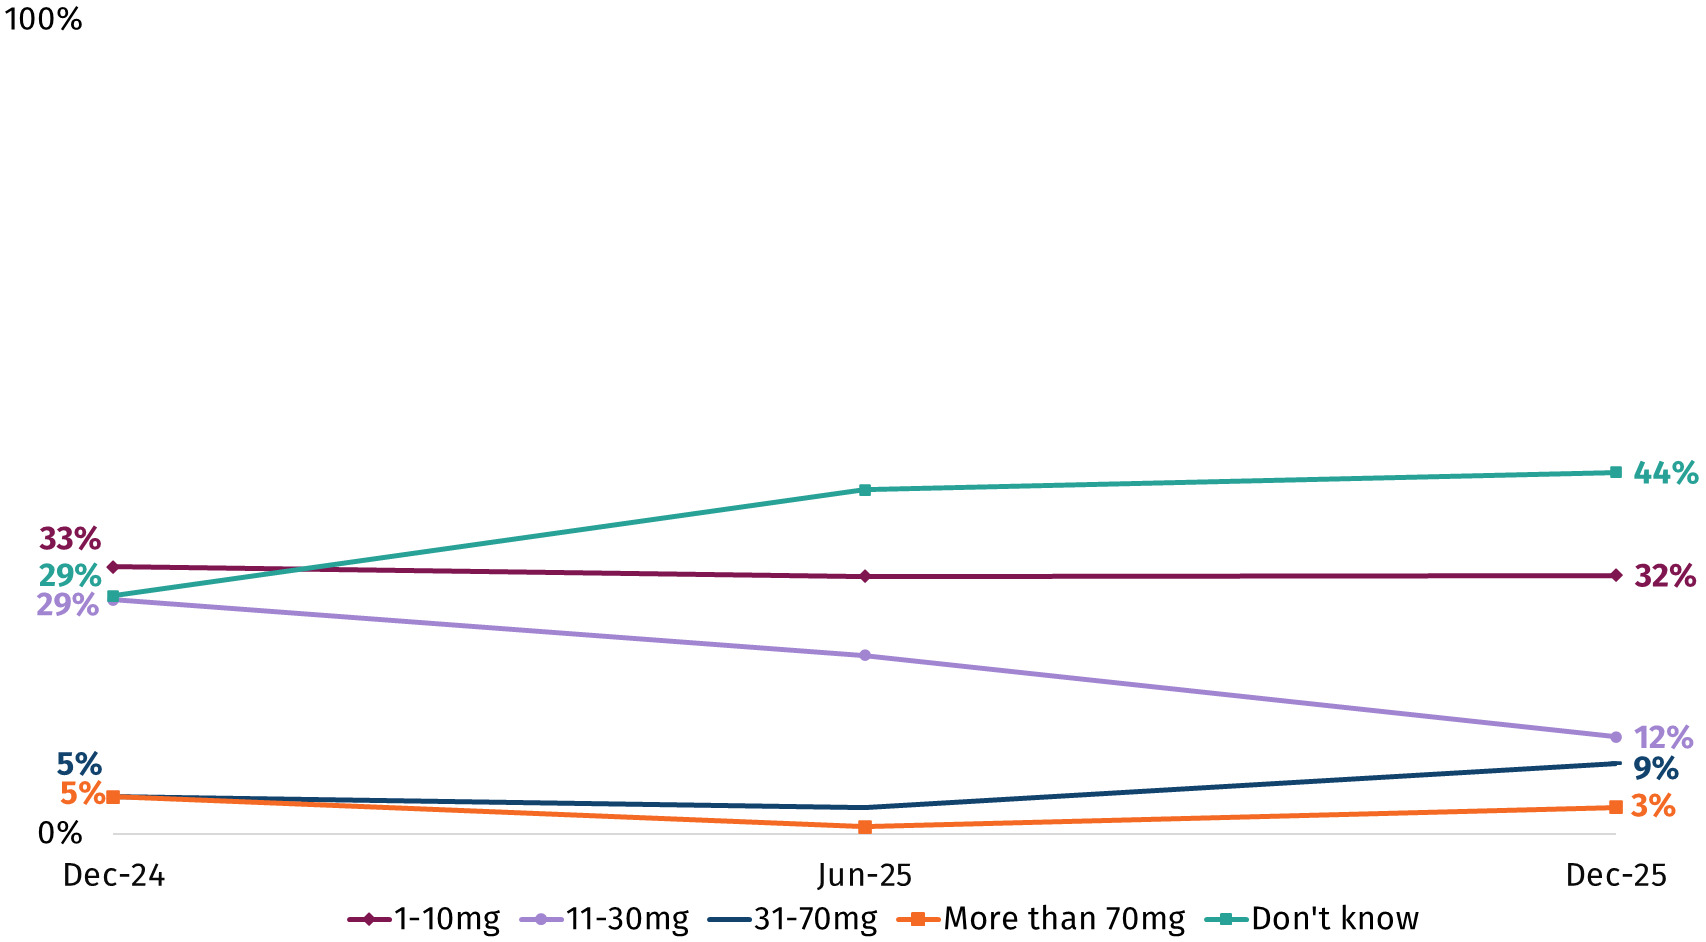
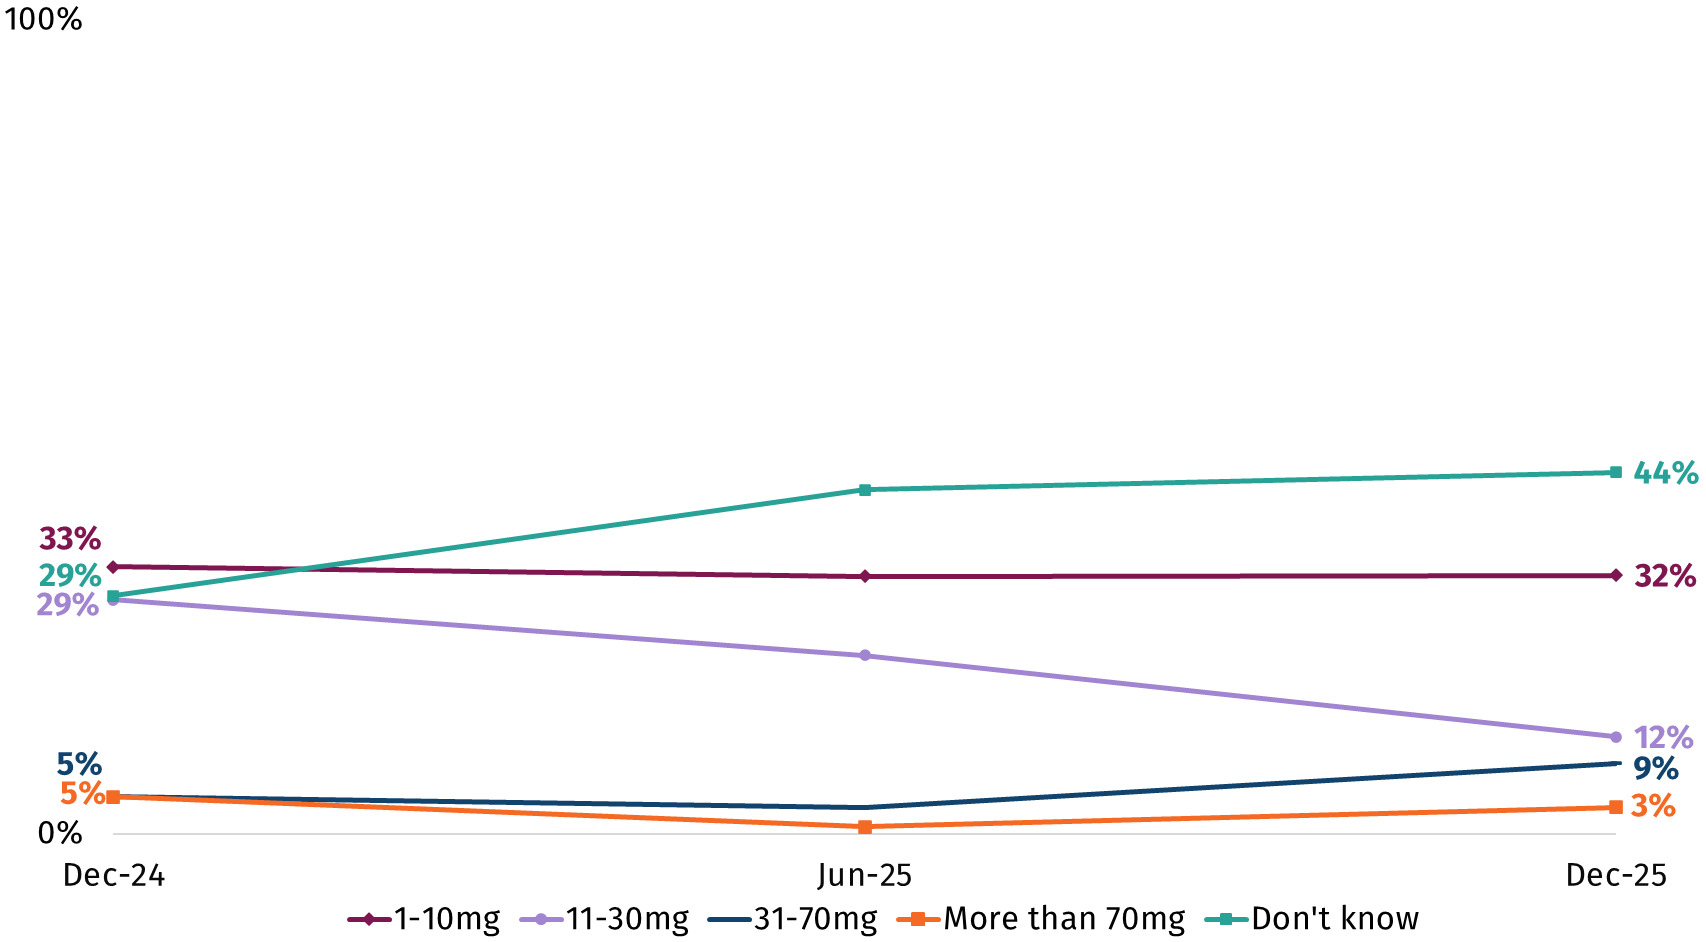
The FSA recommends that healthy adults should limit their consumption of CBD from food to 10mg per day, which is about 4-5 drops of 5% CBD oil.[18] In December 2025 around one in three (32%) respondents who had used CBD in the last 6 months said that they typically consume 1-10mg when they have CBD, in line with these recommendations. Around a quarter (24%) said they typically consume more than this and over two in five (44%) said they didn’t know how much they would typically consume in a day (Figure 19).
Between December 2024 and June 2025, there was a notable increase in the percentage who reported that they don’t know how much CBD they typically consume in a day from 29% in December 2024 to 42% in June 2025. There was also a notable decrease in the percentage who said they typically used between 11 and 30mg in a day, from 29% in December 2024 to 12% in December 2025.
Discussion
The cost of food continues to be the top concern (both prompted and unprompted) for the vast majority of respondents. This suggests that while inflation rates have eased, food prices remain a dominant concern for respondents.
However, while concern about food prices remains widespread, a much smaller percentage of respondents reported being worried about their own or their household’s ability to afford food in the coming month (23% in March 2026). This has fluctuated over time. Certain groups surveyed continue to be more likely to report worries about food affordability, including respondents with a disability or long-term health condition, those living in the most deprived IMD deciles (1–3), those in social grades C2 and DE, and those in the middle-aged groups and parents.
Ultra-processed foods (UPFs) remain a top concern for consumers in the tracker data. This was raised in response to both the prompted and unprompted questions, reinforcing the prominence of UPFs as a concern. Food waste in the food chain - newly added to the tracker - also emerges as a common prompted concern.
A high percentage of respondents reported engaging in certain food behaviours that might impact food safety as a means of saving money, including eating food past its use-by date and eating leftovers that had been kept in the fridge for more than two days. The percentage reporting these behaviours in March 2026 was broadly similar to when these questions were first asked in May 2025 but there were some changes around the Christmas 2025 period, when a higher percentage of respondents reported engaging in these behaviours.
New questions on food safety information indicate there was not one specific topic that the majority of respondents recalled seeing, hearing or reading about. Respondents said they had encountered a wide range of topics, with food product recalls, food hygiene ratings for businesses, and allergies and intolerances among the most common topics respondents had seen, heard or read about. In February 2026, the percentage who had heard of food product recalls, food contamination incidents and food poisoning outbreaks increased, before returning in March 2026 to levels consistent with previous tracking. This could potentially be related to high-profile national recalls of infant formula due to contamination.[19]
Data collected in relation to novel foods and food production techniques suggest there are still mixed perceptions and hesitancy over a willingness to try these products. For example, most respondents said that they would not be willing to include both cell-cultivated meat (56% vs. 29%) and precision fermented dairy (44% vs. 26%) in their diet if it was authorised for sale in the UK. A significant percentage of respondents said they don’t know if they would be willing to include these novel foods in their diet (cell-cultivated meat 15%, precision-fermented dairy 30%), which may be linked to a lack of knowledge or familiarity with novel foods. There were also mixed perceptions of precision breeding, with precision breeding of plants (49% in March 2026) more likely to be seen as acceptable than precision breeding of animals (26%).
Among those who reported consuming CBD in the last 6 months, the research suggests that most respondents were not following the FSA’s recommendations regarding CBD consumption. For example, in December 2025 only around one in three (32%) respondents who consumed CBD reported they typically consume 1–10mg per day. However, the majority (44%) reported they don’t know how much they typically consume in a day. Trends in CBD consumption over time have shown signs of a slight decline between December 2024 and December 2025, however limited data is available on this and consumption will need ongoing monitoring to review long term trends.
Appendices
Appendix A – Additional topics (April 2025 – March 2026)
Table 1 provides a summary of the additional topics included in the Consumer Insights Tracker from April 2025 – March 2026. Please note not all these topics are covered in this end of year report. To access data for any topic, you can download the Consumer Insights Tracker data tables for the specific month that topic was included.
A full list of questions is included within the technical report.
Appendix B – Definitions
Definitions
Definitions of the IMD and social grade are provided below.
-
The Index of Multiple Deprivation (IMD) is calculated using country-specific metrics (domains of deprivation), such as income, barriers to housing and services and crime, which are combined to give an overall measure of relative deprivation within a respondent’s specific output area. These output areas are then ranked and within the report are grouped so that comparisons are made between those in the most deprived (1-3), middle (4-7) and least deprived (8-10) IMD deciles.
- England: The IMD ranks each English LSOA (Lower layer Super Output Areas) from 1 (most deprived) to 32,844 (least deprived)
- Wales: The Welsh equivalent (WIMD; Welsh Index of Multiple Deprivation) ranks each Welsh LSOA from 1 (most deprived) to 1,909 (least deprived)
- Northern Ireland (NI): The NI equivalent ranks each OA (Output Area) from 1 (most deprived) to 5,022 (least deprived)
-
Social grade is a socio-economic metric classification which groups people into four classifications based on “the occupation of the Chief Income Earner (CIE)” of their household[20]. This report compares those in social grades AB, C1, C2 and DE as classified by the National Readership Survey (NRS).
The way in which social grade is classified is listed below:
- AB: higher and intermediate managerial, administrative and professional occupations
- C1: supervisory, clerical, and junior managerial, administrative and professional occupations
- C2: skilled manual occupations
- DE: semi-skilled and unskilled manual occupations, unemployed and lowest grade occupations
Either ‘highly’ or ‘somewhat’ concerned
Food and You 2 was conducted biannually (twice a year) until 2025, and annually from May 2025
The full tracking period varies for concerns depending on when they were first asked.
As part of our regular refinements to the survey, small wording updates were made in April 2025. This adjustment means that some concern categories appear slightly differently in comparison with last year’s report. Previously this was referred to as ‘ultra-processed, or the over-processing of, food’.
This was introduced into the tracker in April 2025, as was ‘the quality of food’.
Small changes in levels of concern between waves mean that the ranking of concerns may differ over time. As a result, instances where one concern appears to replace another in the top five should be interpreted with caution, as these shifts may reflect marginal differences rather than meaningful changes in perceptions.
Changes were made to the ‘concerns’ question in May 2025 which is why some concerns are tracked for a shorter time period.
Although this difference in March 2026 is just under the reporting threshold of 5ppts, it is statistically significant and the difference has been 5ppts or more in January and February 2026.
Closed and unprompted questions about concerns were included in August 2025 and February 2026.
Either ‘very’ or ‘somewhat’ worried
Awareness is based on those who reported that they had heard of the FSA, regardless of whether they reported knowledge about the FSA.
More information on these changes is available in the Technical Report.
Either ‘a lot’ or ‘a little’ knowledge about the FSA and what it does
Low percentages said they distrust the FSA, with no notable differences between groups of interest
Acceptable is either ‘very’ or ‘fairly’. Unacceptable is either ‘fairly’ or ‘very’.
Should not is either should ‘probably not’ or ‘definitely not’. Should is either should ‘definitely’ or probably’.
Willing is either ‘very’ or ‘somewhat’ willing. Not willing is either ‘somewhat’ or ‘very’ unwilling.
FSA: ‘Cannabidiol (CBD)’ (link here)
National Readership Survey: ‘Social Grade’ (link here)