Consumer Insights Tracker - April to June 2026 Report

1. Key findings

Key findings for April to June 2026:

  • Food affordability: The proportion who reported worrying about their household not being able to afford food increased slightly from 19% in February 26 to 26% in May 26, and remained comparable in June 26 (24%).

  • Money saving behaviours: In June 26, when prompted with a list of money-saving behaviours, eating food past its use by date (60%) and eating leftovers kept for over two days (59%) remained the most commonly reported.

  • Food concerns: In June 26, food prices (91%) remained the top concern among respondents when prompted, followed by ultra-processed food (78%) and the quality of food (76%). In May 26, concern for food shortages reached its highest level (62%) since tracking began for this topic in April 25 (54%). It then fell slightly to 58% in June 26 but remained higher than almost all previous months.

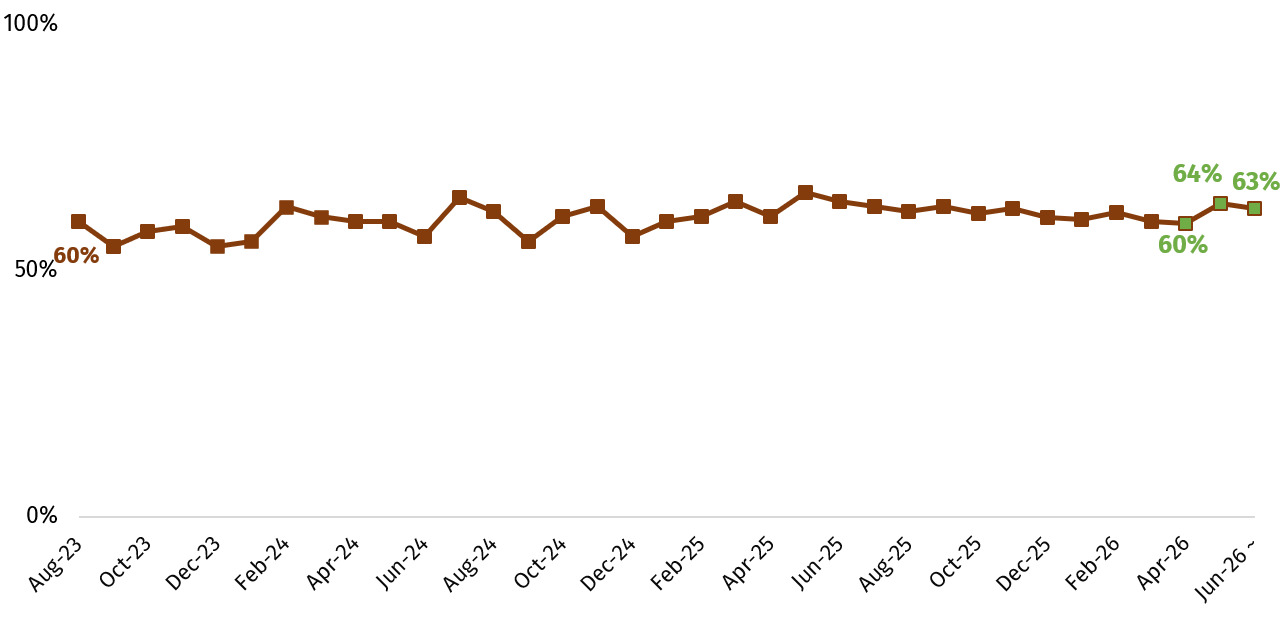
  • Food Standards Agency (FSA): Among those with some knowledge of the FSA, the proportion who said they trust the FSA to do its job increased slightly from April (60%) to May 26 (64%), before remaining at a similar level in June 26 (63%). This was broadly consistent with the previous quarter.

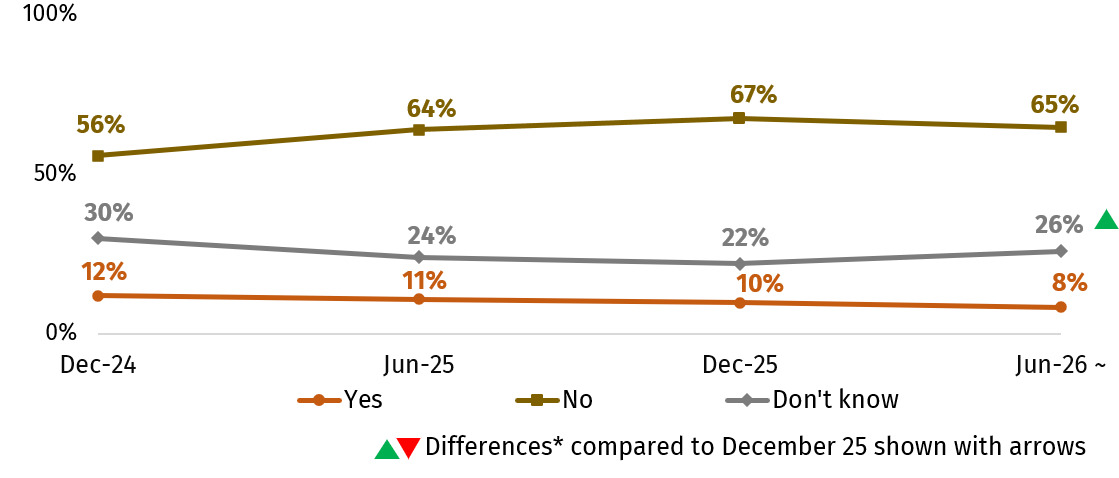
  • Cannabidiol (CBD): In June 26, 8% of respondents reported they had consumed CBD in the last 6 months. This was consistent with December 25 (10%) when these questions were last asked, but a slight decline from when tracking began for this topic in December 24 (12%).

  • Cell-cultivated products: Views on sale of cell-cultivated meat, willingness to include in diet, and confidence in regulation remain mixed, with a sizeable minority saying they ‘don’t know’. For example, In June 26 43% of respondents said that cell-cultivated meat should not be on sale in the UK in the future, and 35% said it should. 22% were unsure. This pattern is consistent with previous months.

2. Background and methodological information

2.1. Survey topics

This report presents findings for topics we track regularly including consumer concerns in relation to food, food affordability, and trust in the FSA as a regulator.

The core questions in this survey underwent review before the launch of the April 2025 survey. Some new questions and/or statements were introduced, resulting in a new timeseries for some questions/ statements. Please see the notes on each slide for further information.

Between April and June 2026, questions were also asked about consumer views on cell-cultivated products (April), Anti-microbial resistance (May), Raw milk (June), CBD products (June), and Sanitary and Phytosanitary negotiations (June).

Findings on cell-cultivated products and CBD products can be found in this report.

Data for all questions can be found in the accompanying data tables.

2.2. Method

  • This research was conducted online using the YouGov panel which gives access to 400,000 active panel members in the UK.

  • This report presents findings from April–June 2026. Where appropriate, comparisons are made to previous waves since July 2023.

  • Across England, Wales and Northern Ireland 2,109 people took part in the survey in April (2nd-6th), 2,155 in May (1st-4th) and 2,197 in June (5th-8th).

  • Quotas were set by age, gender, social grade, education and region. The data is also weighted to be representative of the population by these demographic variables. All results are based on final weighted data.

  • In June 2026, the sampling and weighting approach was updated to include ethnicity. Comparability tests were conducted and the impact on tracking was determined to be minimal. However, this methodological change should be considered when comparing June 2026 onwards with previous waves.

  • Further details on the methodology including strengths and limitations can be found in our technical report.

2.3. Notes for interpretation

  • Reporting convention (↑ / ↓ on graphs): The Consumer Insights Tracker uses t-tests to assess differences over time and between groups, and highlights those where the p value is <0.05. Due to the quota sampling methodology used this is not an exact test of whether differences are statistically significant and indicative of real changes in wider population. However, they may highlight where there could be shifts in behaviour or attitudes and further research would be required to assess if these changes are real.

  • Online panel survey: As respondents are selected from an online panel, people without internet access are not represented.

  • Percentages: Figures may not add up to 100% on graphs due to figures being rounded to the nearest whole number, or because in some questions, respondents were able to select multiple answers. In some cases, rounding may make changes appear smaller or larger than they are in the underlying data. Statistical tests have been conducted using the unrounded figures.

3. Results

3.1. Food affordability

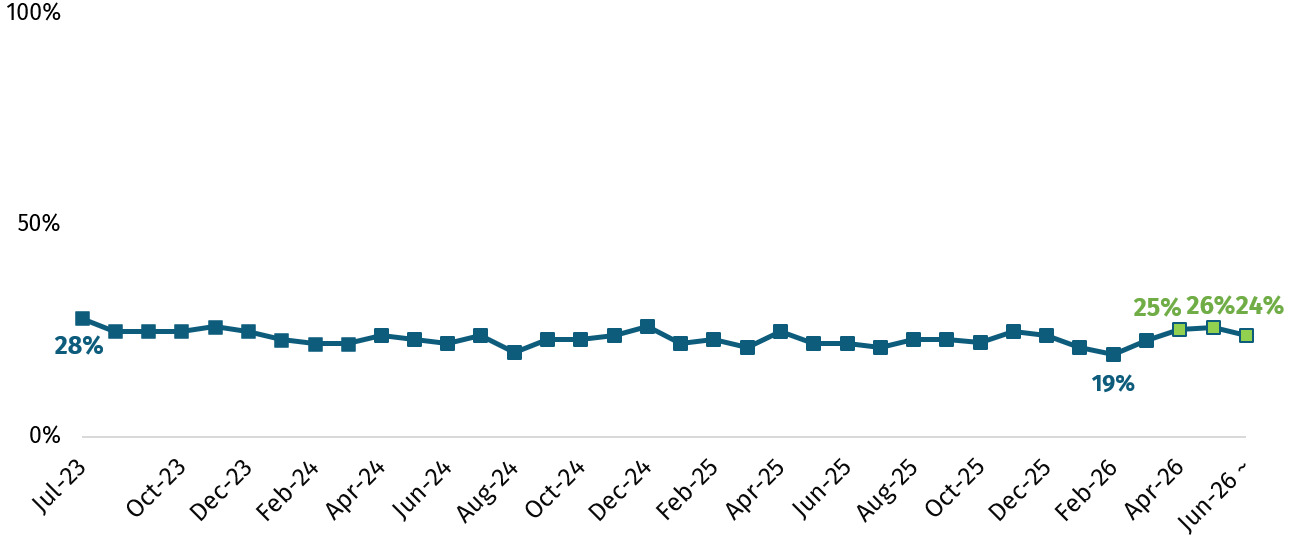
Figure 1 shows the proportion of respondents who reported worrying about their household not being able to afford food increased slightly from 19% in February 26 to 26% in May 26, before remaining comparable in June 26 (24%).
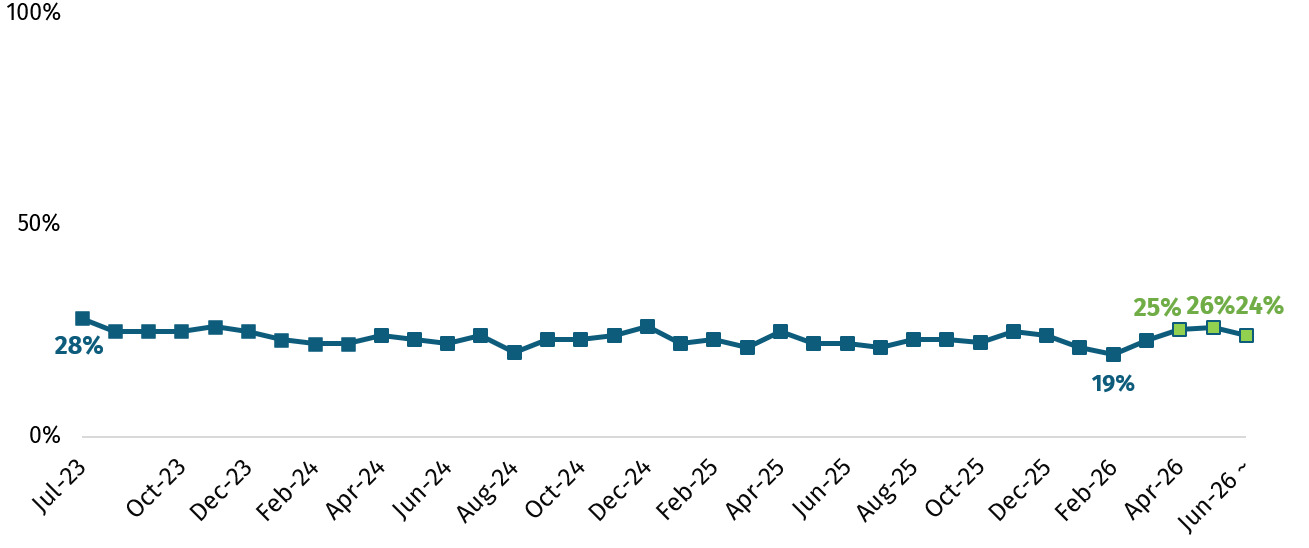
The chart shows the proportion who were worried about not being able to afford food in the next month (from July 2023 onwards). This was 24% in June 2026.
Figure 1.Proportion who reported worrying about their household not being able to afford food in the next month

Note: Q3m. To what extent, if at all, are you worried you/your household will not be able to afford food in the next month? Chart shows the proportion who were ‘very worried’ or ‘somewhat worried’. The new data points (from January to March) are shown in a different colour. Base: All waves (c.2,000) from July 2023 to June 2026 (ranging between 2,008 in August 2024 and 2,283 in July 2025). ~ Sampling and weighting updated to include ethnicity in June 2026.

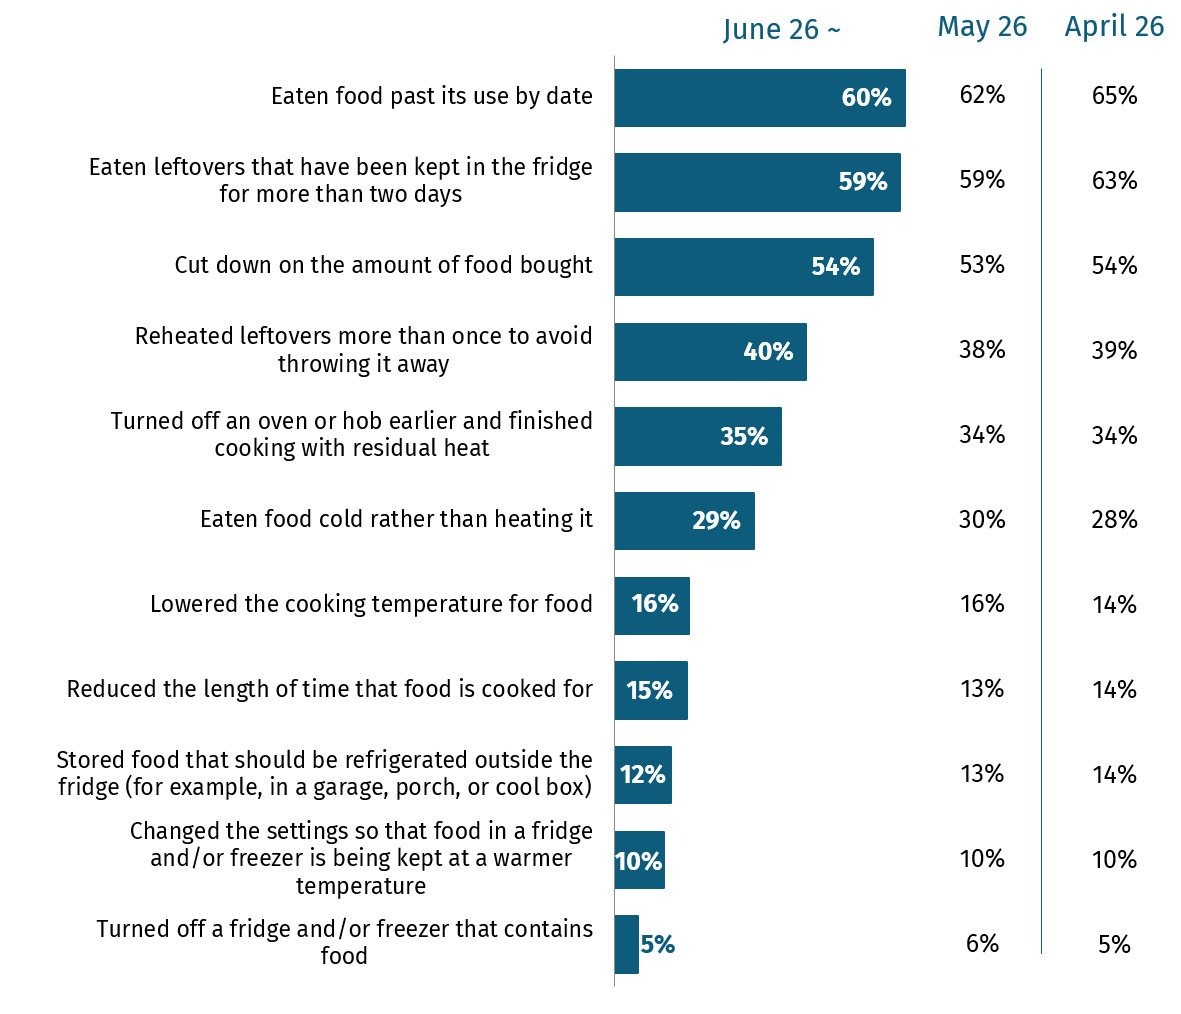
In June 26, when asked to select from a list of money-saving behaviours, eating food past its use by date (60%) and eating leftovers kept for over two days (59%) remained the most commonly reported, as shown in Figure 2. The proportion who reported these behaviours declined slightly over the quarter.
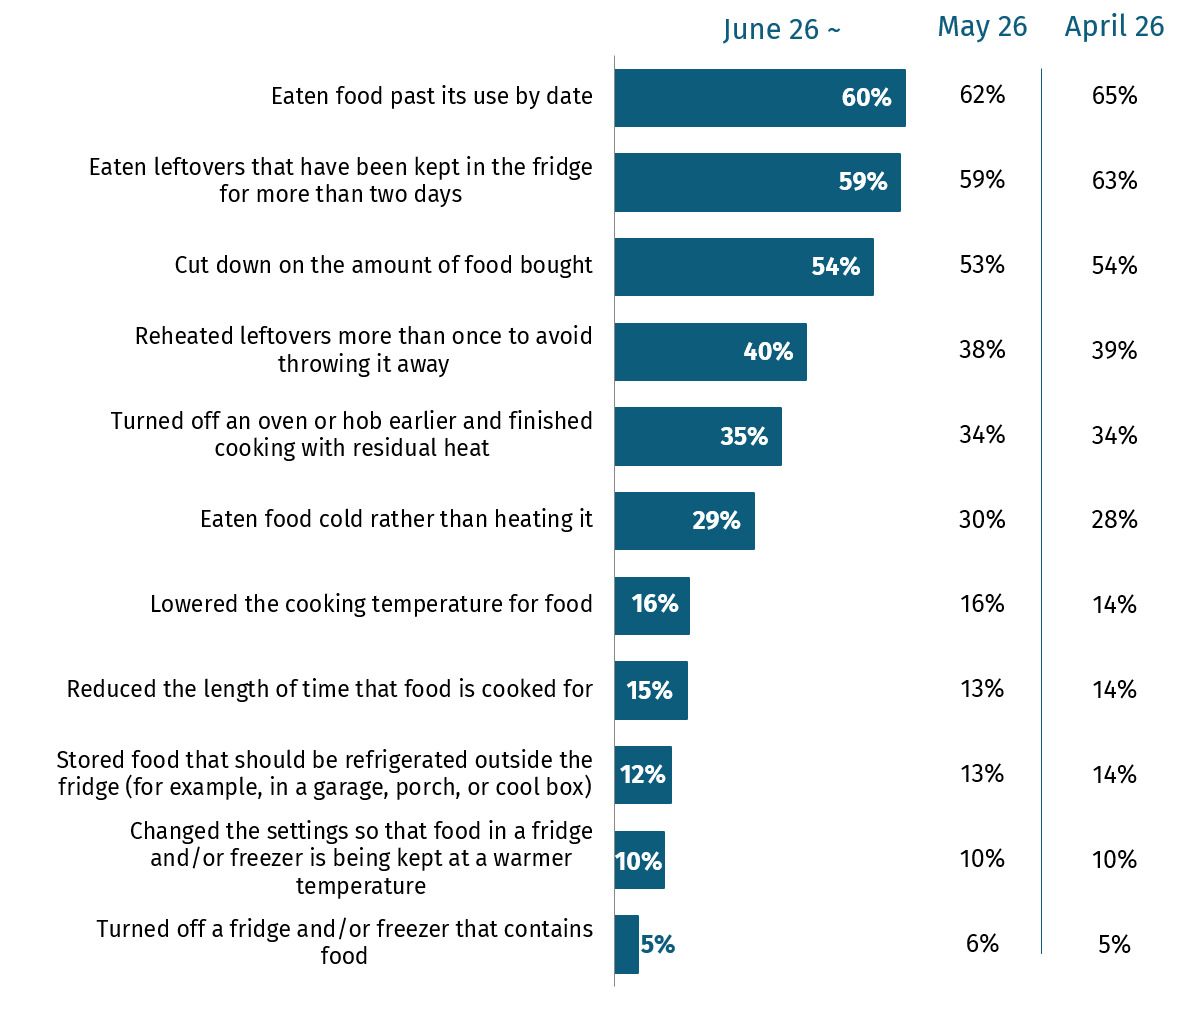
The chart shows the proportion who reported money saving behaviours in June 2026. Eating food past its use by date and eating leftovers that had been in the fridge for more than two days were most common (60% and 59%).
Figure 2.Proportion who reported money saving behaviours in the last month

Note: Q6_NEW1. The next question is about behaviours you have done to save money, for example to reduce your food shopping costs or energy bills. In the last month, which, if any, of the following have you or someone in your household done to save money? Note: Multiple responses allowed. As a result, percentages do not total 100%. Figures shown in chart are the proportion who said ‘Yes, I or someone in my household have done this every week’, ‘Yes, I or someone in my household have done this some weeks but not every week’ or ‘Yes, I or someone in my household have done this just one week in the last month’. This question was introduced in May 2025. Base: All in June 2026 (n=2,197), May (n=2,155), April (n=2,109). ~ Sampling and weighting updated to include ethnicity in June 2026.

3.2. Food concerns

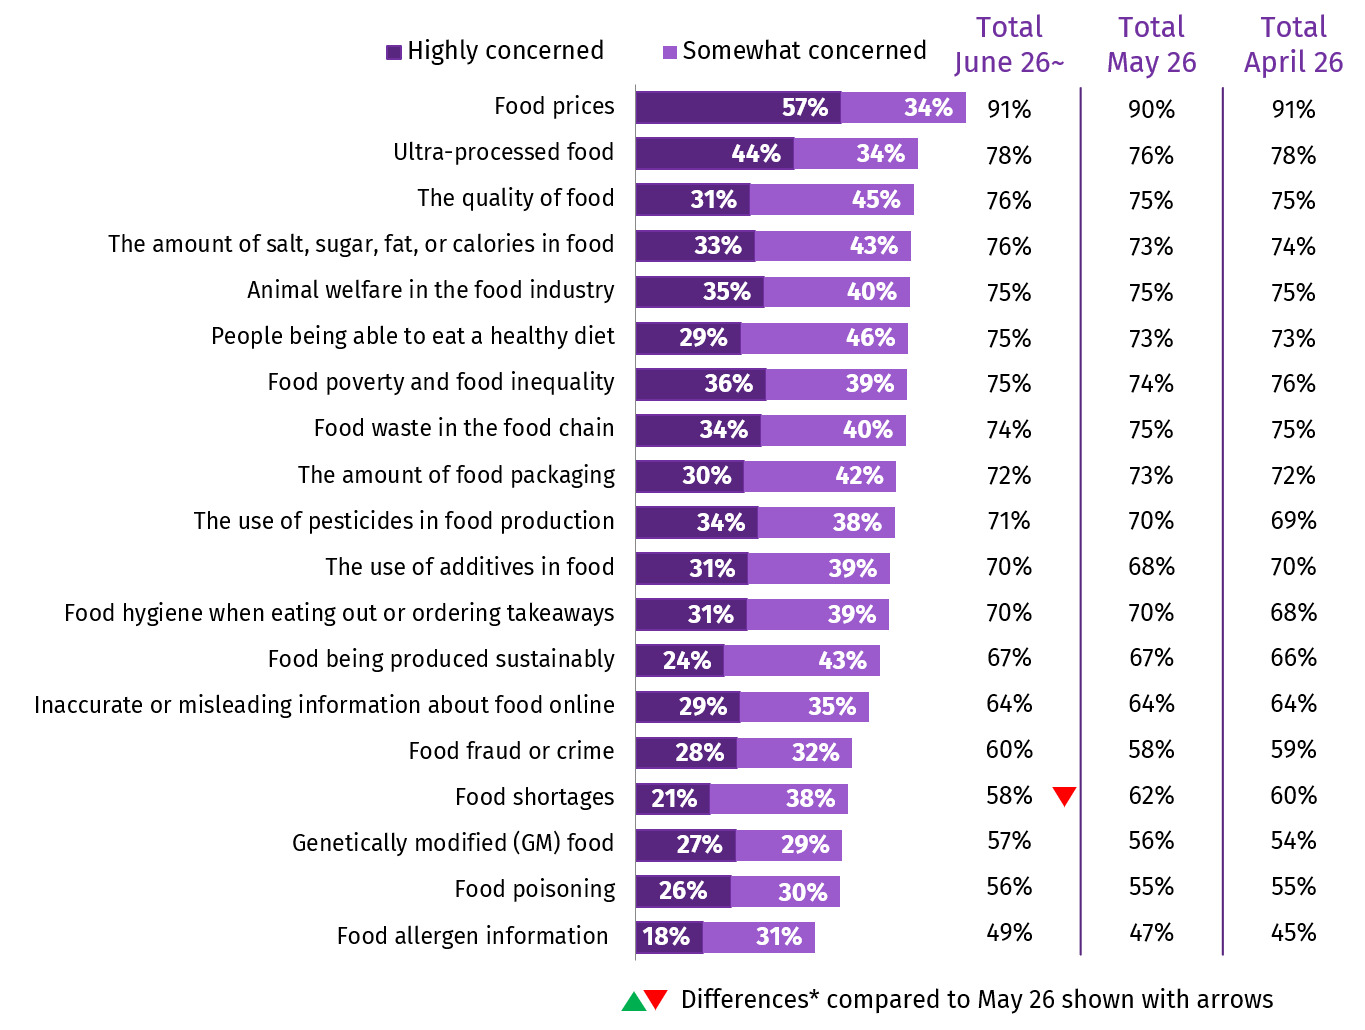
Figure 3 shows food prices (91%) remained the top prompted concern among respondents in June 26, followed by ultra-processed food (78%) and the quality of food (76%).

In May 26, concern about food shortages reached its highest level (62%) since tracking began for this topic in April 25 (54%). Concern dropped slightly to 58% in June, but this remains higher than almost all previous months.
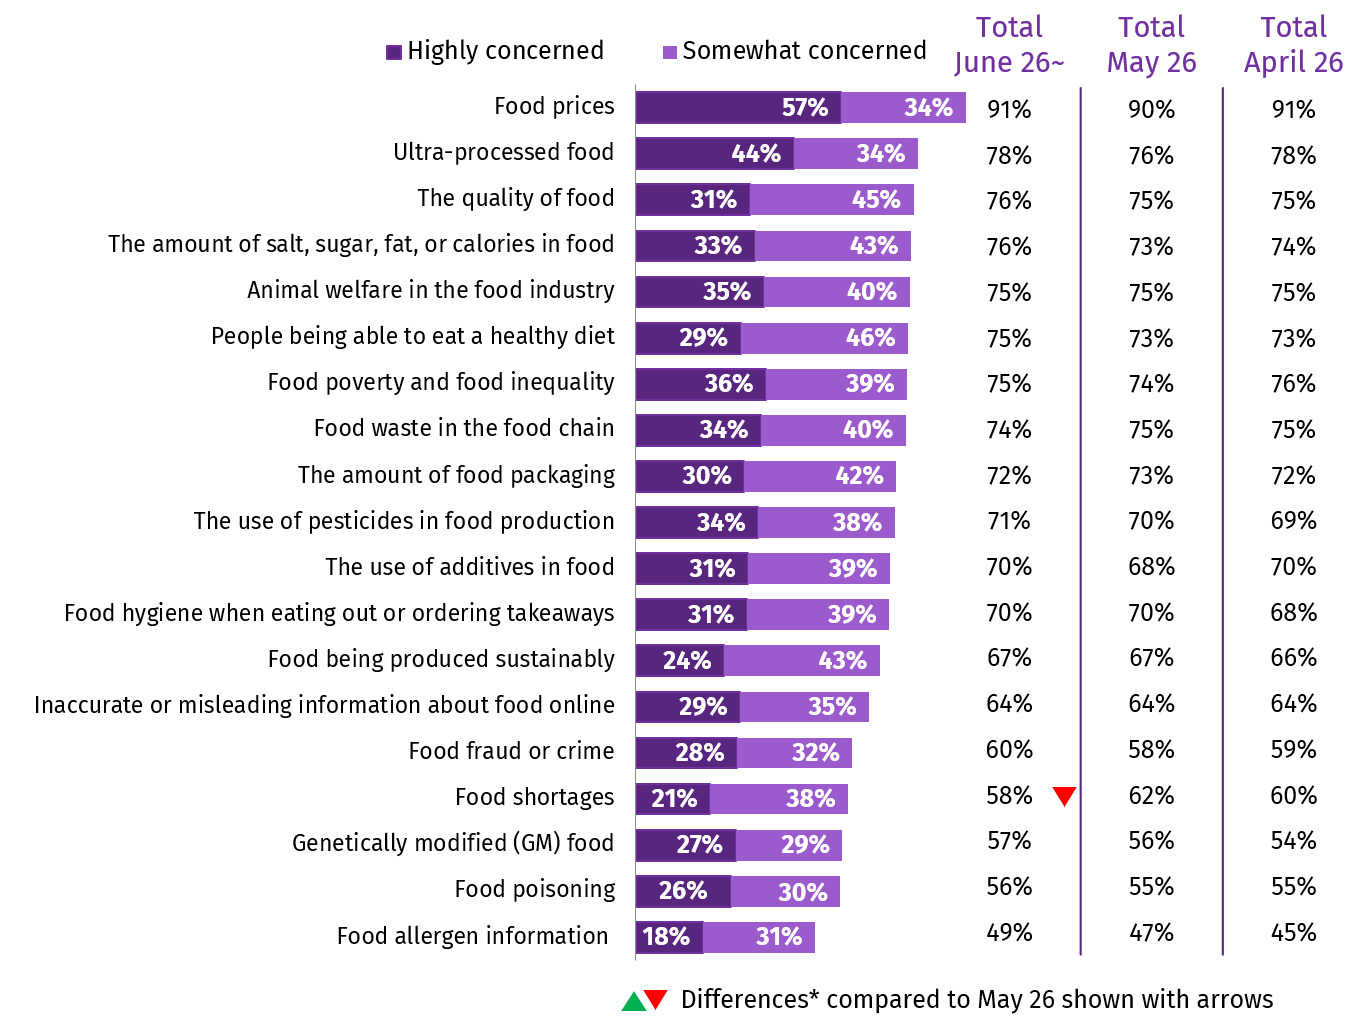
The chart shows concern about a range of food related topics. In June 2026, food prices (91%) remained the top concern among respondents, followed by ultra-processed food (78%) and the quality of food (76%).
Figure 3.Proportion who reported concern about food by topic

Note: Q12. Thinking about food in the UK in general. At the moment, how concerned, if at all, do you feel about each of the following topics? Note: Multiple responses allowed. As a result, percentages do not total 100%. Some statements were introduced in April 2025, for others wording was slightly updated. Please see the 2026 technical report for more details. Figures shown in chart are the proportion ‘highly concerned’ or ‘somewhat concerned’. Base: All in June 2026 (n=2,197), May (n=2,155), April (n=2,109). *Differences compared to May 2026 shown with arrows, see notes for interpretation for more information. ~ Sampling and weighting updated to include ethnicity in June 2026.

3.3. The Food Standards Agency

Figure 4 shows that among respondents with some knowledge of the FSA, trust in the FSA to do its job increased slightly from April (60%) to May 26 (64%) and then remained stable between May (64%) and June 26 (63%). This was broadly consistent with the previous quarter (60%-62%).

This chart shows the proportion of respondents who trust the FSA to do its job. This varied between 60% and 64% from April to June 2026.
Figure 4.Proportion who trust the FSA to do its job (among those with knowledge of the FSA)

Note: Q16. The Food Standards Agency (FSA) is the Government Agency responsible for food safety in England, Wales and Northern Ireland. How much do you trust or distrust the Food Standards Agency to do its job? That is to make sure that food is safe and what it says it is. Figures shown in chart are the proportion who said ‘I trust it’ or ‘I trust it a lot’. Base: Those who know a little / a lot about the FSA (c.1,250–1,400) from August 2023 to June 2026 (ranging between 1,041 in September 2024 and 1,380 in July 2025). ~ Sampling and weighting updated to include ethnicity in June 2026.

3.4. Food safety topics

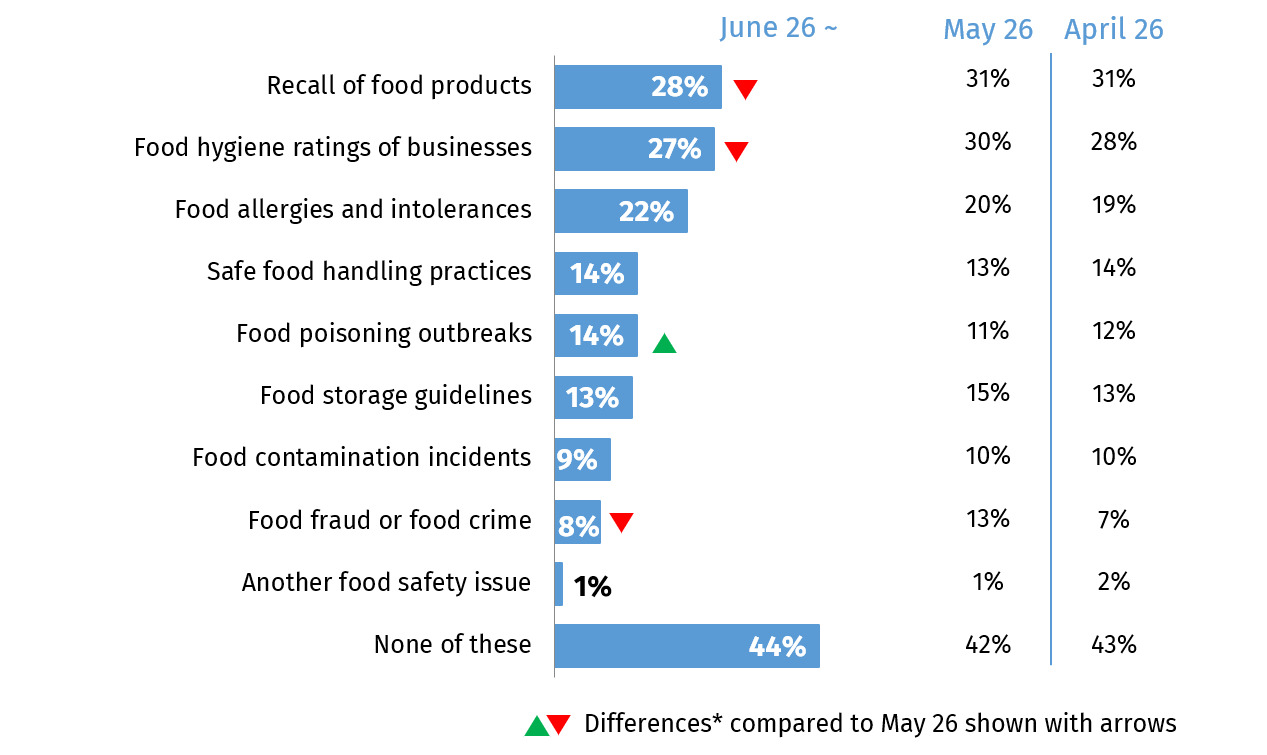
As shown in Figure 5, ‘recall of food products’ remained the most commonly recalled topic in June 26, with 28% of respondents saying they had seen, read, or heard something about it in the past month. This was a slight decrease from 31% in May 26.

Food hygiene ratings followed closely behind, reported by 27% of respondents in June, also a slight decrease from May 26 (30%).
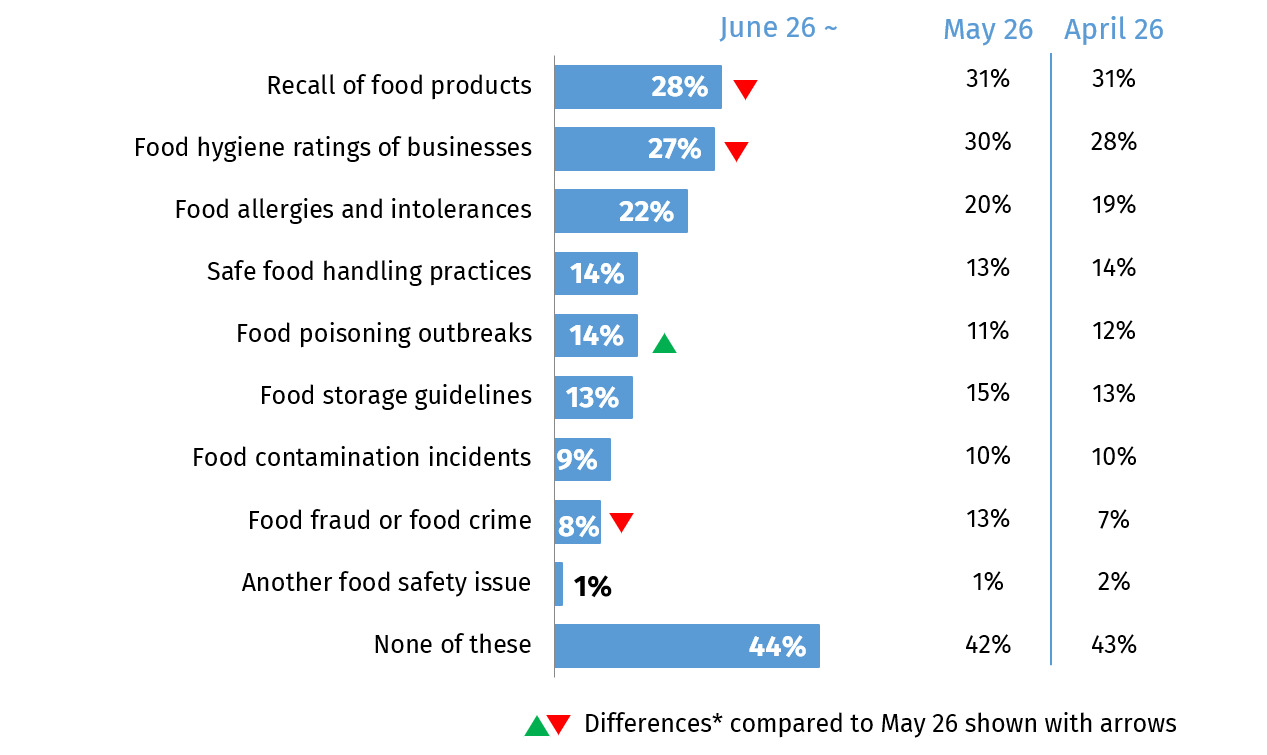
This chart shows the proportion who were aware of food safety topics in June 2026. The topic consumers were most commonly aware of is recall of food products (28%).
Figure 5.Proportion who had seen, heard or read about food safety topics in the past month

Note: NEWC1. In the past month, which, if any, of the following food safety topics have you seen, read or heard any information about? This could have been in the news, on social media, via word of mouth, or other online sources. Multiple responses allowed, as a result, percentages do not total 100%. Base: All in June 2026 (n=2,197), May (n=2,155), April (n=2,109). *Differences compared to May 2026 shown with arrows, see notes for interpretation for more information. ~ Sampling and weighting updated to include ethnicity in June 2026.

In June 26, respondents most commonly said they had seen, read or heard something about any of these topics in the news (49%), on social media (37%) and via word of mouth (27%)[1]. This was consistent across the quarter.

3.5. Cannabidiol (CBD)

In June 26, 8% of respondents reported consuming CBD in the last 6 months, consistent with December 25 (10%) – when these questions were last asked (see Figure 6). However, there has been a slight decrease since these questions were first asked in December 24 (12%). Between December 25 (22%) and June 26 (26%) there was also a slight increase in the proportion who don’t know whether they have consumed CBD.
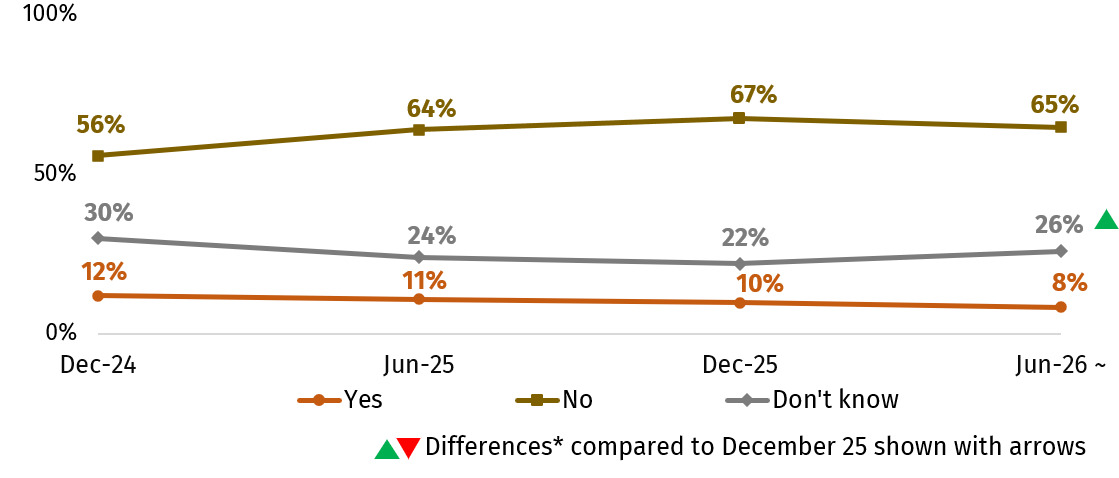
This chart shows the proportion who have consumed CBD in the last month. In March 2026 this was 8%.
Figure 6.Proportion who have reported consuming CBD in the last 6 months

Note: QCBD1. Have you used or consumed products containing CBD in the last 6 months? Base: All in June 2026 (n=2,197), December 2025 (n=2,171), June 2025 (n=2,143) and December 2024 (n=2,036) Not displaying prefer not to say. *Differences compared to December 2025 shown with arrows, see notes for interpretation for more information. ~ Sampling and weighting updated to include ethnicity in June 2026.

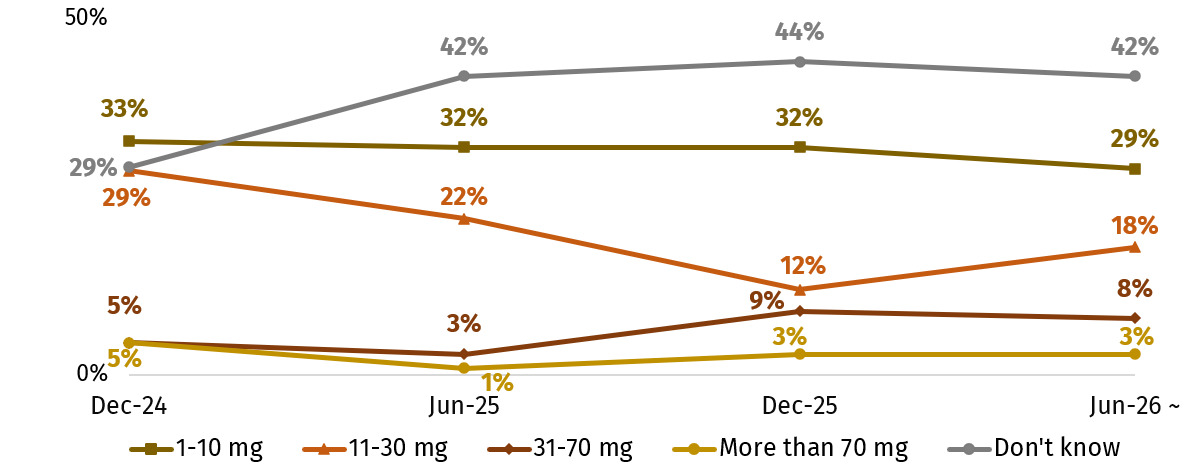
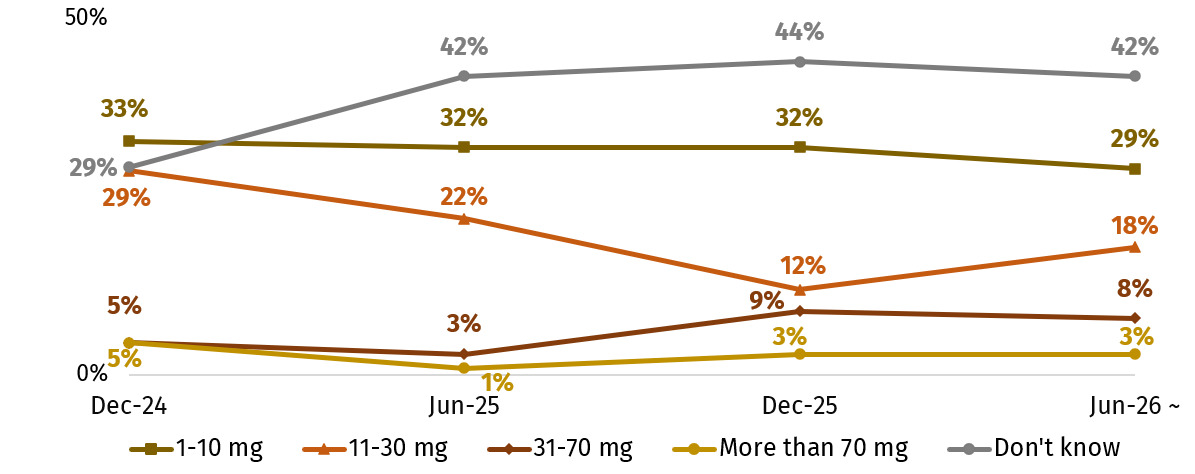
This chart shows the amount of CBD consumed in a typical day among those who reported consuming CBD in the last 6 months. In June 2026, 29% said they typically consumed 1-10mg.
Figure 7.Amount of CBD consumed in a typical day, among those who have reported consuming CBD in the last 6 months

Note: QCBD4. When you consume CBD, how much would you typically consume in a day? If this varies, please select the average amount. Base: All who have consumed CBD in June 2026 (n=174), December 2025 (n=210), June 2025 (n=220) and December 2024 (n=237). ~ Sampling and weighting updated to include ethnicity in June 2026.

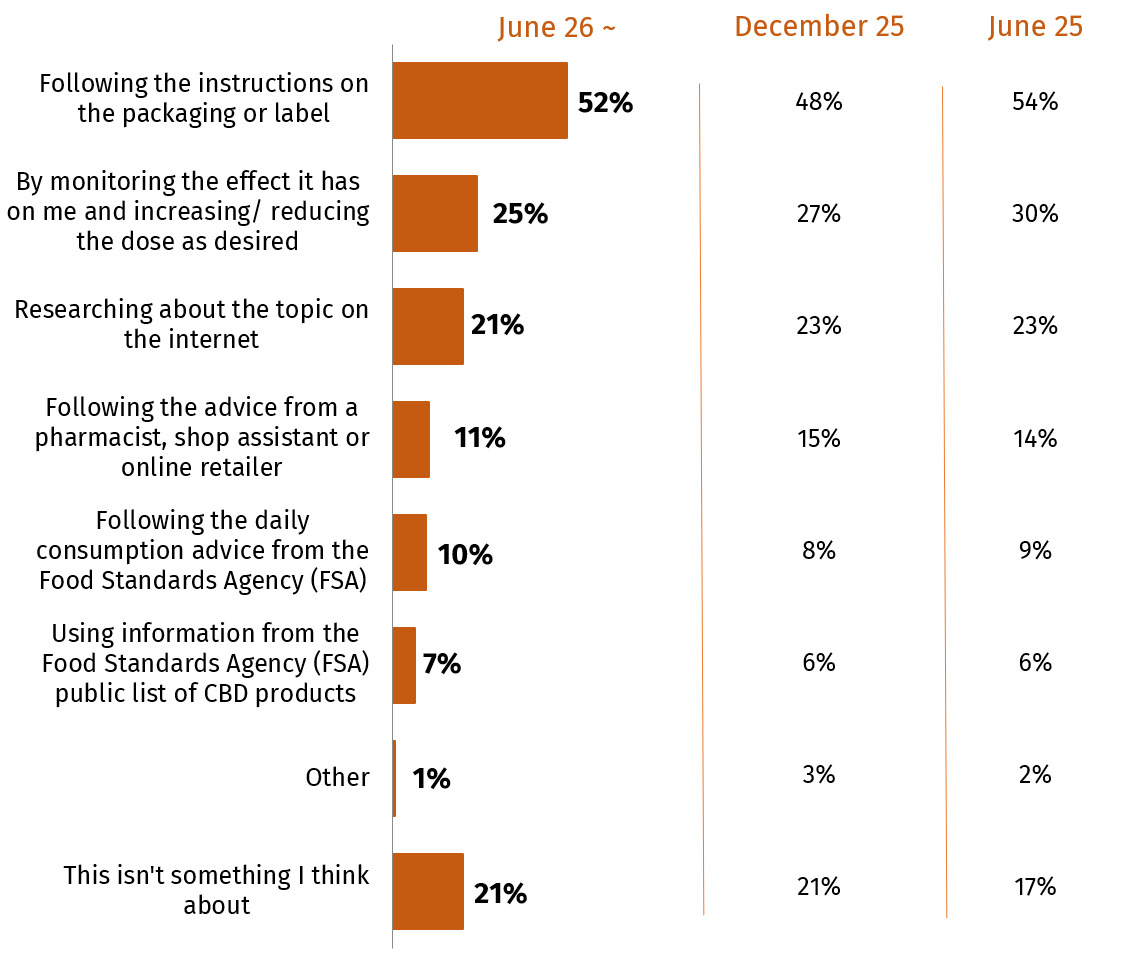
Figure 8 shows that among those that said they had consumed CBD in the last 6 months, the most common ways of deciding on a suitable dose remained following the instructions on the packaging or label (52%), and by monitoring the effect it has on them (25%). This was comparable to previous waves.
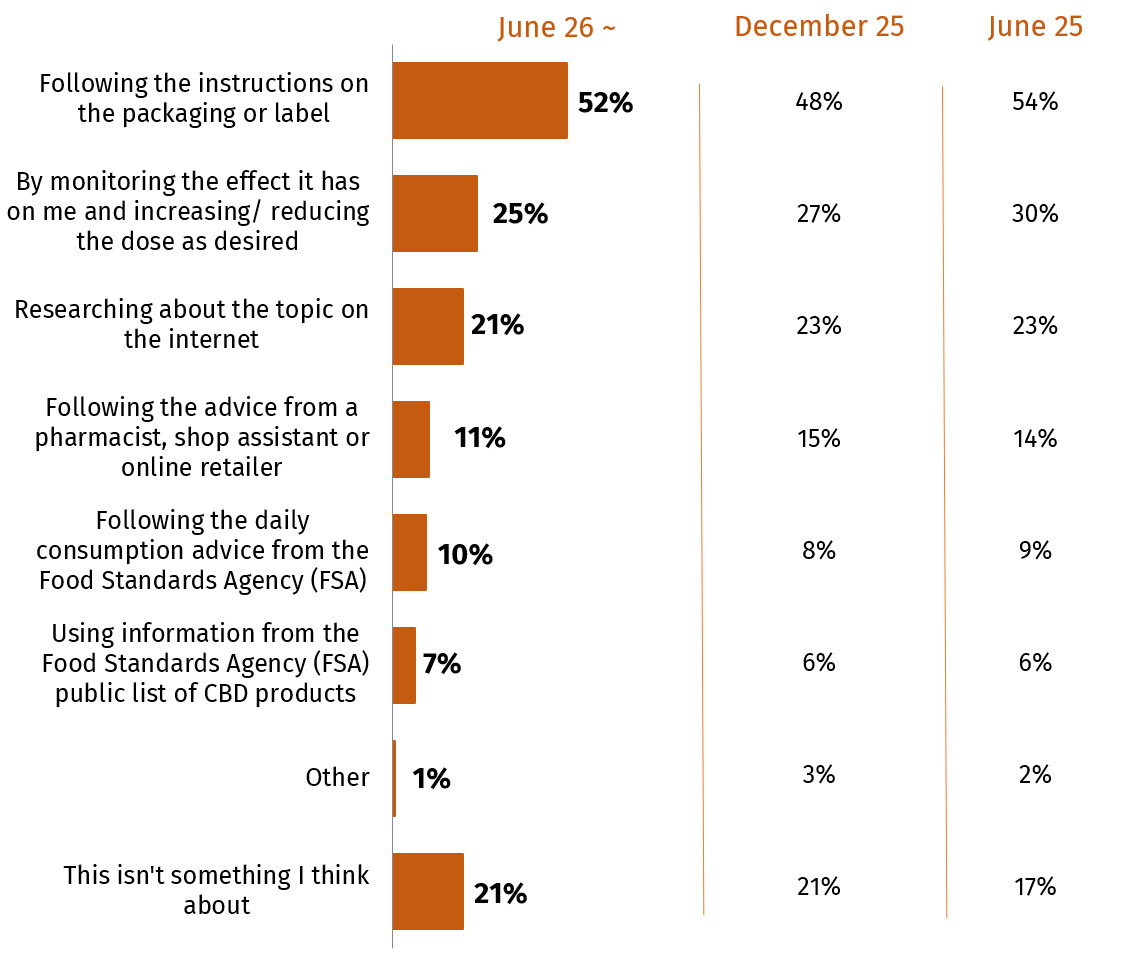
This chart shows how respondents who have consumed CBD in the last 6 months decide on a suitable dose. Most commonly this is by following the label (52% in June 2026).
Figure 8.Deciding on a suitable dose of CBD

Note: QCBD3. When using or consuming products containing CBD, typically how do you decide what a suitable dose or serving is? Please select all that apply. Note: Multiple responses allowed. As a result, percentages do not total 100%. Base: All who have consumed CBD in June 2026 (n=174), December 2025 (n=210), June 2025 (n=220) and December 2024 (n=237). ~ Sampling and weighting updated to include ethnicity in June 2026.

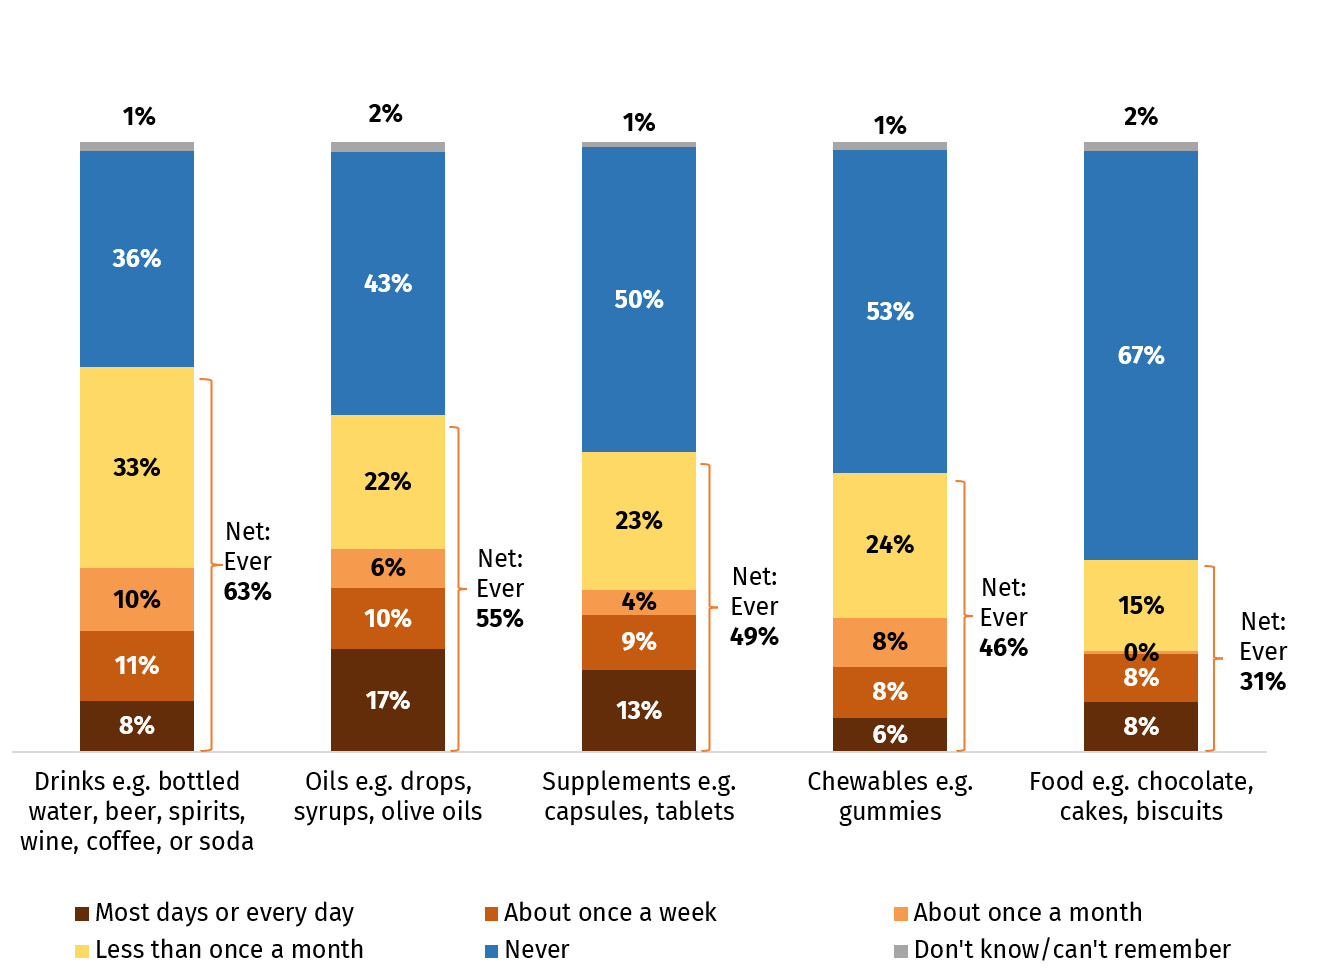
In June 26, respondents who said they had consumed CBD in the last 6 months were most likely to report they had consumed drinks (63%) and oils (55%) containing CBD. Respondents were more likely to say they consume oils most days or everyday (17%) than drinks (8%) (see Figure 9).

Respondents were least likely to report they had consumed food containing CBD (31%).
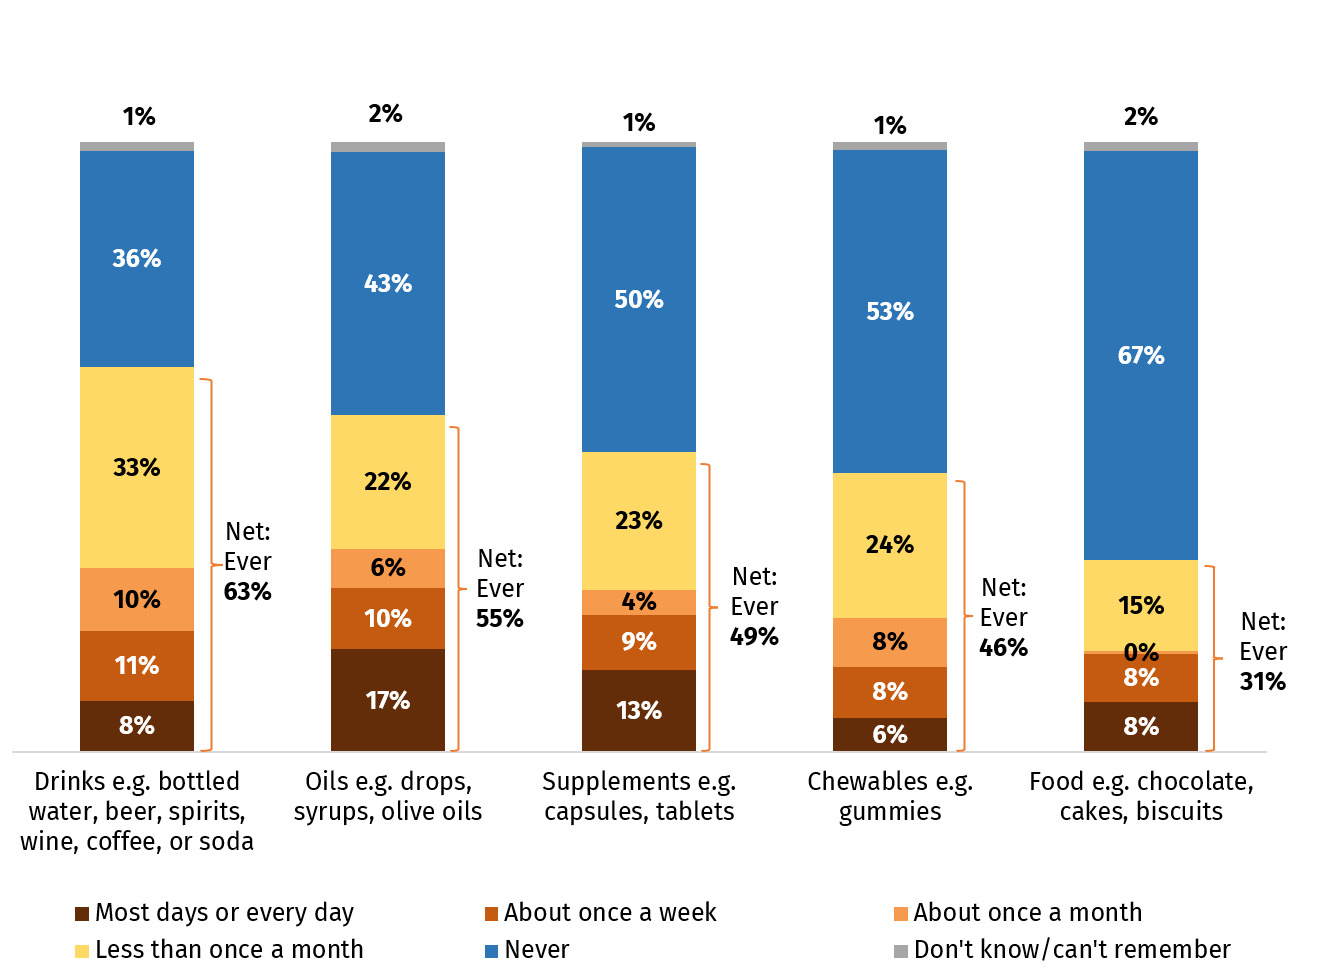
This chart shows frequency of CBD consumption by product. Drinks and oils are the products that respondents were most likely to have consumed in the last 6 months, with oils being consumed most often.
Figure 9.Frequency of CBD consumption by product

Note: QCBD2. How often, if at all, have you used or consumed the following products containing CBD in the last 6 months? Please select one answer only for each statement. Base: All who have consumed CBD in June 2026 (n=174). Sampling and weighting updated to include ethnicity in June 2026.

3.6. Cell-cultivated products

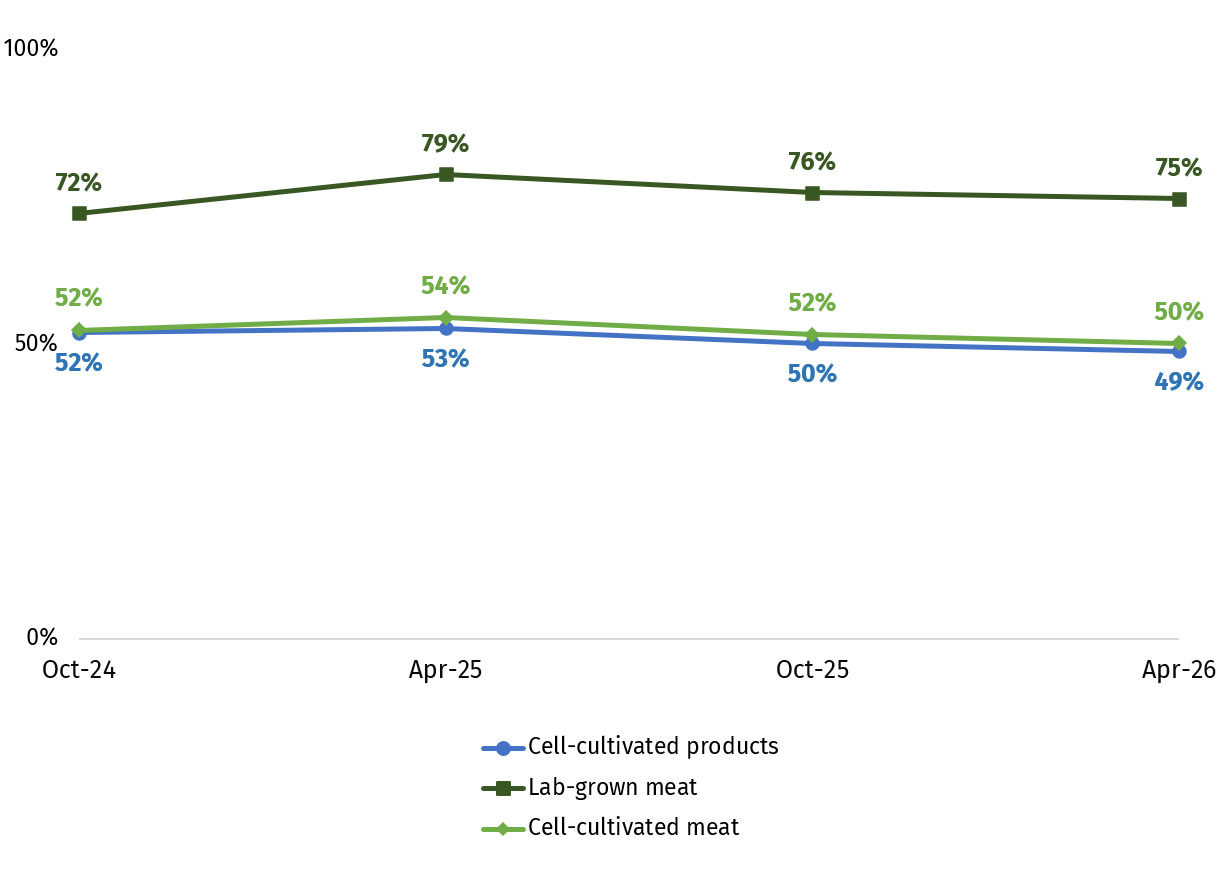
Figure 10 shows that when prompted with a definition of each term, respondents in April 26 continued to be more familiar with lab-grown meat (75%), than cell-cultivated meat (50%) and cell-cultivated products (49%). While these were all comparable to October 25 when these questions were last asked, awareness of all terms has decreased slightly in comparison to April 25.
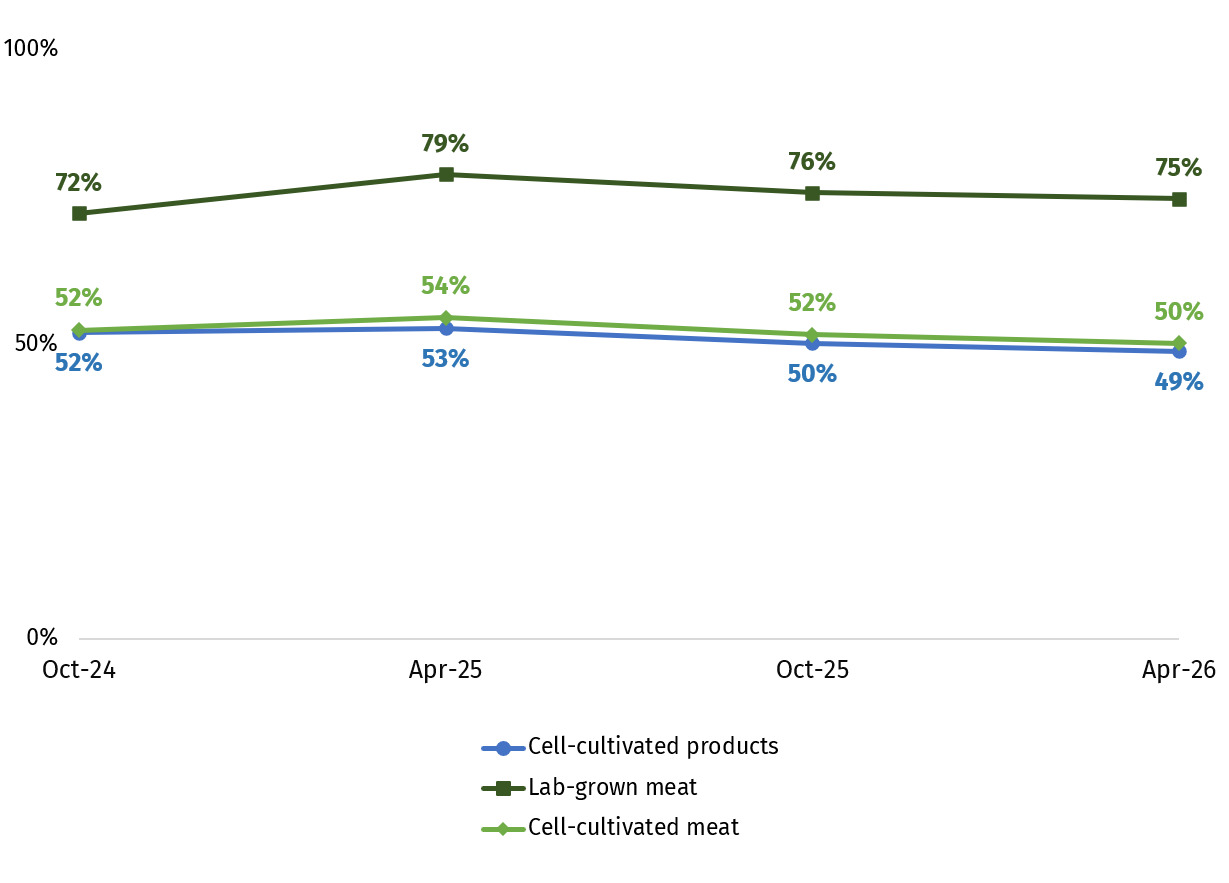
This chart shows the proportion of respondents who were aware of certain cell-cultivated terms. In April 2026 they were most likely to be aware of lab-grown meat (75%), compared to cell-cultivated meat (50%) and cell-cultivated products (49%).
Figure 10.Proportion who have heard of cell-cultivated product terms before

Note: QCCP1. Before taking part in this survey had you heard of the following terms. Figures shown in chart are the proportion ‘Yes, and I knew what it was’ and ‘Yes, but I didn’t know what it was’. Base: All in April 2026 (n=2,109) October 2025 (n=2,136), April 2025 (n=2,120) and October 2024 (n=2,009).

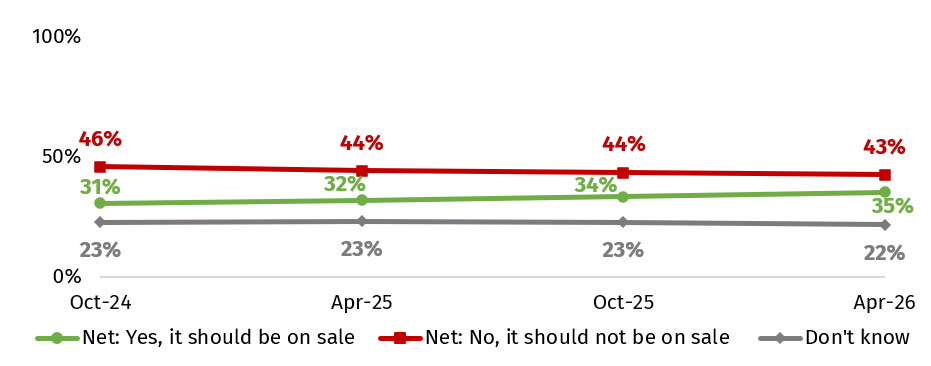
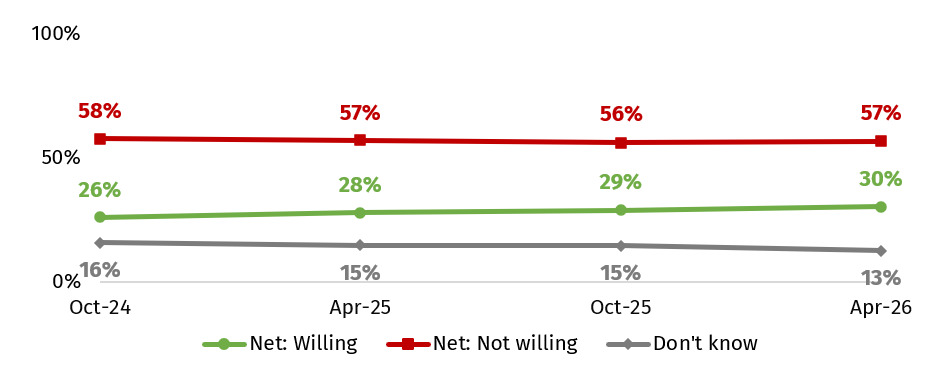
Views on sale of cell-cultivated meat, willingness to include in diet, and confidence in regulation remain mixed, with a sizeable minority saying they ‘don’t know’ (see Figures 11, 12 and 13). For example, in June 2026 43% of respondents said that cell-cultivated meat should not be on sale in the UK in the future, and 35% said it should. 22% were unsure. This pattern is consistent with previous months.
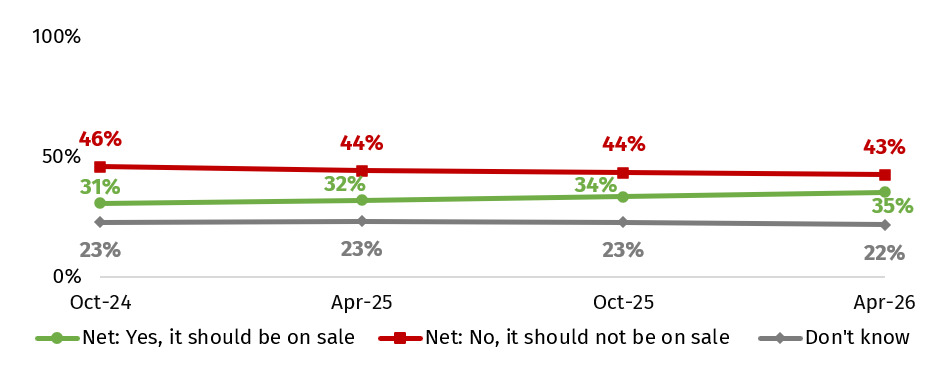
The chart shows the proportion who think cell-cultivated meat should be on sale in the UK in the future. In April 2026 this was 35%.
Figure 11.Should cell-cultivated meat be on sale in the UK in the future

Note: QCCP2. Do you think that cell-cultivated meat should or should not be on sale in the UK in the future? Figures shown in chart are the proportion who said ‘Yes, it should probably be on sale’ and ‘Yes, it should definitely be on sale’ / ‘No, it should probably not be on sale’ and ‘No, it should definitely not be on sale’. Base: All in April 2026 (n=2,109), October 2025 (n=2,136), April 2025 (n=2,120) and October 2024 (n=2,009).

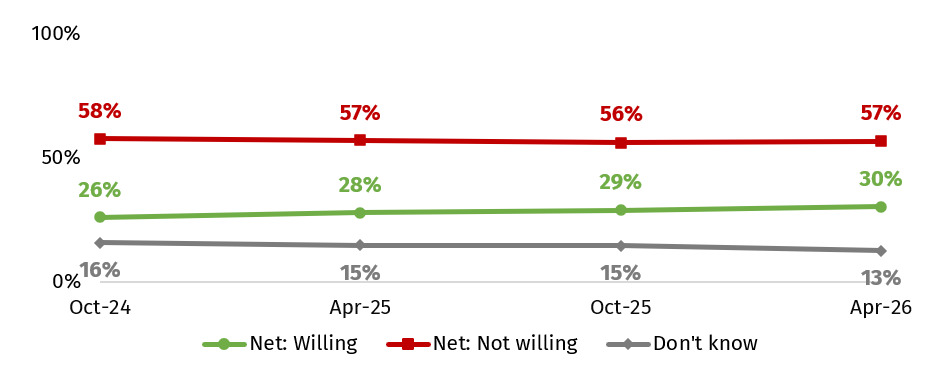
This chart shows the proportion who would be willing to include cell-cultivated meat in their diet. In April 2026 this was 30%.
Figure 12.Willingness to include precision fermented dairy in diet

Note: QCCP3. If it was authorised for sale in the UK, how willing or unwilling would you be to include cell-cultivated meat in your diet? Figures shown in chart are the proportion ‘Very willing’ and ‘Somewhat willing’ / ‘Very unwilling’ and ‘Somewhat unwilling’. Base: All in April 2026 (n=2,109), October 2025 (n=2,136), April 2025 (n=2,120) and October 2024 (n=2,009).

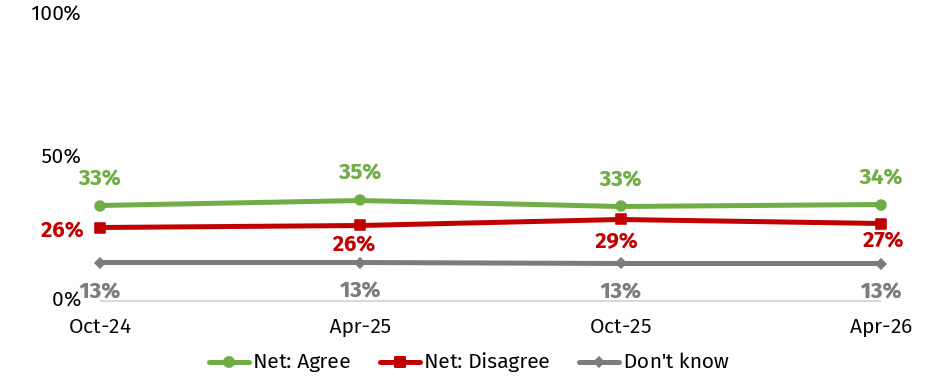
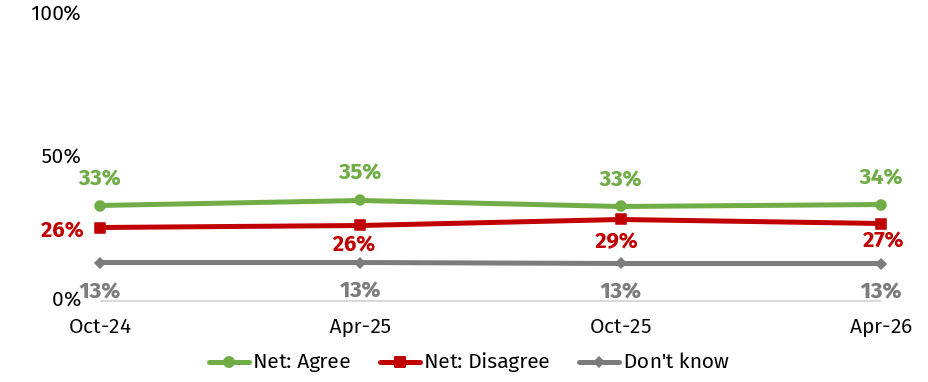
This chart shows the proportion who feel confident that regulation will prevent unsafe cell-cultivated meat being sold in the UK. In April 2026 this was 34%.
Figure 13.‘I am confident that regulation will prevent unsafe cell-cultivated meat being sold in the UK’

Note: QCCP6. To what extent do you agree or disagree with the following statement: I am confident that regulation will prevent unsafe cell-cultivated meat being sold in the UK. Figures shown in chart are the proportion ‘Strongly agree’ and ‘Agree’/ ‘Strongly disagree’ and ‘Disagree’. Base: All in April 2026 (n=2,109), October 2025 (n=2,136), April 2025 (n=2,120) and October 2024 (n=2,009).

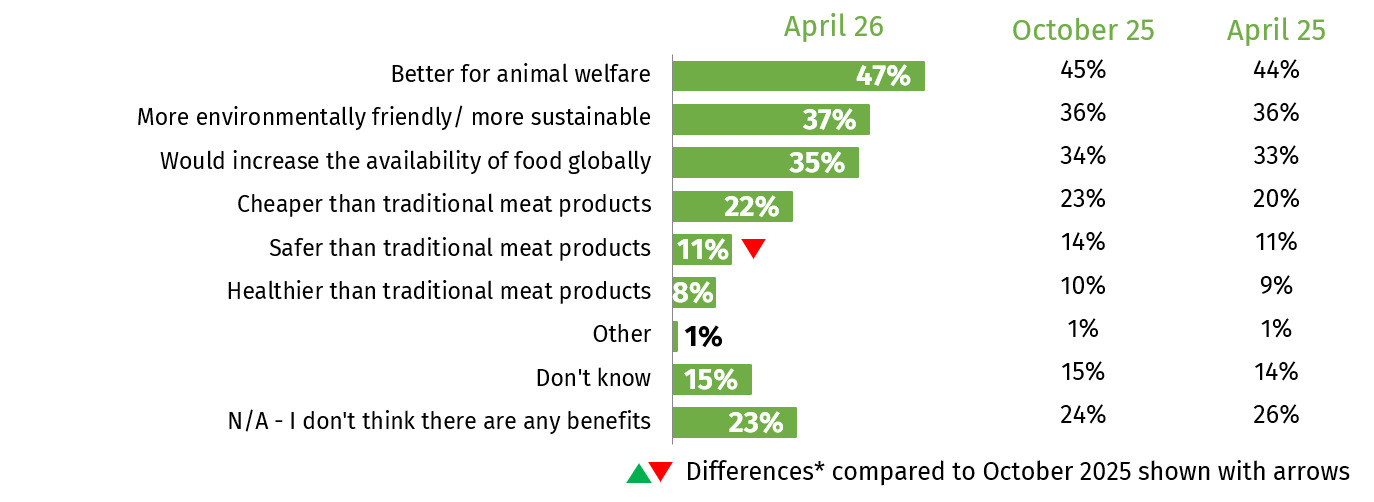
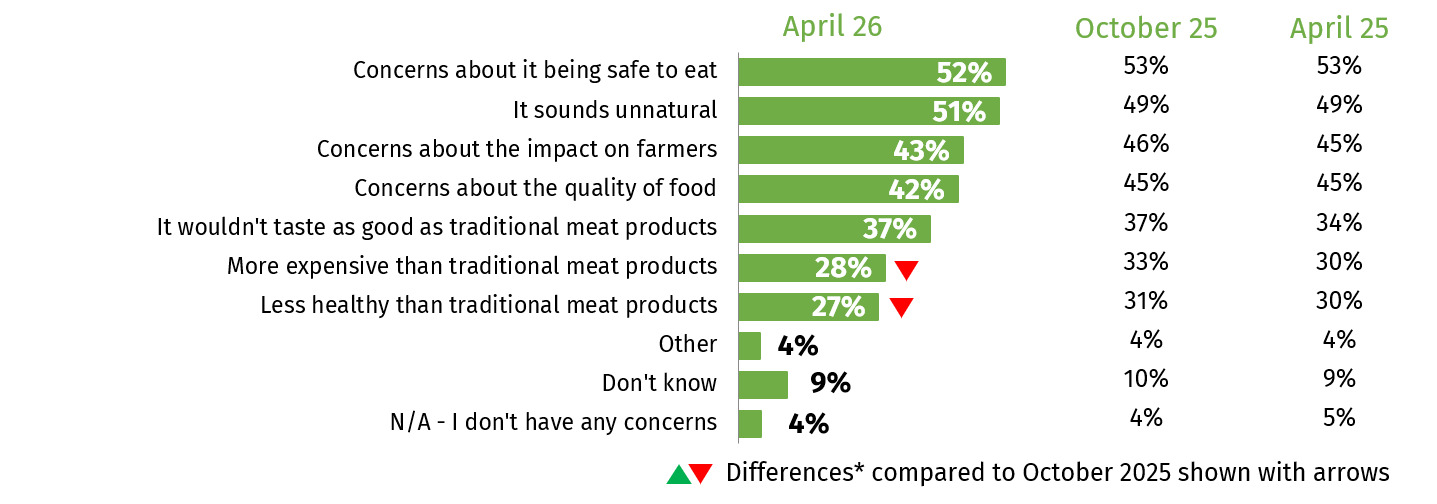
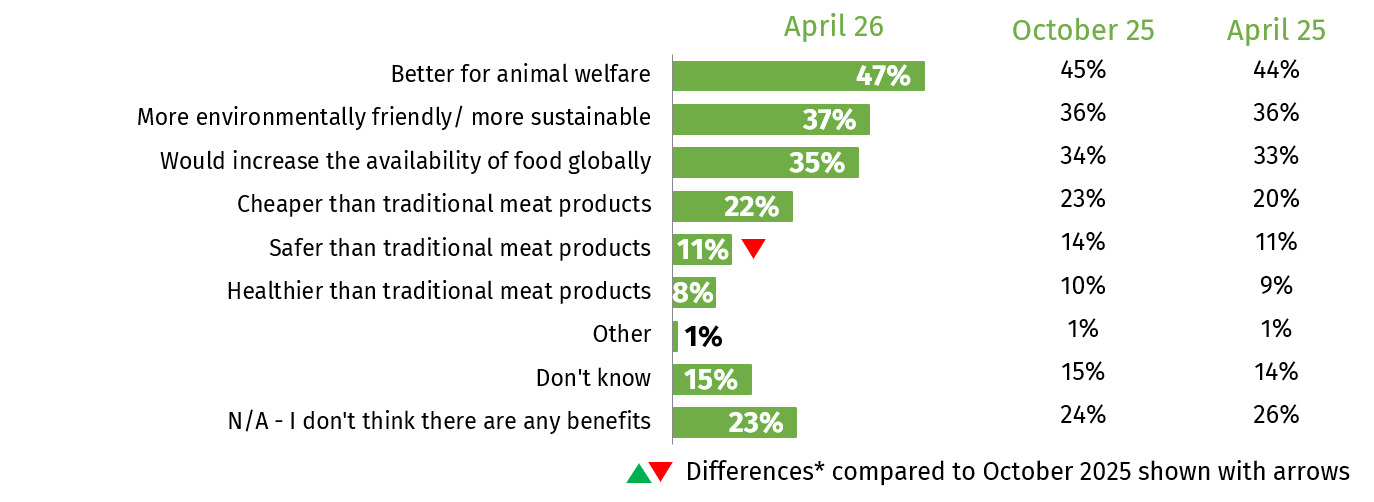
When prompted with a list of potential benefits and concerns about cell-cultivated meat, the most common benefit in April 26 was seen to be animal welfare (47%), and the top concern was about it being safe to eat (52%). The most common perceived benefits and concerns have remained consistent between waves (see Figures 14 and 15).
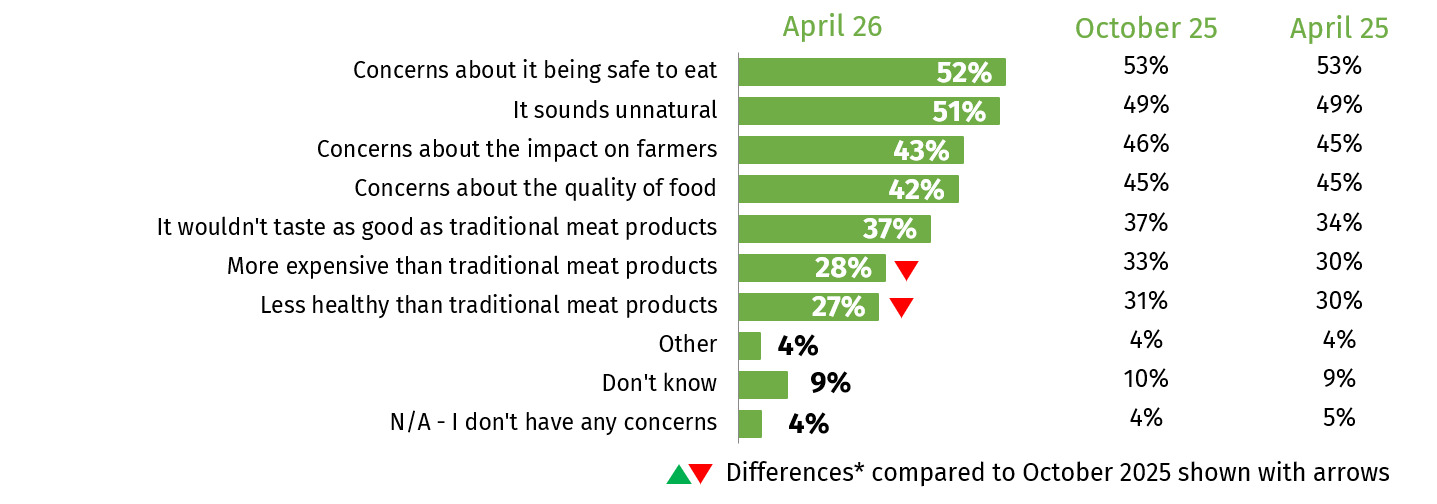
The chart shows concerns around cell-cultivated meat. In April 2026, the most common concern was around cell-cultivated meat being safe to eat (52%).
Figure 14.Perceived benefits of cell-cultivated meat

Note: QCCP4. What benefits, if any, do you think cell-cultivated meat could offer compared to traditional meat products? Select all that apply. Note: Multiple responses allowed. As a result, percentages do not total 100%. Base: All in April 2026 (n=2,109), October 2025 (n=2,136), April 2025 (n=2,120). *Differences compared to October 2025 shown with arrows, see notes for interpretation for more information.

The chart shows the perceived benefits of cell-cultivated meat among respondents. In April 2026 the most common perceived benefit was animal welfare (47%).
Figure 15.Concerns about cell-cultivated meat

Note: QCCP5. What concerns, if any, do you have about cell-cultivated meat? Select all that apply. Note: Multiple responses allowed. As a result, percentages do not total 100%. Base: All in April 2026 (n=2,109), October 2025 (n=2,136), April 2025 (n=2,120). *Differences compared to October 2025 shown with arrows, see notes for interpretation for more information.

Further information

For more information:

Acknowledgements

FS code FS900280


  1. NEWC2. In the past month, where have you seen, read or heard something about these food safety topics? Base: All those who have seen, read or heard of any information about the food safety topics in June 2026 (n=1,242), May (n=1,264), April (n=1,210). Note: Multiple responses allowed. As a result, percentages do not total 100%.