
List of abbreviations
ADI: Acceptable Daily Intake, a measure of the amount of a specific substance (like a food additive) that can be ingested daily over a lifetime without appreciable health risk
ADME: Absorption, distribution, metabolism, and excretion, the four key processes describing how a substance is handled by a biological system
ANOVA: Analysis of variance, a statistical method used to compare the means of two or more groups to determine if they are significantly different
AUC: Area under the curve, used in pharmacokinetics to represent the total exposure to a drug or substance over time
BMI: Body Mass Index (kg/m2), a value derived from the mass and height of a person
bw: Body weight, the amount that a person or animal weighs
CHA: Cyclohexylamine, a primary metabolite formed from the breakdown of cyclamate by gut bacteria
CI: Confidence interval, a statistical range of values that is likely to include an unknown population parameter with 95% confidence
Cmax: Peak plasma concentration, or maximum concentration of a substance in the blood following administration
CNS: Central nervous system, the complex of nerve tissues that controls the activities of the body
DKP: Diketopiperazine, a degradation product of aspartame
DMPK: Drug Metabolism and Pharmacokinetics
EDI: Estimated Daily Intake
EFSA: European Food Safety Authority
FSA: Food Standards Agency, the UK government department responsible for food safety and hygiene
GC-MS: Gas chromatography-mass spectrometry, an analytical method for identifying substances within a test sample
GF: Germ-free, (referring to animals used in laboratory studies)
GI: Gastrointestinal
GLC: Gas-liquid chromatography
GSG: Glucosylated steviol glycosides
HFI: Hereditary Fructose Intolerance
IQR: Interquartile range, a measure of statistical dispersion
IV: Intravenous, administered into a vein
JECFA: Joint FAO/WHO Expert Committee on Food Additives
kg: Kilogram, a metric unit of mass equal to one-thousand grams
LIMS: Laboratory information management system
LOD: Limit of detection, the lowest quantity of a substance that can be distinguished from the absence of that substance
LOQ: Limit of quantitation, the lowest concentration at which an analyte can not only be detected but also quantified with acceptable precision and accuracy
NAD+: Nicotinamide adenine dinucleotide
NBL: Nutritional Biomarker Laboratory, at IMS Epidemiology, University of Cambridge
NDNS: National Diet and Nutrition Survey, a continuous cross-sectional survey designed to collect detailed information on food consumption and nutritional status in the UK
NSS: Non-sugar sweeteners, artificial or non-nutritive sweeteners
µL: microlitre, a metric unit of volume equal to one-millionth of a litre
µmol: micromole, a unit of amount of substance equal to one-millionth of a mole
mL: millilitre, a metric unit of volume equal to one-thousandth of a litre
mmol: millimole, a unit of amount of substance equal to one-thousandth of a mole
OHID: Office for Health Improvement and Disparities, (referred to in source as the Office for Heath and Income Disparity)
PKU: Phenylketonuria, a rare but treatable inherited metabolic disorder that prevents the normal breakdown of protein
PPP: Pentose phosphate pathway, a metabolic pathway parallel to glycolysis
REC: Research Ethics Committee
RSD: Relative standard deviation, a measure of the variability of a data set relative to its mean
RUNSS: Relative urinary concentration of non-sugar sweeteners, (normalised to creatinine)
SACN: Scientific Advisory Committee on Nutrition
SCF: Scientific Committee on Food
Tmax: Time to reach maximum concentration
UCreat: Urinary concentration of creatinine
UNSS: Urinary concentration of the non-sugar sweetener
UPLC-MS/MS: Ultra-pressure liquid chromatography coupled with triple quadrupole mass spectrometry, an analytical technique that combines liquid chromatography with mass spectrometry
Vd / Vss: Volume of distribution, or steady-state volume of distribution
Acknowledgements
The FSA would like to express thanks to the Department for Health and Social Care (DHSC) Office for Health Improvement and Disparities (OHID) for granting access to the NDNS urine sample collection used for this work.
Lay summary
There is a growing interest in the consumption of processed foods and, related to this, the number and amount of food additives consumed in the UK.
This project develops an approach for measuring exposure to food additives through analysis of urine samples collected as part of the UK National Diet and Nutrition Survey (NDNS), using non-sugar sweeteners (NSS) (or artificial sweeteners) as a case study. This research project makes important progress towards developing methodology which may be used to gain a better understanding of actual UK consumer exposure to food additives.
The results of this project demonstrate that exposure to NSS can be detected through analysis of NDNS urine samples, and that this approach could serve as a useful tool for assessing UK dietary exposure to NSS and potentially other food additives.
This work represents an initial exploration of the potential use of urine samples to better understand exposure to food additives. The findings described in this report are indicative only and should not be used to draw conclusions regarding processed food, food additives, or NSS exposure at this stage. Whilst the findings described in this report are not reliable estimates of individual exposures to NSS, using worst case assumptions, there is no indication from this study that exposures are unsafe.
The report includes recommendations for further work to refine the approach and improve understanding of food additive consumption and exposures, with a view to being able to make reliable exposure estimates.
Executive summary
There is a growing interest in the consumption of processed foods and, related to this, the number and amount of food additives, consumed in the UK.
Understanding population-level exposure to non-sugar sweeteners (NSS) is a public health priority given their ubiquity in processed foods and the current limitations in dietary intake monitoring. Food manufacturers are not mandated to disclose specific additive quantities, and databases underpinning dietary assessment for the UK National Diet and Nutrition Survey (NDNS) lack data on levels of NSS and other additives in foods. Dietary data collection in the NDNS is designed to assess nutrient intakes, not intakes of NSS or other additives.
This proof-of-concept study aimed to develop an ultra-pressure liquid chromatography coupled with triple quadrupole mass spectrometry (UPLC-MS/MS) biomonitoring approach to measure 7 NSS in stored NDNS single spot urine samples (collected between 2022 and 2023) from the perspective of assessing UK consumer exposure.
The study successfully measured several commonly used sweeteners, including acesulfame K, saccharin, sodium (Na) cyclamate and sucralose, as well as natural sugar alcohols, like erythritol and xylitol. A significant analytical limitation remains for the direct measurement of aspartame due to its rapid metabolism into endogenous compounds, but its intake can be estimated using acesulfame K as a proxy marker. Furthermore, the use of spot urine samples is limited for individual-level quantification because of the short half-lives of most sweeteners (typically 2 to 8 hours), making results highly sensitive to the timing of recent consumption.
Key findings within this proof-of-concept study were:
-
NSS exposure is essentially universal across the UK population, with 90% of samples containing at least 1 artificial sweetener and 85% containing 4 or more different NSS.
-
Children and adolescents (ages 4 to 18 years) exhibited significantly higher relative concentrations and a greater variety of detectable NSS when compared to adults.
-
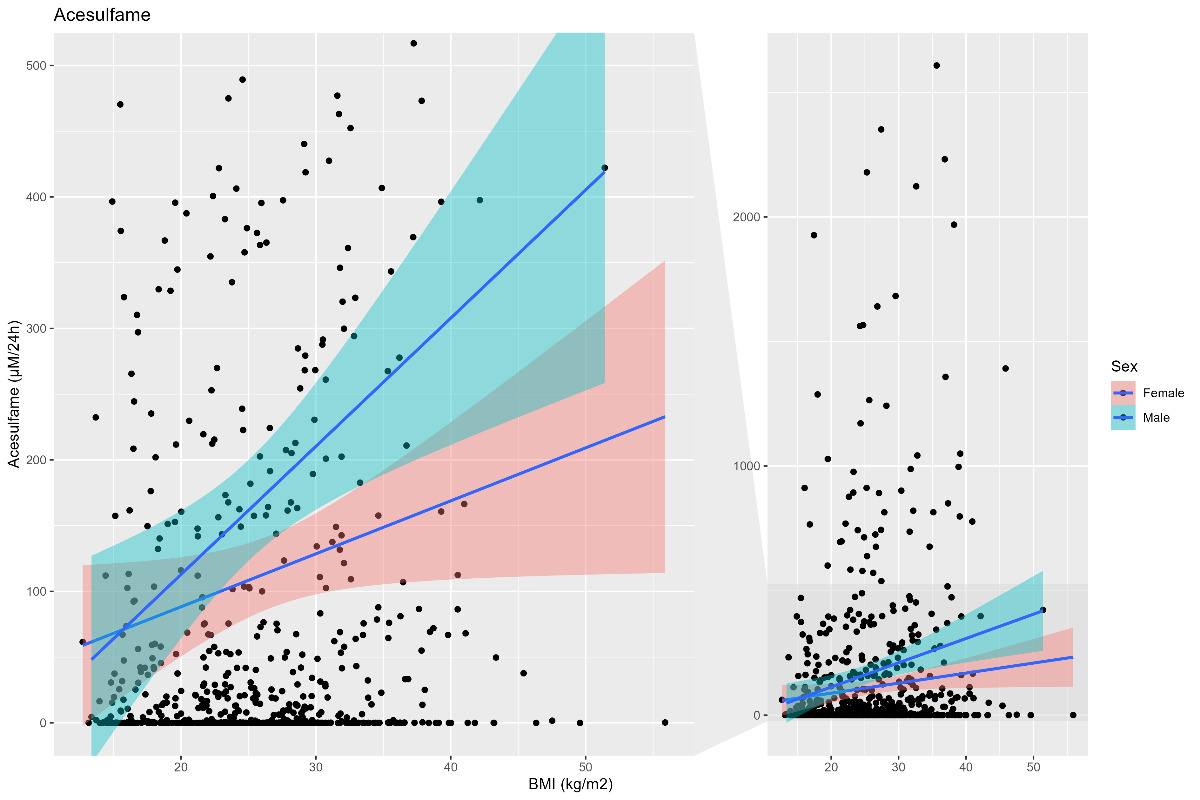
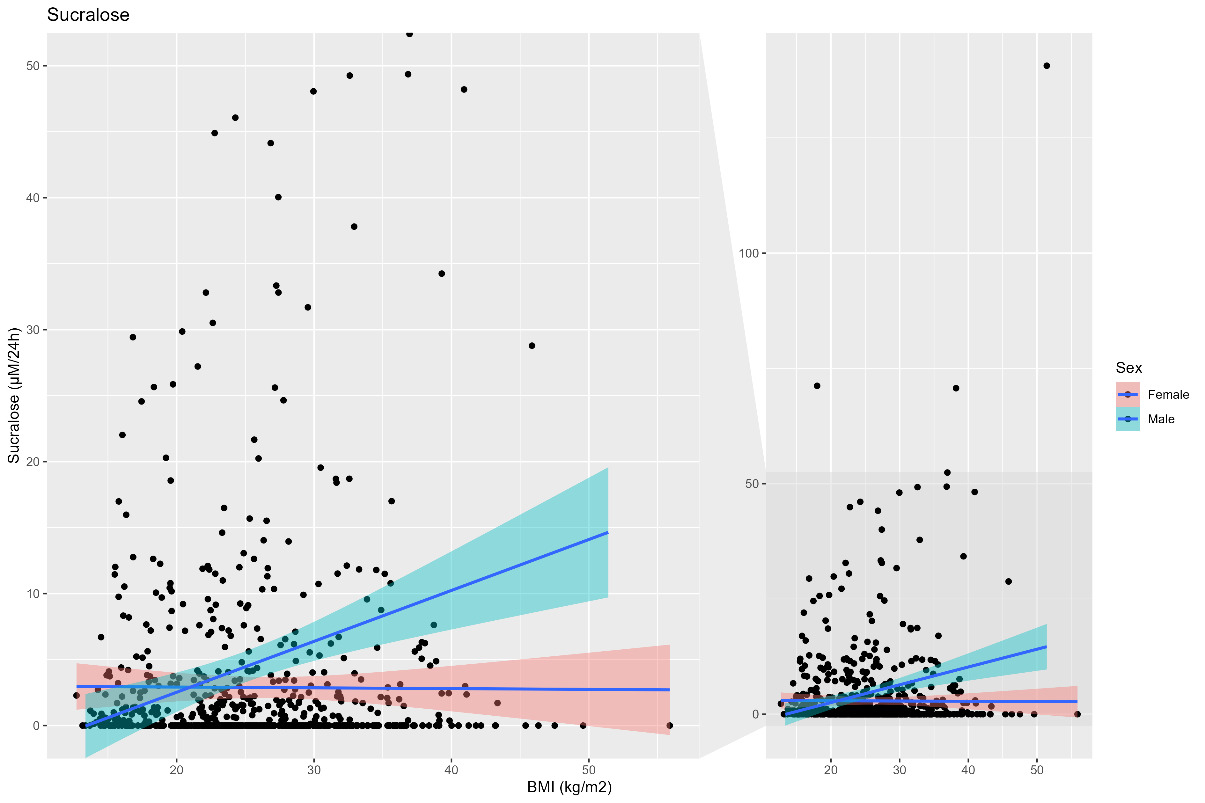
Estimated daily urinary excretion of certain sweeteners, such as Na cyclamate and saccharin, showed a negative association with household income, while sucralose and acesulfame K concentrations were higher in males and in those with a higher body mass index (BMI).
-
The study indicates that exposure is widespread and exposure to NSS represents the population norm; there was a wide range of detected concentration of NSS in spot urine samples. It is assumed that the highest concentrations detected are attributable to recent intakes and are not expected to be indicative of continued daily exposures.
Recommendations:
-
Intake quantification: Validation of NSS biomarker measurement in 24-hour urine samples presents an opportunity to transition assessment from qualitative exposure marking to intake quantification; priority should be given to the analysis of 4,380 stored 24-hour urine samples from previous NDNS years.
-
Future biomonitoring: The upcoming NDNS Urinary Sodium Survey (due to commence later in 2026) may provide an opportunity to integrate NSS biomarker analysis in 24-hour samples alongside dietary intake assessment, to refine estimates and enable time-trend estimates.
-
Matrix effects: Further investigation is required to determine how food matrices (e.g., matrices high in fat or protein) within processed foods affect the absorption and excretion kinetics of these additives, to facilitate more accurate integration of dietary and biomonitoring data.
In conclusion, this research confirms that urinary biomarkers are a suitable tool for assessing population-level NSS exposure in the UK. While spot urine analysis provides a valuable qualitative snapshot of exposure, measurement in 24-hour urine samples will provide the next step towards quantitative exposure data.
1. Introduction
There is a growing interest in the potential health effects linked to consumption of processed foods that contain higher levels of food additives. Knowledge on the extent of processed food consumption, and exposure to food additives is currently very limited (SACN, 2025). Advancing understanding in this area is complex and multifaceted; an important starting point is to increase the evidence base through investigation of novel approaches to assessing consumer exposures.
The National Diet and Nutrition Survey (NDNS) is the primary, nationally representative tool for monitoring dietary intake and providing food consumption data for adults and children over 18 months of age in the UK. However, there are significant limitations in the use of dietary data to monitor intakes of NSS and other additives as manufacturers are not mandated to provide quantitative data on the additives in their products and so databases underpinning dietary assessment lack information on levels of additives.
The NDNS dietary assessment is designed to estimate intakes of foods, with a focus on determination of intake of sugar and other nutrients, rather than NSS or other additives, and data is captured at generic, rather than individual, product level. Many soft drinks and other products contain both sugar and NSS. While it can be assumed that no added sugar soft drinks contain NSS, it is not possible to distinguish between sugar-containing products that also contain NSS from those that do not, other than at an individual product level. It is therefore extremely challenging to assess the daily exposure to NSS in the UK (SACN, 2025).
An approach to address this evidence gap for NSS and other additives is to assess consumer exposure using biomarker measurement. This research project aims to make progress towards a better understanding of approaches to assess UK consumer exposure to food additives through the measurement of biomarkers of NSS in the urine samples that are collected as part of the NDNS. The specific objectives are:
-
Develop an approach to measure NSS in stored spot urine samples of the NDNS
-
Use literature data to enable the interpretation of the urinary concentration of biomarkers of food additives as estimates of exposure
-
Consider the potential for integration of other NDNS data (age, BMI, ethnicity, income) with biomonitoring data from the NDNS biological samples
-
Provide information on the qualitative and quantitative ranges of exposure to NSS and explore differences between population groups, where possible
-
Provide recommendations for further work to refine the approach to better understand the exposure to additives through the use of biomarkers.
1.1. Non-sugar sweeteners (NSS)
There are 22 different non-sugar sweeteners (NSS) approved for use in food, drinks and consumer products in Great Britain (GB) (not including different forms of the same substance), described in the FSA list of approved additives and E numbers (FSA, 2025). NSS, or artificial sweeteners, are food additives with a strong sweet taste and minimal energy content that can be used to replace sugar and other sweet tasting carbohydrates with a high energy content. There is widespread use of NSS to adjust the taste of manufactured consumer products, as well as direct discrete use of NSS by consumers. Consumers are broadly exposed to NSS through food and drinks, particularly processed foods in which their use is permitted, as well as through oral care products such as toothpaste. Due to their wide-spread presence across the food system and beyond, and given the paucity of composition data on use of additives in such products, it is challenging to accurately model exposure of the population to NSS using dietary intake data. This is even more difficult to estimate at an individual level (Abushamat et al., 2025; Kan et al., 2024).
There is very little objective evidence on NSS exposure. Most people in the UK are not aware of, let alone certain about, their own NSS consumption (Kan et al., 2024), and most work has focused on explicitly labelled food products, like artificially sweetened beverages (Amoutzopoulos et al., 2020). The UK Government’s Scientific Advisory Committee on Nutrition (SACN) published their statement on the WHO guideline on NSS (SACN, 2025). In the statement, they highlighted difficulties in reliably estimating a person’s consumption of NSS without a laboratory analysis of their diet or appropriate biomarkers. SACN identified different studies that suggest the potential for improved monitoring of exposure to NSS through analysis of urinary biomarkers (Diepeveen-de Bruin et al., 2023; Logue et al., 2020; Myers et al., 2018; Shi et al., 2022) and recommended in their statement that government develop innovative ways to reliably monitor exposure to NSS (SACN, 2025).
NSS, like all food additives, may be used only in food for which they are authorised, and only up to their maximum permitted level; such food products can only be placed on the market following satisfactory safety assessment, which includes a dietary exposure assessment (FSA).
Exposure assessments are typically based on scenarios, taking the maximum permitted use level, in combination with food consumption data from dietary surveys; in the UK, these data on consumption are obtained from the NDNS (University of Cambridge, 2025; Venables et al., 2022).
Actual individual consumer exposures to NSS in the UK are uncertain, which was acknowledged in the SACN statement (SACN, 2025). Current regulations in GB require companies to list NSS on product labels, but they are not mandated to disclose specific quantities. Consequently, it is currently impossible to accurately estimate intakes using food consumption data.
This research project is a proof-of-concept exercise intended to develop approaches for estimation of exposure to NSS, aimed to address current limitations and gaps in the evidence base. This study tests and develops biomarker methods to determine the qualitative and quantitative occurrence of NSS in urine. This work is an essential first step in NSS exposure assessment using biomarkers, providing the foundation for development of a robust measurement framework to underpin future research to understand key population factors associated with additive exposures.
1.2. Approach
The Nutritional Biomarker Laboratory (NBL), part of IMS Epidemiology at the University of Cambridge, developed an ultra-pressure liquid chromatography coupled with triple quadrupole mass spectrometry (UPLC-MS/MS) analysis that measures the most commonly used and consumed NSS in urine. With this method, NBL can measure acesulfame K, sodium (Na) cyclamate, saccharin, and sucralose. In the same method, it is also possible to measure the urinary concentrations of natural NSS (polyols), erythritol, mannitol/sorbitol, and xylitol/arabitol (see section 2.3). One important NSS that is not included in this method is aspartame, which consists of the two amino acids, aspartate and phenylalanine. Aspartame is metabolised into phenylalanine, aspartate and methanol, which are all endogenous (naturally present in the body). In the concentration ranges permitted for use of aspartame as a food additive, aspartame consumption does not significantly affect the concentrations of these compounds in plasma and urine. Therefore, consumption of aspartame is unlikely to result in any measurable metabolic changes that could be used as biomarkers. Aspartame is often combined with acesulfame K at common ratios and so, for the purpose of this work, it is proposed that acesulfame K might be used as a proxy for aspartame exposure.
The method described was used to analyse 740 single (spot) urine samples collected between 2022 and 2023 (Year 15) of the NDNS, which were stored with participant consent for future research in the NDNS Bioresource (www.epi.ims.cam.ac.uk/research/measurement-platform/ndns-bioresource/).
In addition, urinary creatinine was measured in the same samples to normalise the measured concentrations and derive a comparable measure of NSS excretion across different samples and the corresponding NDNS participants.
One of the objectives of this project was to inform on the suitability of the approach to estimate intake of NSS from excretion of biomarkers in spot urine samples. This was to include consideration of, and recommendations for, further research, data, changes to methodology (NDNS, analytical chemistry, or analysis), and other information that would improve the reliability of estimation of intake of NSS from NDNS urine samples.
2. Materials and methods
2.1. Ethics
Ethics approval was obtained for the study from the Cambridge South Research Ethics Committee, through an amendment (Number 33) of the National Diet and Nutrition Survey (NDNS) Rolling Programme (RP): Years 6 to 9, 2013 to 2017 (REC reference: 13/EE/0016).
Department for Health and Social Care (DHSC) Office for Health Improvement and Disparities (OHID) gave permission to use the NDNS samples, and the urine samples were then retrieved from the NDNS Bioresource. Within the NDNS sample collection, there were up to 3 aliquots of 1.7 mL of urine for each participant. The Biorepository retrieved the samples and aliquoted 250 µL into a new vial for analysis, with the remaining sample being returned to storage.
2.2. Urine samples
The UK NDNS is a nationally representative cross-sectional survey that collects detailed information on food consumption, nutrient intake, and nutritional status in the UK population. Participants were invited to give a single spot urine sample, collected as part of the usual procedures of NDNS. The detailed protocol is available as Appendix M to the NDNS 2019 to 2023 report (https://www.gov.uk/government/statistics/national-diet-and-nutrition-survey-2019-to-2023/national-diet-and-nutrition-survey-2019-to-2023-report).
Spot urine samples were collected from participants aged 4 years and over during or following a face-to-face visit. Participants were asked a series of screening questions to assess their eligibility for providing a spot urine sample. Participants aged under 4 years, those using a urinary catheter, and those who were incontinent were excluded and not asked to provide a spot urine sample. The first morning void was excluded from sampling. If participants could not provide a sample during the interviewer’s visit, then the interviewer could, at their discretion, leave a home collection kit. All samples were posted to IMS Epidemiology Biorepository. Upon receipt, the samples were logged into a laboratory information management system (LIMS) (LabVantage Solutions Limited, High Wycombe, UK) for traceability. Samples were cross-checked in the study database to ensure correct labelling and to verify identification. Samples were aliquoted and frozen (at –70°C) on the day of receipt.
The main aim for the NDNS spot urine collection is to assess population level iodine status. All participants providing a spot urine sample provided at least one dietary recall although the diary day did not necessarily correspond to the day of urine collection. However, data was not collected specifically about processed food or NSS consumption.
The total number of samples available for analysis from NDNS Year 15 was 740, representing 740 individual participants. Only samples from participants who had consented to storage of samples and use in future research were analysed. As this was a feasibility sub-study, all eligible samples were analysed, covering all age groups collected in NDNS (4 years and over).
2.3. Laboratory testing
For the analysis, 20 µL of urine was mixed with a stable isotope-labelled internal standard mixture, water and acetonitrile, and 10 µL of the resulting solution was injected into the UPLC-MS/MS system. The stable isotope-labelled internal standards were added during sample dilution and processed alongside the target analytes, thereby normalising any variability associated with sample preparation and instrumental analysis.
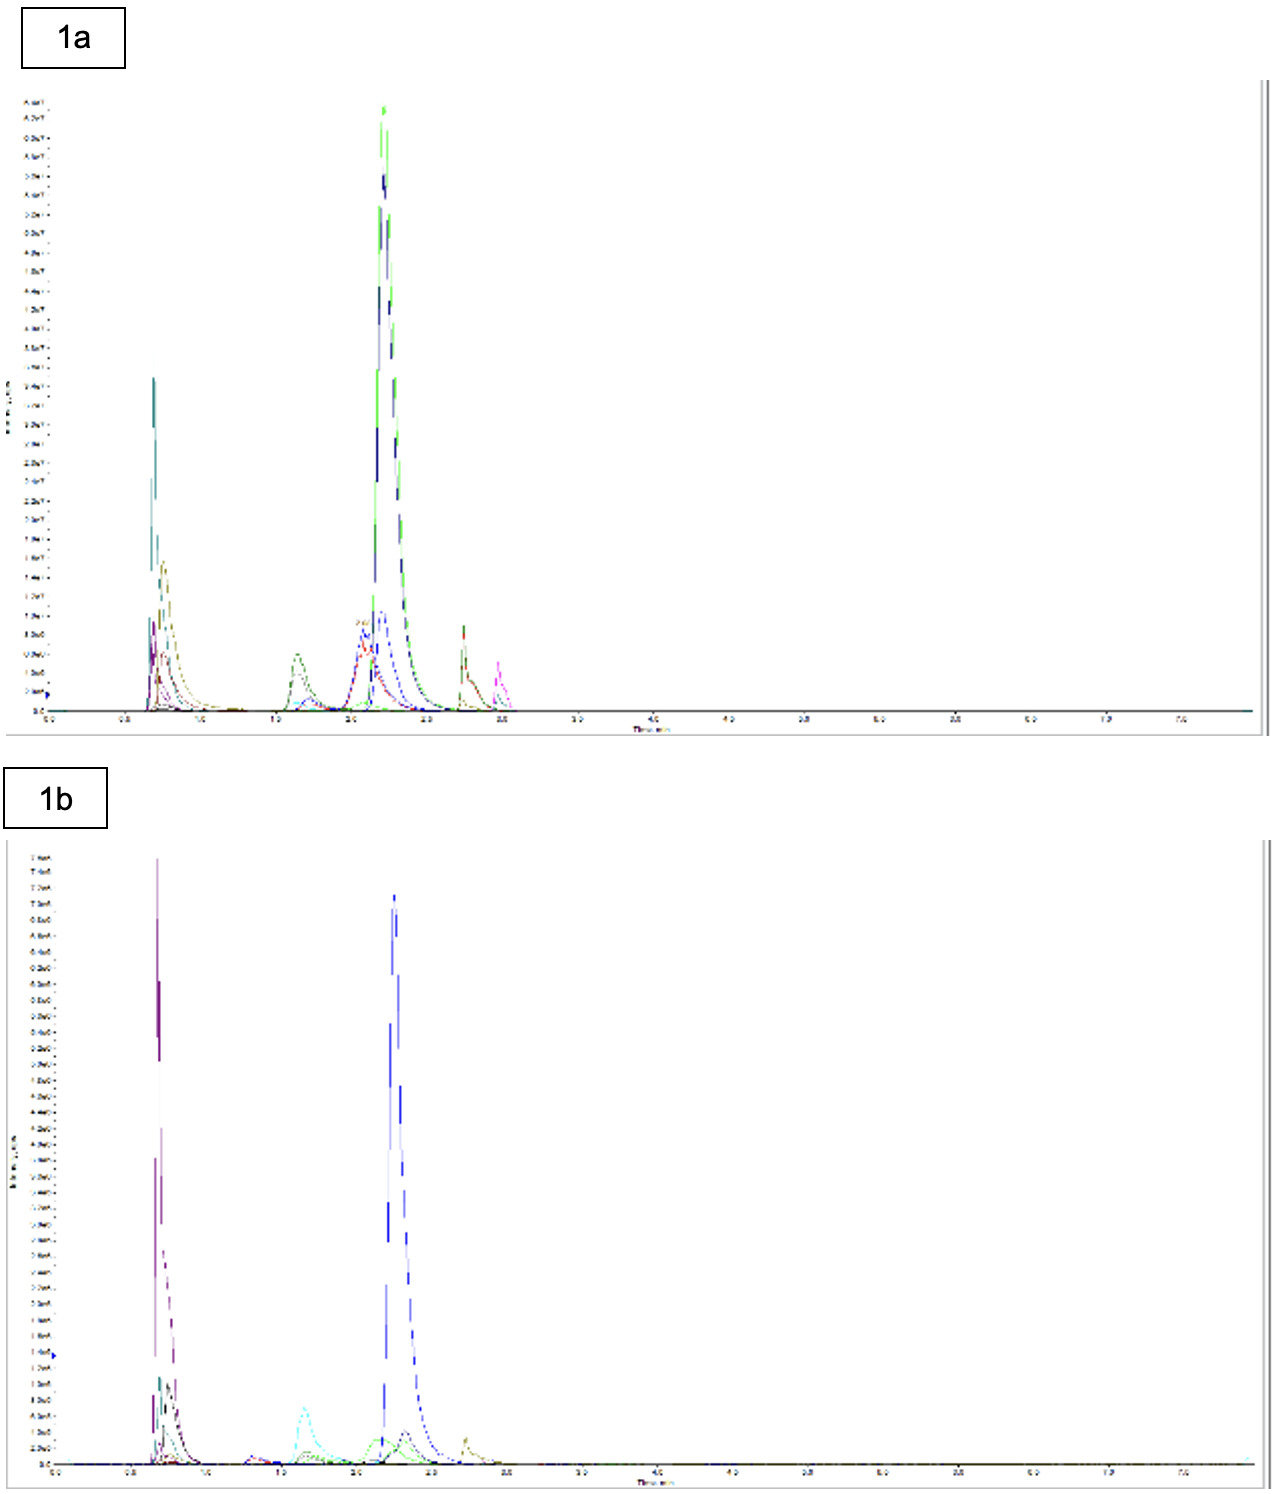
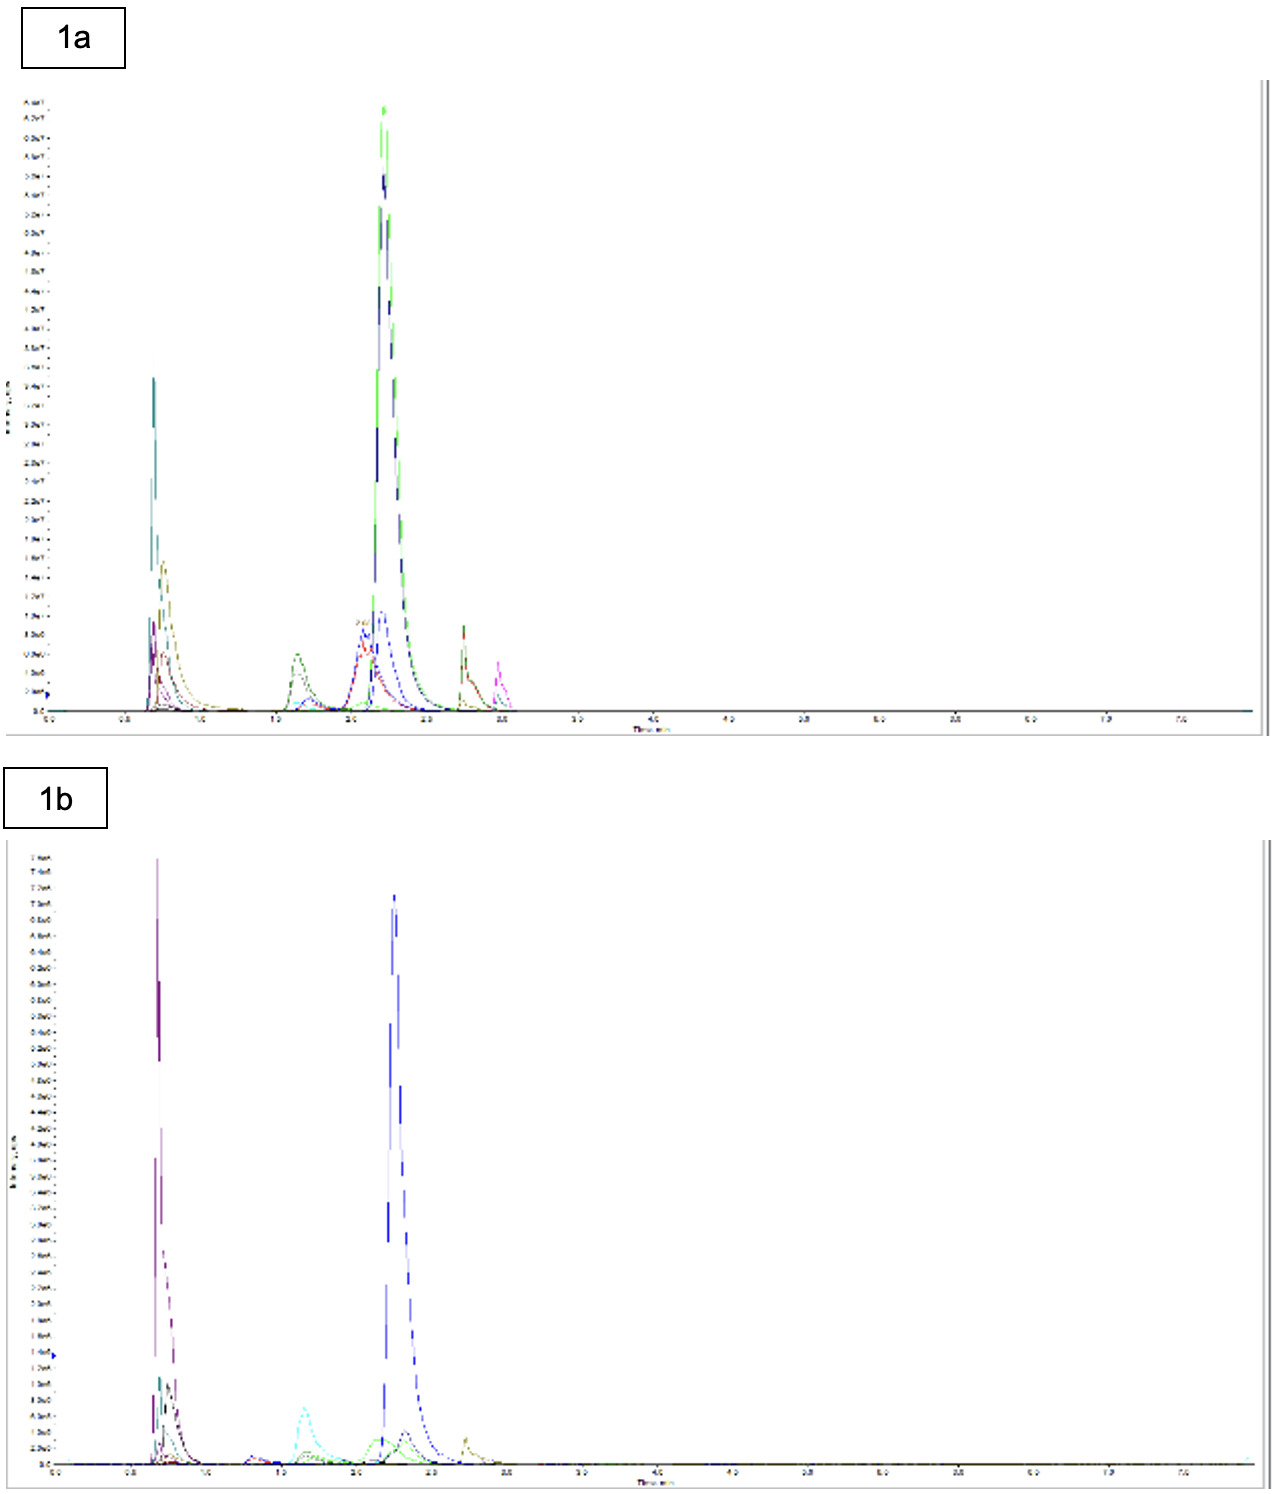
Highly specific separation and detection of the analytes and internal standards was achieved using ultra-pressure liquid chromatography coupled with triple quadrupole mass spectrometry (UPLC-MS/MS). Chromatographic separation was performed using a Phenomenex Luna Omega Sugars column (100 × 2.1 mm, 3µm) with gradient elution employing 5 mM ammonium formate in 90% acetonitrile (mobile phase A) and deionised water (mobile phase B) over an 8-minute run time. Detection was carried out using an AB Sciex 6500+ QTRAP mass spectrometer. Further analytical details are provided in Table 1, and representative chromatograms are shown in Figure 1.
Analyte concentrations were determined by comparing the ratio of the analyte signal to the corresponding internal standard signal with a calibration curve.
Due to matrix interference in the urine samples, reliable quantification of steviol and steviol glycosides was not possible. Consequently, results for these analytes have not been included in this report.
Prior method development work demonstrated that the analytical method provided good precision for the NSS measured in urine, with average variability between measurements of less than 10% (expressed as relative standard deviation, %RSD).
Urinary creatinine was measured enzymatically in 100 µL of urine using a Siemens Dimension Xpand clinical chemistry system, in accordance with the manufacturer’s instructions.
2.4. Data processing
For samples that had values below the limit of quantitation (LOQ), a random value was imputed between the limit of detection (LOD) and the LOQ; see Table 1. This approach was taken to allow for the use of these measurements without skewing the data.
The urinary creatinine concentration allowed correction for the dilution of the urine. All urinary NSS excretions are expressed as the urinary concentration relative to creatinine concentration (RUNSS) as:
\[RUNSS\ (\mu mol\ per\ mmol\ creatinine) = \frac{[UNSS\ (\mu mol)]}{[UCreat\ (mmol)]}\]
Where UNSS is the urinary concentration of the NSS, UCreat is the urinary concentration of creatinine, and RUNSS is the relative urinary concentration of NSS in μmol per mmol creatinine.
It is possible to estimate the total amount of creatinine excreted into urine over 24 hours. This is based on population studies and surveys that cover the same or similar demographic as in the current work. Using the estimated amount of creatinine excreted in 24 hours with the measured concentration creatinine and the measured concentration of NSS, it is possible to estimate the total amount of NSS excreted in 24 hours.
Estimated 24-hour urinary creatinine clearance was used to investigate and analyse trends in estimated 24-hour urinary excretion of biomarkers in different population subgroups (age, sex, socioeconomic status, etc.) and estimate dietary intakes. This required (1) conversion from the concentration of NSS in the spot urine samples to an equivalent 24-hour clearance and (2) estimates of the fraction of NSS intake excreted in urine (Dong et al., 2023). To enable the calculation of daily NSS intake, the previously established approach was used to calculate the daily excretion of the NSS based on measured creatinine excretion concentration, described below (David, 2000; Kohn et al., 2000):
\[\begin{aligned} UNSS24 (μmol\ per\ day) &= [UNSS\ (μmol)] / [UCreat\ (mmol)]\\ & \quad * UCreat24\ (mmol\ per\ day) \end{aligned}\]
Where UNSS24 is the total amount of NSS excreted into urine over 24 hours in μmol, [UNSS] is the urinary concentration of NSS (in mM/L), [UCreat] is the urinary concentration of creatinine (in mM/L) and UCreat24 the reference amount for daily urinary creatinine excretion, which will be based on sex, age and BMI. To estimate the UCreat24 the following equation for adults was used, based on Johner et al. (2015):
\[\begin{aligned} & Creat24\ (mmol\ per\ day)\\ & \quad = ℮^{(1.9539 + 0.1681 \times sex - 0.0027 \times age (years) + 0.0129 \times weight (kg) - 0.0129 \times BMI (kg/m2))} \end{aligned}\]
This equation has only been validated for adults. For children, a table proposed by Remer et al. was used (Remer et al., 2002). It should be noted that these approaches were used to make estimations of NSS intakes from spot urine samples which are subject to significant uncertainties, there are no suitable and recent validations of these prediction models for the UK.
2.5. Statistics
The primary aim of the data analysis was to characterise the distribution of NSS concentrations across age groups: children (4 to 10 years), adolescents (11 to 18 years), young adults (19 to 30 years), adults (31 to 65 years), and older adults (>65 years). Concentration ranges were described separately for males and females, as well as for the combined population. For each analyte, the median and interquartile range (IQR) were calculated, alongside the mean and the 2.5th and 97.5th percentiles.
Differences between age groups were assessed using the Kruskal-Wallis rank-sum test, a non-parametric alternative to one-way analysis of variance (ANOVA), owing to the skewed distribution of the data.
Associations between estimated 24-hour excretion rates and age, sex, government office region, ethnic group, household income, and BMI were investigated using multiple linear regression models. All statistical analyses were conducted using R software (version 3.6.1).
The raw data were made available to the FSA and may be used to develop and validate NSS exposure models using dietary assessment data collected from the same participants.
3. Literature review
3.1. Method
A rapid literature review was conducted using Covidence software, following the approach described by Grant and Booth (2009). The aim of the review was to identify and collate relevant information on the absorption, distribution, metabolism and excretion (ADME) of the NSS being analysed in this project, using the available analytical method. This information was used to support the interpretation of urinary NSS concentration data and may inform future work investigating the relationship between NSS consumption and urinary biomarker concentrations.
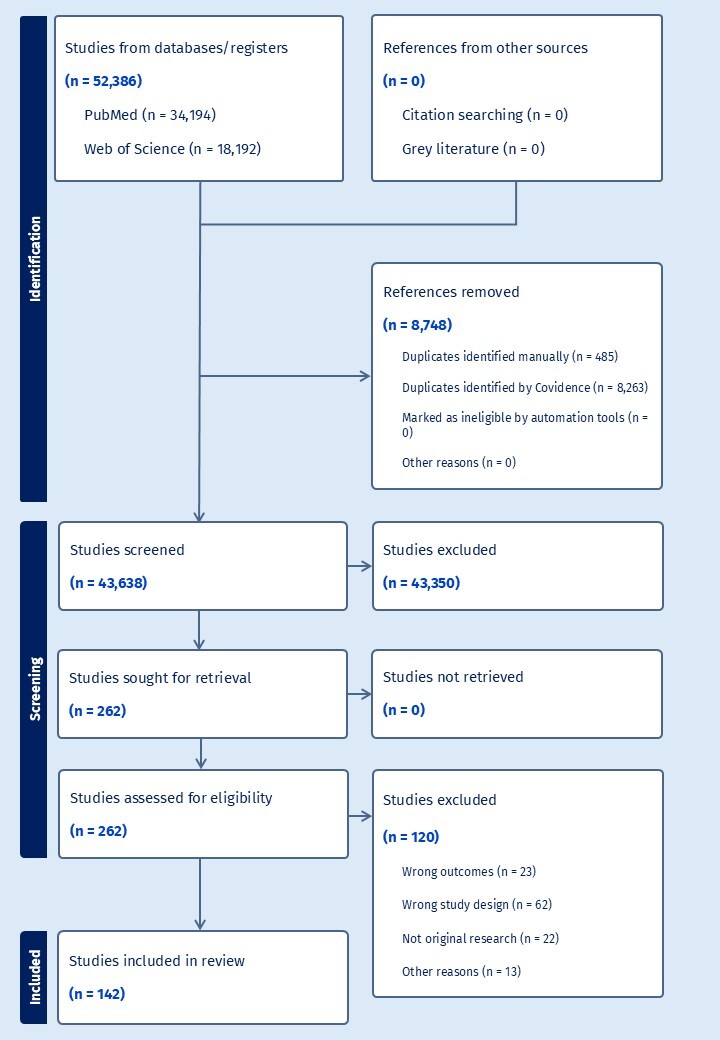
The literature search was performed using the search terms described below and included studies identified through PubMed (pubmed.ncbi.nlm.nih.gov) and Web of Science. As the search was restricted to these bibliographic databases, no additional records were identified through other sources, such as reference lists, grey literature, or manual searches.
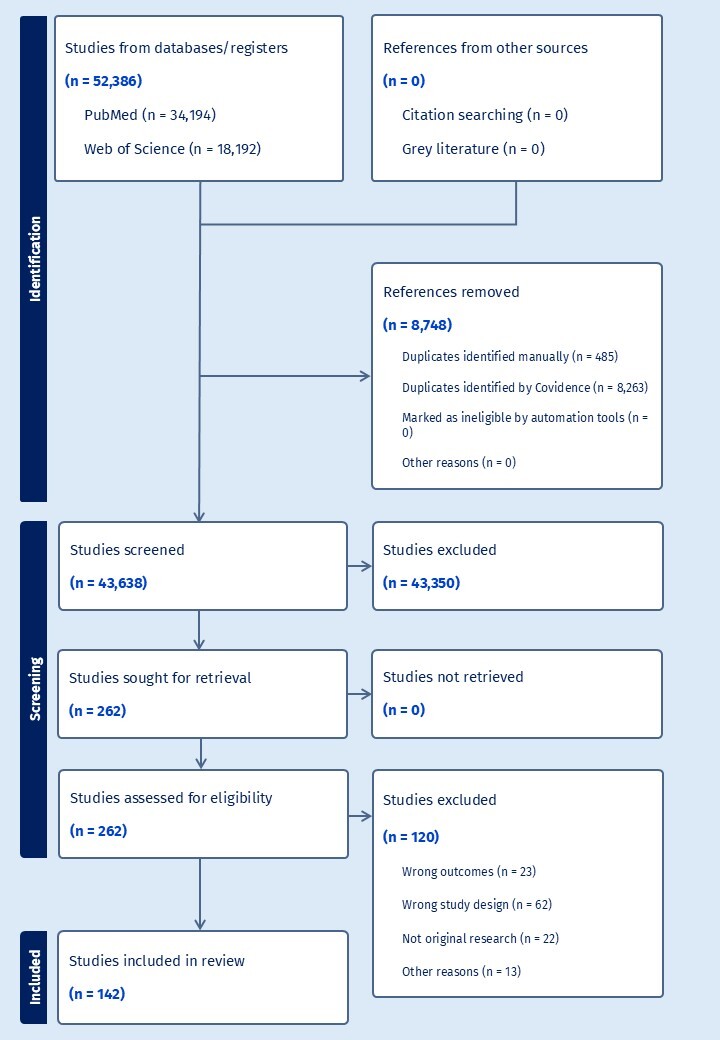
The number of articles screened and selected for inclusion in the review is shown in Figure 2. The findings of the literature review for each NSS are provided in sections 3.2 to 3.11 and include a summary of the ADME in both text and table format.
3.2. Aspartame (E951)
Aspartame (L-aspartyl-L-phenylalanine methyl ester) is a low-calorie, intense sweetener with a molar mass of 294.307 mg/mmol. Identified as food additive E951, it is widely used in various food categories and tabletop sweeteners. Chemically, it is a dipeptide composed of two amino acids, L-aspartic acid and L-phenylalanine, with the latter’s carboxyl group esterified with methanol. Because it is approximately 200 times sweeter than sucrose, only small quantities are required to achieve desired sweetness levels in consumer products (EFSA, 2013).
The literature data on the ADME of aspartame is shown in Table 2.
Absorption and metabolism
Following oral ingestion, aspartame undergoes rapid and complete pre-systemic hydrolysis within the lumen of the gastrointestinal (GI) tract or during passage through the mucosal cells (Hooper et al., 1994). This process is mediated by intestinal enzymes, including esterases and peptidases, such as aminopeptidase A and dipeptidyl peptidase IV. Consequently, intact aspartame is generally undetectable in the systemic circulation. The compound is broken down into three primary constituents:
-
Phenylalanine (approximately 50% by weight)
-
Aspartic acid (approximately 40% by weight)
-
Methanol (approximately 10% by weight)
Aspartic acid is primarily metabolised via transamination and enters the urea cycle or is used in energy metabolism (Hooper et al., 1994).
For an individual consuming the ADI of 40 mg/kg (0.136 mmol/kg), the resulting metabolic load includes approximately 20 mg/kg (0.068 mmol/kg) of phenylalanine and 4 mg/kg of methanol (Stegink, Filer, & Baker, 1987). Clinical trials using single doses of radiolabelled aspartame (a minor variant) at levels of 31.9 mg (0.108 mmol) to 40 mg (0.136 mmol) confirmed that over 90% of the dose is absorbed and metabolised (EFSA, 2013).
Distribution
Because aspartame is fully hydrolysed before reaching the blood, the parent dipeptide does not distribute to tissues. Instead, its metabolites follow their respective endogenous physiological pathways. Phenylalanine derived from aspartame is handled identically to dietary phenylalanine from protein sources and is incorporated into plasma proteins or converted to tyrosine in the liver. Methanol enters the body’s one-carbon metabolic pool – studies indicate it has a volume of distribution of approximately 0.77 L/kg (Graw et al., 2000).
Half-life and excretion
The biological half-life of aspartame in the GI tract is extremely short (minutes) due to high enzymatic activity. In contrast, the half-life of the radioactivity in plasma following the administration of phenylalanine-labelled aspartame is approximately 12 days (Horton et al., 1992). This extended period does not represent the parent compound but rather the half-life of the plasma proteins (such as albumin) into which the labelled phenylalanine was incorporated during protein synthesis. The excretion of aspartame’s components occurs through standard metabolic routes. Aspartic acid and phenylalanine are largely retained for protein synthesis or oxidised to carbon dioxide and excreted via the lungs. Methanol is oxidised to formaldehyde, then to formate, and is eventually eliminated as carbon dioxide or through the kidneys.
Diketopiperazine (DKP), a major degradation product, is absorbed and primarily excreted in the urine. In humans, approximately 20% to 50% of an oral DKP dose is recovered in the urine as phenylacetic acid and its conjugate, phenylacetylglutamine (EFSA, 2013). Human studies involving high-dose escalations from 600 mg/day (2.039 mmol/day) to 8,100 mg/day (27.522 mmol/day) demonstrated that phenylalanine was not detected in the urine, confirming that even at extreme intakes, the amino acid is efficiently utilised or metabolised rather than excreted intact (Stegink, Filer, & Baker, 1987).
An important limitation of urinary NSS biomarkers is the inability to measure aspartame consumption because it is rapidly broken down in the small intestine to aspartic acid, phenylalanine, and methanol, which are all naturally present in the body. However, aspartame and acesulfame K are often found blended in foods and beverages, as acesulfame K has a shorter time to maximum sweetness in taste and aspartame has a longer lasting sweetness than other sweeteners. The combination of acesulfame K and aspartame therefore mimics sucrose more closely. As reported by Ayya and Lawless, some papers call this hyperadditivity (synergism) of sweetener blends (Ayya & Lawless, 1992). The most common blend of acesulfame K and aspartame is quoted as 1:1 or 1:4, which gives the possibility to use acesulfame K intake estimates to calculate likely aspartame intakes (Ayya & Lawless, 1992; Castellanos & Sanchez, 2025).
3.3. Acesulfame K (E950)
Acesulfame K (E950) exhibits a well-defined pharmacokinetic profile characterised by rapid and near-complete absorption, lack of metabolic transformation, and efficient urinary excretion (Wilson et al., 1999). Utilising the molar mass of 202.242 g/mol, specific dosages from clinical trials have been converted to millimoles (mmol) to provide a comprehensive quantitative overview. Some relevant information in the literature regarding acesulfame K was not directly available from peer-reviewed original sources but was instead summarised in a recent EFSA report. As this included references to unpublished studies with relevant results, Castle et al. (2025) has been cited. Other recent published work on acesulfame K focusses on the appearance and kinetics in breast milk (Rother et al., 2018; Stampe et al., 2022; Sylvetsky et al., 2015).
The literature data on the ADME of acesulfame K is shown in Table 3.
Absorption
Acesulfame K is almost fully absorbed following oral ingestion, with nearly complete uptake documented at doses up to 430 mg/kg body weight in humans (Wilson et al., 1999). Absorption via the GI tract is characterised as rapid. For instance, clinical investigations utilising doses of 85 mg (0.42 mmol) delivered in aqueous solutions showed efficient uptake in both healthy volunteers and individuals with Type 2 diabetes. This high bioavailability is consistent across species, including rats at doses reaching 2,000 mg/kg (based on literature in Castle et al., 2025).
Distribution and maternal transfer
Once absorbed, the substance is distributed into the plasma and is capable of crossing the placenta to enter foetal circulation, where it has been detected in amniotic fluid and cord blood (Leth-Møller et al., 2023). It also transfers into breast milk, though infant exposure is considered low. In one study, mothers who ingested a juice drink containing 17 mg (0.084 mmol) of acesulfame K resulted in a relative infant dose of approximately 1.59% (±1.7%) of the maternal dose. Research involving an 85 mg (0.420 mmol) maternal dose reported a milk-to-plasma ratio of 0.89 based on the area under the curve (AUC). Another study reported a higher mean milk-to-plasma ratio of 1.75 (± 1.17) (Stampe et al., 2022).
Metabolism
Acesulfame K is chemically stable and is not metabolised within the body. Human trials using a 30 mg (0.148 mmol) dose of labelled 14C-acesulfame K confirmed that the substance is recovered in its intact form, with no breakdown products identified in either serum or urine (based on literature in Castle et al., 2025). The radioactivity measured in these studies directly represents the concentration of the parent compound due to this lack of metabolic degradation.
Half-life and excretion
The elimination half-life of acesulfame K in human plasma is generally reported to be between 2 and 4 hours. Clinical studies using a 30 mg (0.148 mmol) dose observed a plasma radioactivity half-life of 2 to 2.5 hours in urine (based on literature in Castle et al., 2025). In a trial involving breast-feeding mothers ingesting 17 mg (0.084 mmol), the mean plasma half-life was 3.6 hours (Sylvetsky et al., 2015). Animal studies indicate slightly longer durations, with rats showing a half-life of 4 hours in the blood and 5.6 hours in milk. Additionally, the urine excretion half-life in rats has been measured at 4 to 4.5 hours (Wilson et al., 1999). The primary route of elimination is through the urine, which accounts for approximately 99% of an oral dose within 24 hours. The substance has a relatively short plasma half-life of 2 to 4 hours (Wilson et al., 1999). Urinary excretion is dose-linear, but the time to reach maximum urine concentration (Tmax) varies by dose:
-
3 hours for a 2.2 mg (0.011 mmol) dose
-
4 hours for a 21.9 mg (0.108 mmol) dose
-
and 7 hours for doses between 41.3 mg (0.204 mmol) and 104 mg (0.514 mmol).
In certain experimental trials, the specific excretion rate within a 24-hour window was recorded at 67.7% (±11.3%).
3.4. Sucralose (E955)
Sucralose (E955) is chemically identified as 1,6-dichloro-1,6-dideoxy-β-d-fructofuranosyl-4-chloro-4-deoxy-α-d-galactopyranoside. It is produced through a three-step chemical process that selectively replaces three hydroxyl groups of sucrose with chlorine atoms. In 2026, the EFSA Panel on Food Additives and Flavourings finalised a comprehensive re-evaluation of its safety, confirming its ADI of 15 mg/kg bw/day (0.038 mmol/kg bw/day). The EFSA report details the toxicokinetic profile of sucralose, focusing on its ADME as established in human and animal models, though not all this information is based on published data (Castle et al., 2026).
The literature data on the ADME of sucralose is shown in Table 4.
Absorption
The absorption of sucralose following oral administration is consistently low and variable across species, generally not exceeding 20% (John et al., 2000a; SCF, 2000). In humans, absorption ranges from approximately 8.8% to 21.7% of the administered dose (Leth-Møller et al., 2023; Rother et al., 2018; Stampe et al., 2022; Sylvetsky, Bauman, et al., 2017; Sylvetsky et al., 2015; Sylvetsky, Walter, et al., 2017). For instance, a dose of 100 mg (0.251 mmol) in healthy volunteers resulted in urinary excretion of approximately 5.0% of the dose (Roberts et al., 2000). In a separate study, a 250 mg (0.629 mmol) dose reached peak plasma concentrations of approximately 365.6 ± 69.9 ng/mL in adults, while a 68 mg (0.171 mmol) dose in children achieved 262.3 ± 24.6 ng/mL (Sylvetsky, Bauman, et al., 2017). Animal models show species-specific variations; rats absorb roughly 10% of an oral dose, whereas dogs exhibit higher absorption at approximately 40% after a 10 mg/kg (0.025 mmol/kg) dose (Bornemann et al., 2018). Rabbits are estimated to absorb at least 20%, following a single oral dose of 10 mg/kg (0.025 mmol/kg) (John et al., 2000b).
Distribution and maternal transfer
Sucralose exhibits systemic distribution but does not significantly accumulate in tissues, with the possible exception of low-level partitioning in fat (Bornemann et al., 2018). Human data confirms that sucralose crosses the placental membrane; in a study where pregnant women received 75 mg (0.189 mmol) of sucralose in juice, cord plasma concentrations showed a positive linear dependency on maternal plasma levels (Leth-Møller et al., 2023). Sucralose is also secreted into human breast milk, with a mean milk to plasma ratio of 0.15. Infants may receive a calculated mean dose of approximately 4% of the mother’s external dose through breastfeeding (Rother et al., 2018; Stampe et al., 2022; Sylvetsky et al., 2015). While tissue accumulation is generally not observed, one rat study found concentrations between 0.5 and 7.2 μg/g in fat tissue 11 days after a dosing regimen of 80.4 mg/kg (0.202 mmol/kg) ceased (Bornemann et al., 2018).
Metabolism
The metabolism of sucralose is minimal, as the substance is primarily excreted unchanged (SCF, 2000). In most species, more than 90% of the excreted material is unchanged parent sucralose (John et al., 2000a, 2000b). Small amounts of metabolites, representing less than 10% of urinary radioactivity, have been identified as glucuronide conjugates. In humans receiving 1 mg/kg (0.0025 mmol/kg), two minor metabolites (M1 and M2) together accounted for only about 2% of the total dose (SCF, 2000). No oxidation of the molecule occurs, as evidenced by the lack of 14CO2 in expired air following the administration of labelled sucralose. Apparent acetylated metabolites found in some rat studies, such as sucralose-6-acetate, are considered likely to be impurities present in the original test item rather than metabolic products (Bornemann et al., 2018).
Half-life and excretion
Sucralose follows a biphasic elimination pattern in humans, rats, and dogs (Bornemann et al., 2018; John et al., 2000b; Mann et al., 2000; Wood et al., 2000). The first phase half-life is typically 4 to 6 hours, while the terminal second phase ranges from 12 to 24.6 hours (Leth-Møller et al., 2023; Roberts et al., 2000; Rother et al., 2018; Stampe et al., 2022; Sylvetsky, Bauman, et al., 2017; Sylvetsky et al., 2015). Rabbits are an exception, displaying a single-phase decay with a half-life of 24 hours (John et al., 2000b). Excretion occurs primarily through faeces (representing unabsorbed material) and urine (representing absorbed material). In humans, faecal excretion accounts for approximately 70% to 85% of the dose, while urinary excretion accounts for 5% to 22% (based on literature in Castle et al., 2026). Biliary excretion is a significant pathway in some species; in dogs, between 27.6% and 66.3% of an intravenous dose was recovered in faeces, indicating high biliary transport (based on literature in Castle et al., 2026).
3.5. Saccharin (E954)
Saccharin (E954) is a chemically manufactured compound, specifically 1,2-benzisothiazol-3(2H)-one-1,1-dioxide, which serves as an NSS in various food categories. Recent scientific evaluations by the EFSA Panel on Food Additives and Flavourings have re-assessed its safety, concluding that previous concerns regarding bladder tumours in male rats are not relevant to human health due to interspecies differences in urine composition. Consequently, a revised ADI of 9 mg/kg body weight per day has been established, based on high-dose animal studies where a decrease in body weight was identified as the relevant adverse endpoint (Castle et al., 2024).
The literature data on the ADME of saccharin is shown in Table 5.
Absorption
Saccharin is well absorbed following oral administration in both humans and animals (Anderson, 1979; Ball et al., 1977; Minegishi et al., 1972; Pantarotto et al., 1981; Sweatman & Renwick, 1979). Clinical data demonstrate that most, if not all, saccharin is absorbed when administered in oral doses ranging from 2.2 mg (0.012 mmol) to 69.3 mg (0.378 mmol) per person (Wilson et al., 1999). In larger oral doses of 2,000 mg (10.918 mmol) of sodium saccharin, approximately 85% is absorbed, as determined by its recovery rate in urine (Sweatman et al., 1981). In a study of healthy women given a single 10 mg (0.055 mmol) dose, the mean percentage recovered in urine was 67.5% (approximately 6.75 mg or 0.037 mmol), with 98.3% of the total excretion occurring within the first 24 hours (Zyba et al., 2021). Absorption is notably influenced by gastric pH, occurring more readily in species with lower stomach pH levels (Ball et al., 1977; Minegishi et al., 1972).
Distribution and maternal transfer
Once absorbed, saccharin salts dissociate in biological fluids into saccharin as a free imide (SCF, 1977). It is widely distributed throughout the body and can cross the blood-placenta barrier, entering the foetal circulation as evidenced by its detection in cord blood and amniotic fluid (Cohen-Addad et al., 1986; Halasa et al., 2023). Following the ingestion of 20 mg (0.109 mmol) of saccharin, the peak plasma concentration (Cmax) was recorded at 350.7 ng/mL (0.00191 mmol/L) at 30 minutes (Stampe et al., 2022). Saccharin also passes into breast milk; the same 20 mg (0.109 mmol) dose resulted in a maximum milk concentration of 81.5 ng/mL (0.000445 mmol/L) approximately 4 hours post-ingestion (Stampe et al., 2022). In humans, saccharin shows high binding to plasma proteins (approximately 75% to 90%), which influences its renal clearance rates (Colburn et al., 1981a; Sweatman et al., 1981).
Metabolism
Scientific consensus from the Scientific Committee on Food (SCF) and Joint FAO/WHO Expert Committee on Food Additives (JECFA) confirms that saccharin is not metabolised in humans or animal species, including rats, monkeys, and guinea pigs (SCF, 1977). No metabolites have been identified in the excreta of subjects, even after the daily ingestion of 1,000 mg (5.459 mmol) for 21 days (SCF, 1977). While some studies have historically reported trace amounts of hydrolysis products, these are often considered analytical artifacts or results of impurities in the radiolabelled doses rather than true biotransformation (Ball et al., 1977; Byard & Goldberg, 1973; McChesney & Golberg, 1973b). In vitro studies using liver microsomal preparations have further verified the lack of metabolic activity (Ball et al., 1977; Byard & Goldberg, 1973).
Half-life and excretion
Saccharin is rapidly eliminated from the body, primarily via the kidneys through both glomerular filtration and active tubular secretion (Sweatman et al., 1981). The terminal half-life following an intravenous bolus of 10 mg/kg body weight, equivalent to 700 mg (3.821 mmol) for a 70 kg adult, is approximately 70 minutes (Sweatman et al., 1981). Following oral administration, the half-life is estimated at approximately 4 to 7.5 hours (Colburn et al., 1981a; Wilson et al., 1999). Urinary excretion is the principal route, with 80% to 100% of an absorbed dose recovered unchanged in the urine within 24 to 48 hours (Kennedy et al., 1972; Sweatman et al., 1981). Faecal excretion remains a minor route in humans, accounting for only 1% to 8% of the administered dose (Ball et al., 1977; Lethco & Wallace, 1975; Sweatman & Renwick, 1979).
3.6. Sodium (Na) cyclamate (E952)
Sodium (Na) cyclamate (CAS RN 139-05-9), also known as cyclohexylsulfamic acid, monosodium salt, is an NSS.
The literature data on the ADME of Na cyclamate is shown in Table 6.
Absorption
The absorption of Na cyclamate from the GI tract varies across species. In humans, approximately one-third (1.84 mmol/g ingested) of an oral dose is absorbed, while two-thirds (3.13 mmol/g ingested) remains unabsorbed (Bopp et al., 1986; Renwick et al., 2004). Peak plasma levels typically occur between 6 and 8 hours post-ingestion (Bopp et al., 1986). In clinical trials where human participants received a single oral dose of 2,000 mg (9.94 mmol), the substance was rapidly absorbed (Asahina et al., 1971). Animal models show absorption rates of 33% to 40% in rats and dogs (Bopp et al., 1986). Specific excretion profiles were noted in rats, following a 30 mg (0.149 mmol) dose, and in rabbits, following a 600 mg (2.982 mmol) dose (Kojima et al., 1966a).
Distribution and maternal transfer
Once absorbed, Na cyclamate distributes widely through body tissues, with the highest concentrations typically found in the kidneys and the lowest in the brain (Bopp et al., 1986). The substance can cross the placental barrier, entering the foetuses of rats, monkeys, and humans (Pitkin, Reynolds, et al., 1971). Sodium cyclamate has also been detected in the breast milk of humans, rats, dogs, and pigs (Bopp et al., 1986). Studies in lactating women indicate that the sweetener is rapidly absorbed and transferred from plasma into breast milk (Stampe et al., 2022).
Metabolism
Sodium cyclamate can dissociate in the GI tract into the cyclamate anion (the cyclamate moiety) (Bopp et al., 1986). The primary metabolic pathway involves the microbial biotransformation of unabsorbed cyclamate in the gut by the bacterial enzyme sulfamatase, which hydrolyses it into cyclohexylamine (CHA) (Collings, 1989). Conversion rates vary significantly; approximately 10% to 30% of humans are ‘converters’ who can transform 0.1% to 8% of a dose, though a minority can convert up to 60% (Renwick et al., 2004). It is estimated that up to 19% of an ingested dose of Na cyclamate may be converted to CHA in humans (Wills et al., 1981). CHA is further metabolised in the kidneys – by deamination in humans and hydroxylation in rats – into minor products like cyclohexanone and cyclohexanol (Renwick et al., 2004).
Half-life and excretion
The plasma half-life of Na cyclamate in humans is 8 hours (Bopp et al., 1986). This is comparable to the half-lives observed in animal models, specifically 6.6 hours in rats and 8.8 hours in dogs. The primary metabolite, CHA, has a shorter half-life ranging from 3 to 5 hours in humans, rats, and dogs (Renwick & Williams, 1972). Absorbed Na cyclamate is primarily excreted unchanged in the urine (Bopp et al., 1986; Wills et al., 1981). Biliary excretion is minimal, accounting for less than 1% of the dose in rats and dogs (Roberts & Renwick, 1985). In a study where humans were given 2,000 mg (9.94 mmol), 53.1% (1,062 mg or 5.28 mmol) was recovered in the urine over 120 hours (Asahina et al., 1971). In another study involving men ingesting between 5,000 mg and 16,000 mg (24.85 mmol to 79.51 mmol) daily for 7 months, there was wide interindividual variation in the urinary excretion of the CHA metabolite, with a mean recovery of 17.2% (Wills et al., 1981). Faecal excretion consisted of the unabsorbed parent compound and products of microbial conversion (Miller et al., 1966).
3.7. Steviol glycosides (E960)
Steviol glycosides (E960) are a group of high-intensity, non-caloric sweeteners extracted from the leaves of the Stevia rebaudiana Bertoni plant (Wheeler et al., 2008). The most abundant glycosides responsible for this sweetness are stevioside and rebaudioside A, which are diterpenoid compounds that share a common aglycone backbone known as steviol (EFSA, 2010; Younes et al., 2018). Due to the increasing use of these compounds as sugar substitutes, extensive pharmacokinetic research has been conducted to understand their biological fate in mammals. These studies are critical for establishing safety parameters, such as the ADI, which is currently set at 4 mg/kg body weight/day when expressed as steviol equivalents (Younes et al., 2022).
The literature data on the ADME of steviol glycosides is shown in Table 7.
Absorption
Intact steviol glycosides are not absorbed or hydrolysed in the upper GI tract, resisting digestion by human salivary, gastric, and pancreatic enzymes (Koyama et al., 2003; Wheeler et al., 2008). Upon reaching the colon, they are hydrolysed by intestinal microflora, particularly Bacteroides species, which strip the glucose moieties to form the aglycone steviol (Wheeler et al., 2008; Kojima et al., 2003). While parent glycosides like rebaudioside A have very low permeability (0.11 × 10⁻⁶ cm/s), the resulting steviol is readily absorbed into the portal blood, with a permeability coefficient 200 to 300 times higher (38.6 × 10⁻⁶ cm/s) (Geuns et al., 2003). In rats, a peak portal plasma concentration of steviol occurs rapidly, within 15 minutes of an oral dose of 45 mg (0.141 mmol) per kg. In contrast, when administered as a stevia mixture at 125 mg (0.155 mmol) per kg, plasma steviol peaks steadily only after 8 hours, reflecting the time required for colonic microbial degradation (Koyama et al., 2003). Glucosylated steviol glycosides (GSGs) follow the same path, being enzymatically converted first into parent glycosides and then into steviol (Cardoso et al., 1996).
Distribution
Once absorbed, steviol enters the bloodstream and demonstrates a fast biological distribution throughout the body. In rat studies, the highest concentrations of radioactivity following intravenous injection of labelled stevioside were observed in the liver and the small intestine. There is no evidence of accumulation in the tissues (Cardoso et al., 1996).
Metabolism
The metabolism of all steviol glycosides follows a uniform pathway: colonic hydrolysis to steviol, followed by hepatic conjugation with glucuronic acid (Wheeler et al., 2008). In humans, steviol glucuronide is the primary metabolite circulating in the plasma. In studies where subjects received 750 mg (0.932 mmol) of stevioside per day, no free steviol or stevioside was detectable in the blood, as the compound is efficiently converted to its glucuronide form (Geuns et al., 2007). Glucosylated steviol glycosides (GSG), which contain 1 to 20 additional glucose units, follow the same metabolic fate, undergoing enzymatic bioconversion into parent glycosides and then into steviol (Younes et al., 2022).
Half-life and excretion
The elimination half-life of steviol glucuronide in humans is approximately 14 hours following single oral doses of rebaudioside A or stevioside (Wheeler et al., 2008). In rats, the biological half-life for radiolabelled stevioside is reported as 24 hours (Koyama et al., 2003). There are significant inter-species differences in the primary route of excretion. In humans, steviol glucuronide is excreted primarily via the urine, accounting for 59% to 62% of the administered dose (EFSA, 2010; Wheeler et al., 2008). For healthy subjects consuming 750 mg (0.932 mmol) of stevioside, the mean recovery of steviol glucuronide in a 24-hour urine collection was approximately 101.8 mg (0.206 mmol of steviol equivalents) (Geuns et al., 2007). Small amounts of free steviol, averaging 23 mg (0.072 mmol), are excreted in the faeces (Geuns et al., 2007).
In contrast, rats excrete steviol glucuronide primarily via the bile into the faeces (Cardoso et al., 1996). Biliary excretion in rats can account for 40.9% to 52% of the original dose (Cardoso et al., 1996). Both species exhibit enterohepatic circulation, where steviol glucuronide is deconjugated in the lower intestine and reabsorbed as steviol (Koyama et al., 2003).
3.8. Erythritol (E968)
Erythritol (E968) is a four-carbon sugar alcohol (polyol), specifically the meso diastereomer of butane-1,2,3,4-tetrol, with a molar mass of 122.120 g/mol. It is industrially produced through the fermentation of carbohydrate sources by non-genetically modified fungi, specifically Moniliella pollinis or Moniliella megachiliensis. Characterised as white, odourless, heat-stable crystals, it provides approximately 60% to 80% of the sweetening power of sucrose (Bordier et al., 2022). In addition to its exogenous intake as a food additive, erythritol is endogenously synthesised in humans via the pentose phosphate pathway (PPP) (Hootman et al., 2017). Current safety evaluations have established a numerical ADI of 500 mg (4.094 mmol) per kg of body weight per day to protect against potential dose-related laxative effects (Younes et al., 2023).
The literature data on the ADME of erythritol is shown in Table 8.
Absorption
Erythritol is readily and dose-dependently absorbed from the small intestine in humans, with research indicating that between 60% and 90% of an ingested dose enters systemic circulation (Bordier et al., 2022). For a single 1,000 mg (8.189 mmol) oral dose, this absorption corresponds to approximately 600 to 900 mg (4.913 to 7.370 mmol) (van Wijck et al., 2011). Clinical pharmacokinetic studies show that peak plasma concentrations increase with intake; for instance, a 10,000 mg (81.887 mmol) dose reaches a peak concentration of 1.81 mmol/L (221.037 mg/L), while a 50,000 mg (409.433 mmol) dose reaches approximately 5.40 mmol/L (659.448 mg/L) (Bordier et al., 2022).
Distribution
Following absorption, erythritol is distributed rapidly throughout the body. A 1,000 mg (8.189 mmol) bolus yields peak plasma levels of 0.24 mmol/L (29.309 mg/L) within 2 hours (van Wijck et al., 2011). At higher intakes, such as a 30,000 mg (245.660 mmol) dose, plasma levels can peak at approximately 5 mmol/L (610.600 mg/L) within 30 minutes (Witkowski et al., 2023). These elevated circulating levels can persist for over 48 hours compared to baseline endogenous concentrations (Witkowski et al., 2023).
Metabolism
Dietary erythritol undergoes negligible metabolism by human gut microbiota (Arrigoni et al., 2005). Although it is produced endogenously, only a small portion – typically less than 1% – of an ingested dose is oxidised to erythrose and subsequently to erythronate (Hootman et al., 2017). For a 25,000 mg (204.717 mmol) ingestion, the amount metabolised to erythronate would be less than 250 mg (2.047 mmol) (Bordier et al., 2022).
Half-life and excretion
The elimination half-life of erythritol is approximately 4 hours in both humans (Bordier et al., 2022; Hootman et al., 2017) and rats (Noda & Oku, 1992). It is primarily excreted unchanged in the urine via the kidneys, with approximately 78% to 92% of a dose recovered within 24 hours (Bordier et al., 2022; Hootman et al., 2017). For example, following a 1,000 mg (8.189 mmol) dose, roughly 3.4 mmol (415.208 mg) is excreted within the first 5 hours (van Wijck et al., 2011). Animal data support these findings, showing at least 90% urinary elimination and less than 1% (for example, less than 0.082 mmol for an 8.189 mmol dose) in faeces (Noda & Oku, 1992; Ortiz & Field, 2021; Van Ommen et al., 1996).
3.9. Sorbitol (E420)
Sorbitol (C6H14O6) (E420), also known as D-glucitol, is a monosaccharide alcohol with a molar mass of 182.17 g/mol. Sorbitol is a sugar alcohol and is rapidly converted into fructose by the enzyme sorbitol dehydrogenase in the liver, its systemic safety profile is intrinsically linked to that of fructose.
The literature data on the ADME of sorbitol is shown in Table 9.
Absorption
Sorbitol is characterised by incomplete and slow absorption from the GI tract, particularly when compared to fructose. Its intestinal absorptive capacity is limited, estimated to be between 2,000 mg (10.98 mmol) and 10,000 mg (54.89 mmol). Absorption is both dose- and concentration-dependent, and when administered together with fructose, the two substances may compete for absorption. Animal studies (rats) using a stomach tube dose of 300 mg (1.65 mmol) of sorbitol showed varying absorption rates, with values reported at 75%, 66%, and 84% within a 3-hour window. In humans, oral doses exceeding the absorptive capacity can lead to fructose malabsorption symptoms due to the osmotic load (García-Arieta, 2014).
Distribution
Following absorption or parenteral administration, sorbitol is transported to the liver via the bloodstream. While specific systemic distribution volumes are not detailed in the sources, the liver and seminal vesicles are identified as the primary organs that frequently utilise and process sorbitol (Ali et al., 1998).
Metabolism
Sorbitol is rapidly converted into fructose in the liver by the enzyme sorbitol dehydrogenase. This metabolic pathway uses nicotinamide adenine dinucleotide (NAD+) as a cofactor and a zinc ion for catalysis, following the reaction: sorbitol+NAD+ → fructose+NADH+H+. This process provides an ATP-independent method for the body to produce fructose from glucose (García-Arieta, 2014). Once converted, the resulting fructose is phosphorylated by fructokinase into fructose 1-phosphate, which is then cleaved by aldolase B (Ali et al., 1998). In individuals with Hereditary Fructose Intolerance (HFI), the deficiency of aldolase B leads to the toxic accumulation of fructose 1-phosphate (García-Arieta, 2014).
Half-life and excretion
The sources cited describe the conversion of sorbitol to fructose as ‘rapid’, though a specific numerical elimination half-life for humans is not explicitly provided in the texts (Beaugerie et al., 1990). The kinetics of sorbitol are noted to be dose-dependent (Adcock & Gray, 1957).
Sorbitol excretion occurs through both renal and biliary pathways, though the amount lost in urine is typically minimal. In a human study using a 35,000 mg (192.13 mmol) dose, urinary excretion varied between 70 mg (0.38 mmol) and 910 mg (5.00 mmol), representing less than 3% of the total dose (Adcock & Gray, 1957). Using 14C-labelled sorbitol at the same dose, approximately 1.5% of the radioactivity was recovered in the urine within 24 hours, while 13.1% was recovered in the faeces within 60 hours (Adcock & Gray, 1957). Another study involving an oral dose of 30,000 mg (164.68 mmol) reported faecal excretion of approximately 30 mg (0.16 mmol) per 24 hours (Beaugerie et al., 1990).
3.10. Xylitol (E967)
Xylitol (E967) is a five-carbon sugar alcohol (pentitol) frequently utilised as a NSS due to its unique metabolic properties and reduced caloric content.
The literature data on the ADME of xylitol is shown in Table 10.
Absorption
The intestinal absorption of xylitol varies significantly based on the study design and administration method. In a 1973 experimental study involving five healthy males, xylitol was administered as part of a test meal in doses of 5,000 mg (32.86 mmol), 10,000 mg (65.73 mmol), 15,000 mg (98.59 mmol), and 30,000 mg (197.18 mmol). Analysis of intestinal fluid 3 to 4 hours post-ingestion showed high absorption rates ranging from 83% to 92%; specifically, the 32.86 mmol dose resulted in 85% absorption, while the 98.59 mmol dose reached a peak of 92% absorption (Asano et al., 1973). Conversely, a later study (Bordier et al., 2022) using aqueous solutions delivered via an intragastric tube at doses of 7,000 mg (46.01 mmol), 17,000 mg (111.73 mmol), and 35,000 mg (230.04 mmol) reported ‘very low’ and nonlinear absorption. In this study, the maximum plasma concentration (Cmax) for the 46.01 mmol dose was approximately 0 uM, highlighting discrepancies in absorption efficiency across different experimental models.
Distribution
Following absorption from the GI tract, xylitol enters the bloodstream. However, the provided clinical data does not specify the precise volume of distribution or detailed concentration levels across various human biomatrices. In the case of intragastric administration, researchers noted that the study did not show exact data on concentration levels, though plasma was used as the primary biomatrix for monitoring.
Metabolism
Xylitol metabolism involves both the breaking down of products and potential endogenous synthesis, though specific metabolic pathways and intermediate products were not detailed in the available sources. The liver is identified as a site for the first-pass effect and primary metabolism during GI absorption. While the analytical methods used in these studies (such as GLC/enzymatic assays and GC-MS) were designed to detect xylitol and its metabolites, the sources do not provide specific rates for its metabolic conversion.
Half-life and excretion
Comprehensive data regarding the elimination half-life, excretion rate, and terminal half-life of xylitol in humans is rarely reported. In rats, the half-life is 7 to 8 hours (FAO/WHO, 1977). Study protocols (Bordier et al., 2022) that aimed to monitor the biomatrix (plasma) over a 3-hour window to assess these parameters, reported as unavailable or not shown for excretion half-life and the amount excreted within 24 hours. An excretion of 1% to 3% in urine is recorded after oral administration and of 10% after intravenous infusion of xylitol. In faeces, 1% of xylitol was excreted (FAO/WHO, 1977).
3.11. Mannitol (E421)
Mannitol (E421) is a six-carbon sugar alcohol with a molar mass of 182.17 g/mol that serves vital roles in clinical medicine as an osmotic agent for reducing intracranial hypertension and as a non-invasive biomarker for assessing intestinal permeability (Cloyd et al., 1986).
The literature data on the ADME of mannitol is shown in Table 11.
Absorption
Mannitol is absorbed from the GI tract, specifically within the small intestine, through passive diffusion (Grover et al., 2016). In healthy adult subjects administered a single oral dose of 100 mg (0.549 mmol) of 13C-labelled mannitol, the substance was readily detected in the urine, confirming successful absorption (Grover et al., 2016). While a specific bioavailability percentage is not explicitly provided for the oral route, the cumulative recovery in urine serves as a proxy for intestinal uptake. In paediatric studies involving children under five years of age given an oral dose of 100 mg/kg (0.549 mmol/kg), healthy subjects and those with diarrhoea showed similar excretion levels of 2.7% and 2.6% of the administered dose, respectively, within a 5-hour window (Barboza Junior et al., 1999; Grover et al., 2016)
Distribution
Following absorption or IV administration, mannitol enters the bloodstream and distributes primarily into the extracellular fluid (Cloyd et al., 1986; Grover et al., 2016). Following IV infusions of 0.5 g/kg (2.745 mmol/kg) or 0.7 g/kg (3.842 mmol/kg), mannitol concentrations decline in a biphasic pattern, starting with a rapid distribution phase (Cloyd et al., 1986). In humans, the mean steady-state volume of distribution (Vss) is 0.47 ± 0.50 L/kg. At standard clinical doses, the distribution volume correlates well with plasma and extracellular water compartments, which represent approximately 4.5% and 20% of body weight, respectively (Cloyd et al., 1986). However, high doses such as 1.5 g/kg (8.234 mmol/kg) can cause a significant osmotic shift of water from the intracellular to the extracellular space, effectively expanding the distribution volume (Barboza Junior et al., 1999).
Metabolism
Mannitol is generally considered to be poorly metabolised by human tissues and appears unmetabolised in urine (Grover et al., 2016). However, it is susceptible to degradation by colonic microbiota (Grover et al., 2016). Research indicates that up to 75% of mannitol may be utilised when incubated with certain faecal bacteria, suggesting that orally administered mannitol reaching the colon is significantly degraded before excretion (Grover et al., 2016). Conversely, some wild-type bacteria, such as Lactobacillus reuteri, can produce mannitol endogenously. No specific human metabolic breakdown products or data regarding a first-pass effect in the liver are detailed in the provided clinical sources (Barboza Junior et al., 1999).
Half-life and excretion
The disposition of mannitol is best described using a two-compartment open model (Cloyd et al., 1986). In human subjects with normal renal function, the pharmacokinetic half-lives are as follows:
-
Distribution half-life: 2.11 ± 2.67 minutes (Cloyd et al., 1986)
-
Elimination half-life: 71.15 ± 27.02 minutes. Studies in dogs showed a similar elimination half-life, ranging from approximately 66 to 80 minutes depending on the administered dose (Cloyd et al., 1986)
Renal excretion is the primary route of elimination for mannitol (Cloyd et al., 1986). The total body clearance in humans is reported at 7.15 ± 10.23 ml/min/kg. In experimental settings using a 100 mg (0.549 mmol) oral dose of 13C mannitol, the mean cumulative urinary excretion was recorded over 24 hours (Grover et al., 2016):
-
0 to 2 hours: 13.65 mg (0.0749 mmol)
-
2 to 8 hours: 12.95 mg (0.0711 mmol)
-
8 to 24 hours: 4.38 mg (0.0240 mmol)
-
Total 24-hour recovery: 31.21 mg (0.1713 mmol).
The sources note that regular mannitol often shows higher baseline urinary levels due to inadvertent dietary contamination, whereas 13C mannitol provides a more accurate measure of the test dose’s excretion (Grover et al., 2016).
4. Results
4.1. Samples
Spot urine samples from Year 15 (2022 to 2023) of the NDNS were available for 740 individuals (adults and children from 4 years) who had consented for their samples to be used in further research (Venables et al., 2022). Table 12 shows the number of samples per NDNS age group by sex, as well as their height, weight and BMI. Urinary creatinine concentrations and estimated 24-hour urinary creatinine clearance are also reported in Table 12. It should be noted that BMI for adults and children was calculated as kg/m2, and reported BMI for children did not account for age and gender. Therefore, the analysis of NSS per BMI for children should not be interpreted as an exposure relative to healthy weight.
The NDNS Year 15 samples were collected from participants living in the four UK nations (England, Scotland, Wales, and Northern Ireland) and included different ethnicities and social economic groups. Northern Ireland (NI) represents a higher relative proportion of urine samples than other countries owing to the NI sample ‘boost’ under NDNS. Table 13 describes the distribution by self-reported ethnicity and Government Office Regions (determined from participant address post-code) for age and sex groups.
4.2. NSS detection and concentrations
All 740 samples were analysed successfully for Na cyclamate, saccharin, sucralose, acesulfame K, erythritol, xylitol/arabinitol, and mannitol/sorbitol. However, a substantial proportion of the analytical results, particularly for the artificial sweeteners, were found to be below the LOD and/or the LOQ. To enable statistical analysis, these results were replaced with imputed values.
As a result, any percentile below the LOD is reported as 0, while percentiles between the LOD and LOQ are represented by imputed values within that range, generated by multiplying the relevant limit by a randomly selected value between 0 and 1. Mean concentrations are also based on imputed values and may therefore underestimate the true concentration.
Comparisons involving statistics affected by imputation can be used to identify potential differences between groups, however, they cannot be used to accurately quantify the magnitude of those differences. The findings are presented in Table 14.
The results in Table 14 show that some of the NSS were not commonly detected in urine, especially Na cyclamate (detected in 5.6% of samples). The highest percentage of urine samples with detectable amounts of Na cyclamate was in the 11 to 18 years group, where it was detectable in 6.8% of participant spot urine samples. Saccharin was present in 70.8% of the samples and highest detection rates of saccharin for the 4 to 10-year-olds (73.4%) and the over 65-year-olds (74.5%). A similar percentage was found for acesulfame K, which was found in 66.1 % of all the samples, but most often in the 11 to 18 years old (83.5%). Sucralose was detected in almost half of all the samples (49.1%), and more often in children (70.2 % of the 4 to 10 years old and 74.8% of the 11 to 18 years old).
Except for Na cyclamate, all NSS had significant differences in their relative concentrations between the NDNS age groups. For most NSS, the relative concentration was higher in children. For saccharin, erythritol, and xylitol/arabinitol the relative concentrations were highest for young children (4 to 10 years old) and older adults (over 65 years old). Older children and teenagers had the highest relative concentrations for sucralose and acesulfame K.
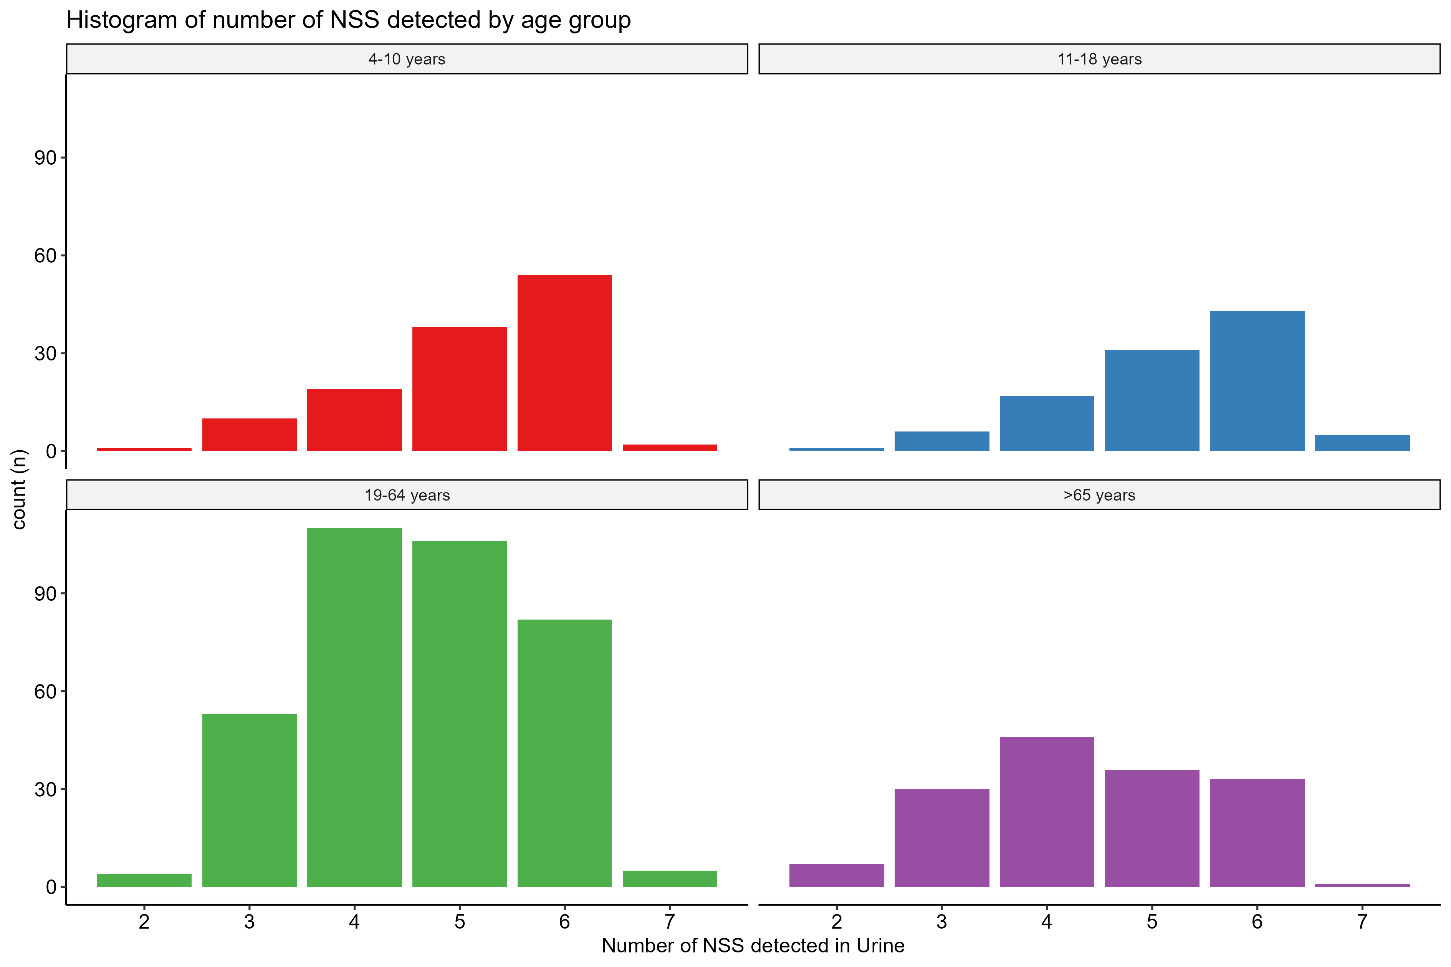
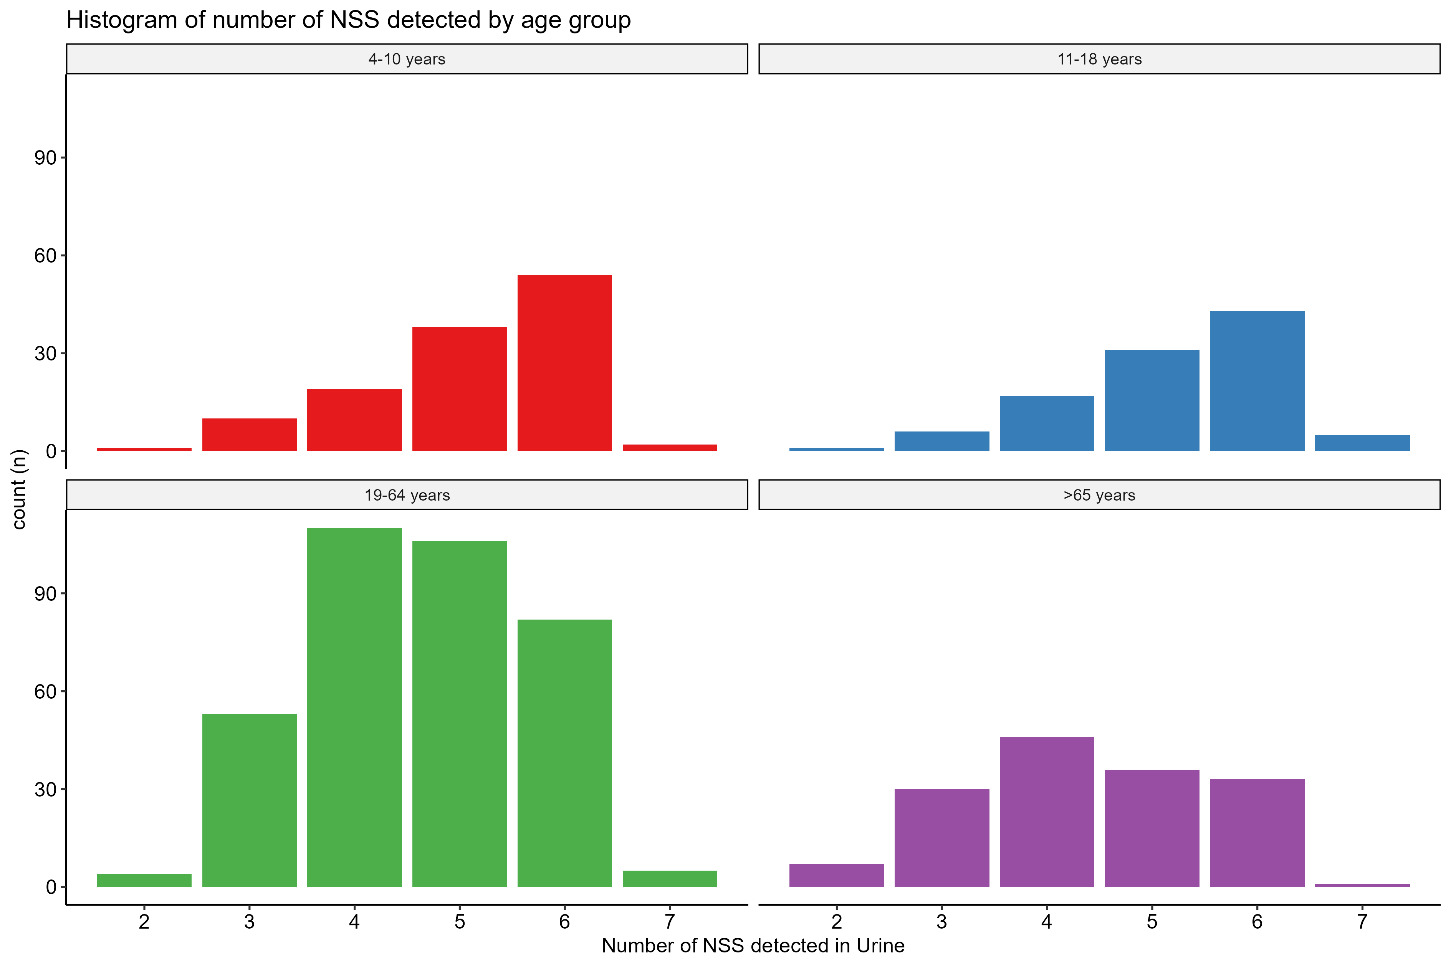
Although some NSS (for example Na cyclamate) were rarely detected, all samples had detectable presence of 2 or more NSS, see Table 15 and Figure 3. Erythritol and xylitol/arabinitol gave quantifiable concentration in almost all samples, which may be caused by their natural occurrence, independent of NSS exposure. Only 13 (1.8%) individuals did not have any further NSS present in their urine. Almost 85% of the samples had 4 or more NSS in detectable concentrations. The individuals with the highest number of NSS detected were younger (average age 30.4 years for 7 detected NSS, and 32.5 years for 6 detected NSS), while the individuals with only 2 or 3 NSS detected had an average age of 48 years. There were no other strong relationships with the number of NSS detected in urine. There was however a strong inverse correlation between the creatinine concentration and the number of NSS detected in the urine, suggesting that in urine samples with a higher water content it is more difficult to detect NSS because of their lower concentration.
The data on detection of NSS was further analysed and shown by sex and age group, providing the mean, median, 2.5th, 25th, 75th and 97.5th percentiles. This emphasises the wide range of concentrations that were found. These data are described in Table 16 and Table 17.
This wide range of values observed for all NSS makes it difficult to identify clear differences between age groups. This variability is particularly evident for acesulfame K, where the median urinary concentration was 0.9 µM/mM creatinine, while the highest 2.5% of samples exceeded 104 µM/mM creatinine. A similar pattern was observed for saccharin, with a median concentration of 0.2 µM/mM creatinine and the highest 2.5% of samples exceeding 23.5 µM/mM creatinine. This substantial variation in urinary concentrations may obscure underlying differences between age groups.
4.3. Daily urinary NSS excretion
Based on the literature survey, there are limitations in the use of a single spot urine sample per individual to estimate daily urinary NSS excretion, particularly for NSS with very short half-lives, or for those not excreted in urine. However, the estimated 24-hour excretion is based on the 24-hour creatinine clearance, calculated from age, sex and body composition (Johner et al., 2015). The estimated 24-hour urinary excretion is therefore better for comparisons between men versus women, young versus old, and higher versus lower body weights (see section 2.4 Data processing). The estimated 24-hour NSS excretion is still based on the assumption that the spot urine sample is representative for a 24-hour period, which is a significant assumption with high uncertainty. Table 18 and Table 19 report the estimated mean of the NSS concentration relative to creatinine and the estimated daily urinary NSS excretion. For each NSS there can be many samples with non-detected concentrations, it is relevant to use the medians to compare between groups, to account for the left skew in the data distribution.
The results of the estimated daily urinary NSS excretion show that children have higher estimated daily urinary NSS excretions, for sucralose and acesulfame K, when compared to other groups. For the sugar alcohols, the highest estimated daily excretion was in adults (19 to 64 years). Except for Na cyclamate, which was only detected in a small number of samples, there are statistically different estimated daily excretions for all NSS by age group and sex.
4.4. Estimated maximum and minimum daily intake and time to clear
Due to the high level of uncertainty arising from the use of spot urine samples described in section 4.3, estimation of daily intakes was not performed for all samples. Instead, an estimate of maximum and minimum (detectable) daily intake for each NSS, based on the estimated 24-hour excretion, was made.
These estimates were made to demonstrate an approach to estimating intakes from excretion of biomarkers; noting the uncertainties described for spot urine samples, these results should not be interpreted as reliable estimates of exposure.
It was assumed that the estimated 24-hour excretion of each NSS correlates to the intake and that the NSS bioavailability is independent of the types of food (for which there is no clear evidence either way). The estimated daily intake has been calculated using the basic formula:
\[Daily\ intake (mg/kg\ bw) = \frac{(UNSS24 * molecular\ weight)}{(\% \ excretion * body\ weight)}\]
The daily intake is expressed in mg per kg body weight and calculated using UNSS24, which is the estimated daily urinary NSS excretion, molecular weight of the NSS, % excretion, which is the percentage of the NSS consumed that is excreted in the urine based on the literature review (see section 3), and body weight, the recorded weight of the individual. For each NSS, the maximum and minimum estimated intakes were calculated based on the estimated 24-hour excretion.
By using the highest measured relative urinary concentration and the relative urinary concentration based on the LOQ, it is possible to give an estimate of the time it takes after maximum consumption to still detect a NSS in the urine. This was calculated using simple first order kinetics, with the following formula:
\[t = (ln(RUNSS_{max}/RUNSS_{min}))/k \]
where t = time in hours, RUNSSmax = maximum relative urinary concentration (in μmol per mmol creatinine), RUNSSmin = minimum relative urinary concentration (in μmol per mmol creatinine, based on the LOQ), and k = the elimination rate constant (0.693/t½), with t½ the half-life in hours. We can use the LOD of the NSS to estimate the minimum relative urinary concentration.
For the estimated 24-hour excretion of acesulfame K expressed as mg/kg body weight, using the values for absorption in Table 3 (Wilson et al., 1999), the highest value found was 9.6 mg/kg body weight. As 99% of acesulfame K is excreted into the urine this corresponds to a possible 9 to 10 mg/kg body weight daily intake. The lowest estimated intake was 0.15 µg/kg body weight. The maximum relative urinary concentration of acesulfame K was 0.28 μmol per mmol creatinine with a minimal detectable relative concentration of 5.91 *10-5 µmol per mmol creatinine, which would take between 24 and 55 hours (based on the half-life of between 2 and 4.5 hours) (Castle et al., 2025; Wilson et al., 1999).
Based on the literature, it is estimated that 85% of consumed saccharin is absorbed and 99% excreted into urine (Ball et al., 1977; Pantarotto et al., 1981; Stampe et al., 2022). Based on the estimated 24-hour excretion, the highest estimated intake was 10.2 mg/kg body weight per day, and the lowest estimated intake was 0.001 mg/kg body weight per day. The maximum relative urinary concentration of saccharin was 0.30 µmol per mmol creatinine, with a minimal detectable relative concentration 7.65 *10-5 µmol per mmol creatinine, which would take between 34 and 64 hours (based on the half-life of between 4 and 7.5 hours) (Ball et al., 1977; Colburn et al., 1981b; Pantarotto et al., 1981).
Only 10% to 14% of the consumed sucralose is taken up and excreted in urine (Ball et al., 1977; Pantarotto et al., 1981). Based on the estimated 24-hour excretion, the highest intake per kg bodyweight was for an 11-year-old girl with an estimated daily intake of 4.7 mg/kg body weight, the lowest is 0.007 mg/kg body weight. The maximum relative urinary concentration of sucralose was 0.0096 µmol per mmol creatinine, with a minimal detectable relative concentration 2.35*10-5 µmol per mmol creatinine, which would take between 21 and 32 hours (based on the half-life of between 4 and 6 hours) (Baird et al., 2000; Roberts et al., 2000).
It is assumed that 53% of the ingested Na cyclamate will appear in the urine (Bopp et al., 1986; Renwick et al., 2004). Based on this, the highest estimated daily intake per kg body weight was 8.2 mg/kg body weight per 24 hours), the lowest was 0.018 mg/kg body weight. The maximum relative urinary concentration of Na cyclamate was 0.13 µmol per mmol creatinine, with a minimal detectable relative concentration 1.69 *10-3 µmol per mmol creatinine, which would take around 50 hours (based on the half-life of 8 hours) (Bopp et al., 1986; Renwick et al., 2004).
Different studies found that 78% to 90% of the consumed erythritol will be excreted into urine (Bordier et al., 2022; Bornet et al., 1996b). Based on this, the highest estimated daily intake per kg body weight was 171 mg/kg body weight per 24 hours. The lowest was 0.53 mg/kg body weight. The maximum relative urinary concentration of erythritol was 6.03 µmol per mmol creatinine with a minimal detectable relative concentration 0.0067 µmol per mmol creatinine, which would take around 39 hours (based on the half-life of 4 hours) (Bordier et al., 2022; Bornet et al., 1996b).
It is not possible to distinguish between mannitol or sorbitol. The percentage of both mannitol and sorbitol that will be secreted into urine is typically around 2% for mannitol (Adcock & Gray, 1957; Beaugerie et al., 1990) and 30% for sorbitol (Grover et al., 2016), but this is based on few human studies. It was concluded that it was not appropriate to calculate an estimated daily intake, with estimates of >80 mg/kg body weight per 24 hours.
Similarly for xylitol and arabinitol, it has been reported that only around 2% of the xylitol is excreted and all people have endogenous arabinitol that appears in the urine (Engelke et al., 2010). It was concluded that it was not appropriate to calculate an estimated daily intake.
4.5. Aspartame
A limitation of urinary NSS biomarkers is the inability to measure aspartame consumption because it is rapidly broken down in the small intestine to aspartic acid, phenylalanine, and methanol which are all naturally present in the body. This is discussed in detail in section 3.2 of the literature review. However, aspartame and acesulfame K are commonly blended in foods and beverages using ratios of 1:1 or 1:4. This makes it possible to use the acesulfame K intake estimates to calculate likely aspartame intakes (Ayya & Lawless, 1992; Castellanos & Sanchez, 2025).
Acesulfame K was found in 66% of the urine samples analysed in this project. Based on the highest estimated 24-hour excretion of acesulfame K, the highest daily intake was calculated as 10 mg/kg body weight as a possible maximum daily intake. This suggests that the maximum intake of aspartame could be between 10 and 40 mg/kg body weight, based on the samples analysed in this project.
4.6. Associations with estimated daily urinary excretion of NSS
The results in Tables 18 and 19 show that the estimated daily urinary excretion values differ for the age groups. It was further investigated whether sex, age, BMI, income, and self-reported ethnicity and Government Office regions were associated with the estimated daily urinary excretion. This was performed using generalised linear models including these factors. In the following section, tables are presented for each individual NSS and their associations with sex, age, BMI, income, and self-reported ethnicity and Government Office regions. The tables present the regression coefficient (β) for each factor, which shows the estimate of that factor contributing the NSS secretion. If the β is positive it means that the estimated daily urinary excretion increases with this factor. For instance, for many NSS there is a negative association with age, suggesting that the estimated daily urinary excretion is highest in younger people and decreases with age. If the β for females is positive, it is expected that women have a higher estimated daily urinary excretion than men. When the 95% confidence interval (CI) crosses 0, there is no reason to expect that there is an association. For group (non-continuous) factors, such as sex, the β is the difference between the reference variable (the first category) and the other categories within the factor.
As this is an observational study, these associations do not give any information on causality and are also subject to uncertainties arising from the use of spot urine samples and relatively small sample size(s). The strength and magnitude of the observed associations are also likely to be influenced by the imputation of concentrations below the LOQ. Consequently, the models can be used to identify the presence and direction of strong associations, but some estimates may be imprecise due to the high proportion of imputed values. As a result, the models should be interpreted with caution, as predictive performance and the accuracy of estimated effect sizes may be reduced.
Table 21 shows that estimated daily urinary Na cyclamate excretion is inversely associated with equivalised income. Meaning that people with a higher income have lower daily urinary Na cyclamate excretion. No other factor was significantly associated with daily urinary Na cyclamate excretion. None of the factors are associated with the estimated daily urinary saccharin excretion.
Males have higher estimated daily urinary sucralose excretion, and age is inversely associated with estimated daily urinary sucralose excretion, BMI is also associated with estimated daily urinary sucralose excretion, but positively. The participants in the North West of England had higher estimated daily urinary sucralose excretion, although it is difficult to interpret this specific link to region, Table 22 shows that the North West of England also had higher estimated daily excretion of erythritol.
There is an inverse association between age and estimated daily urinary acesulfame K excretion, while there is positive association with BMI, similar to sucralose. There is a trend for sex, with males having higher estimated daily urinary acesulfame K excretion and with equivalised income, but the 95% confidence intervals just cross zero.
Table 22 shows that the estimated daily urinary erythritol excretion is associated with BMI and higher levels in the North West of England (as discussed above). There is an association with sex, with higher estimated daily urinary xylitol/arabinitol excretion in males. There was also a higher estimated daily urinary xylitol/arabinitol excretion in people who self-reported as ‘other ethnicity’ compared to those self-reported as ‘white’. There is an association between equivalised income and estimated daily urinary mannitol/sorbitol excretion, different to other NSS is this not an inverse association. There is also a trend with age, again in contrast to other NSS it is not inversely associated with age, but the 95% confidence interval does cross zero.
From the models for acesulfame K and sucralose, there are associations with both sex and BMI; see Figures 4 and 5 below.
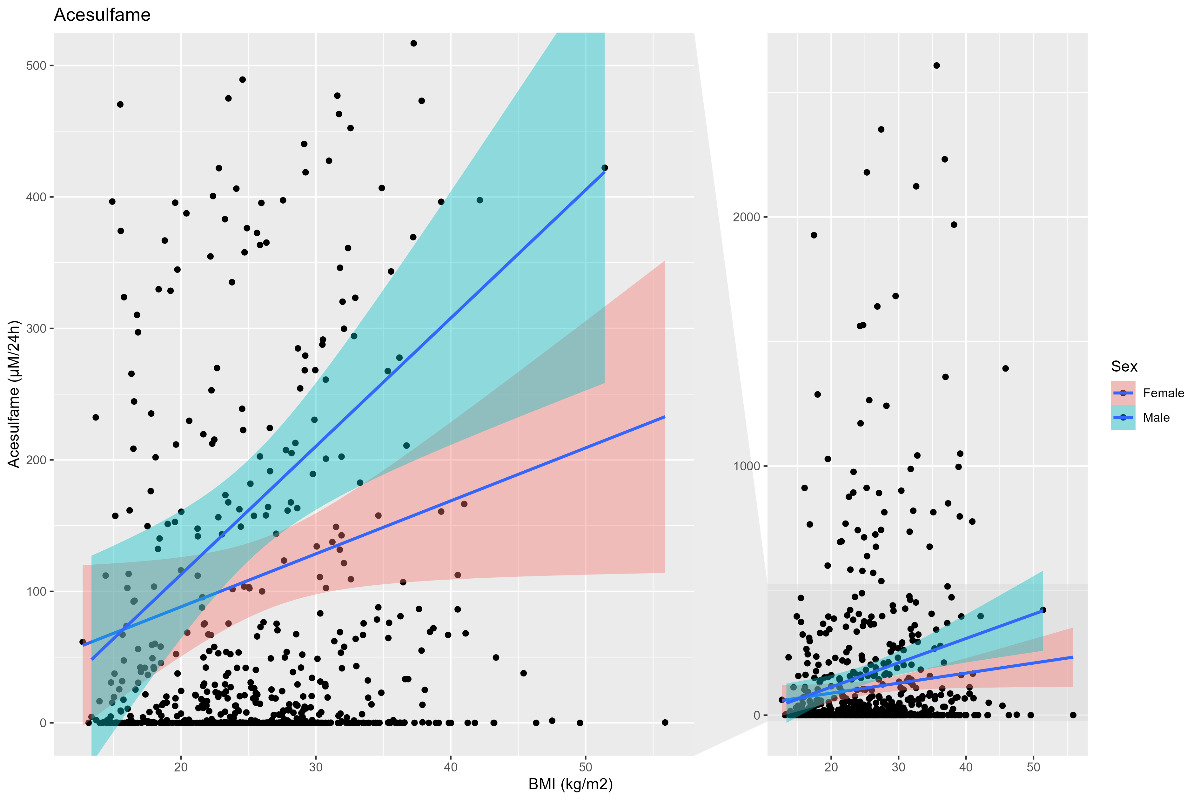
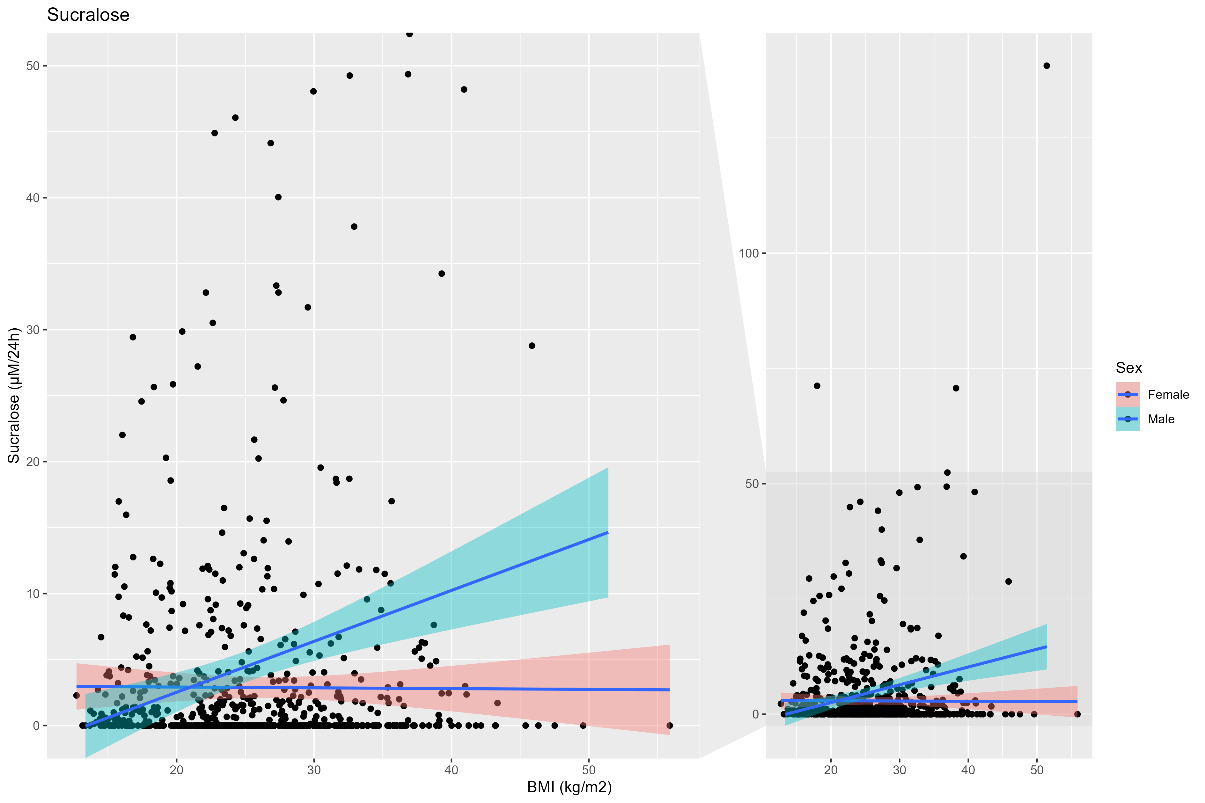
The estimated daily acesulfame K secretion (Figure 4) and sucralose secretion (Figure 5) showed a correlation with BMI which was significant for males, but not females.
For a number of estimated daily NSS secretion there was a weak association with equivalised income. For Na cyclamate, acesulfame K this association was negative (lower income higher estimated daily secretion), while for the sugar alcohols it was the positive association, this was significant for mannitol/sorbitol.
It is also possible to determine the associations between the number of NSS detected in the urine and sex, age, BMI, income and self-reported ethnicity and Government Office Regions.
These models show that, in particular, age is inversely associated with the number of NSS detected in the urine, children and young people have a significantly higher number of detectable NSS in the urine than adults. It also indicates that those reporting to be Asian in the NDNS sample have a lower number of detectable NSS in their urine.
5. Discussion
The results of this research show that it is possible to measure the concentration of NSS in stored urine samples of the NDNS. Through use of literature review information on the ADME of the NSS it was possible to interpret the measured urine concentrations. When biomarker data were integrated with NDNS participant data it was possible to explore potential differences between age groups and sex, consider if there were associations with factors like, age, BMI, ethnicity and income.
The results demonstrate that NDNS urine samples can be used as part of a biomonitoring exercise to measure urinary biomarkers of exposure to food additives and, with further work, these approaches could potentially be used to better understand population and individual UK consumer exposures.
NSS were selected as a case study on the basis of their widespread use, available analytical methods, and wider interest in exposure to these additives. It is possible to detect and measure a range of NSS in urine samples of the NDNS. In the NDNS Year 15 samples that were analysed, the exposure to NSS is essentially ubiquitous. All urine samples showed presence of NSS. More than 85% of the samples contained 4 or more different NSS. This finding may be partly due to the sugar alcohols erythritol and xylitol/arabinitol, which were present in all samples. As these substances are present naturally in some foods, the detection of these two analytes may or may not relate to use as an NSS.
5.1. Individual level exposure
The range of concentrations detected was wide, for example there was a greater than 4,000-fold difference between the lowest and highest concentrations of acesulfame K. This difference was even larger when corrected for creatinine concentration and for the estimated 24 h urinary excretion. The highest estimated value was 2,608 µmol/24 hrs of acesulfame K and the lowest detected amount 0.032 µmol/24 hrs, which is almost 6 orders of magnitude difference. However, these are spot urine samples and the time since last consumption of any NSS will be the main determinant of the urine concentration; no specific information about recent NSS consumption was collected alongside the urine collection. In addition, water consumption can dilute urine and make it more difficult to detect very low concentrations. Based on the half-lives of the NSS that were analysed, following a high NSS intake, it will take between 1 to 3 days to reach undetectable concentrations in the urine (see Table 20).
There was a wide range of urinary concentrations of NSS. The highest concentrations may be a result of a large exposure to NSS close to the provision of the spot urine sample and are not expected to be indicative of steady state exposure. Even if a worst case is assumed, that these values do represent the steady state, as per the highly conservative maximum estimated daily intakes in Table 20, there are no concerning exceedances of the relevant toxicological reference values; therefore, this study does not indicate a concern for safety from NSS for UK consumers
There are limited data on the correlation between the concentration of NSS in spot urine and 24-hour urine samples. It has been hypothesised that NSS concentrations in spot urine samples can be used to reflect dietary exposure (Cai et al., 2025). Further work is essential to understand how spot urine concentrations can be used to assess NSS exposure and how these relate to 24-hour urine samples. Although the use of single spot urine sample analysis has severe limitations to understand individual exposure to NSS, in analogy to iodine (WHO, 2007), it is expected that it is possible to assess population level status from these samples.
5.2. Population level exposure
Almost all of the NDNS spot urine samples analysed had multiple NSS in detectable concentrations. Children, teenagers and elderly people had higher amounts excreted into their urine, and children and young people had a significantly higher number of detectable NSS in the urine than adults (see Table 23). This correlates with observations in wider literature that children and teenagers have a high consumption of processed foods (Chavez-Ugalde et al., 2024; Onita et al., 2021).
For several NSS (acesulfame K, sucralose, erythritol, see Table 21), a positive correlation with BMI was observed, which is clearer for males than females (see Figures 4 and 5). There was also some evidence of correlations with equivalised income for Na cyclamate and saccharin (lower income, higher urine concentrations) and between ethnicities for xylitol/arabinitol (see Tables 21 and 22), but the data were less robust in these areas. For example, for Na cyclamate there were very few detected exposures of this NSS and so the effective sample size is small. For comparisons across ethnicities, 86% of the samples tested were from donors who reported as white ethnicity, which makes comparisons across ethnic groups challenging. Therefore, further work on a larger, more representative, sample set would be required to investigate these findings further.
5.3. Limitations
This was a proof-of-concept study, in one year of the NDNS, (with no corresponding information on NSS intake) which limits the sample size, and use of single spot urine samples mean that individual exposure assessment is not possible, and any trends presented here are indicative only. It is important to understand that any observations around individual, or population level trends in excretion/intakes of NSS presented in this report serve only to indicate what analysis might be possible in future studies (see section 6 for more information).
This study provides an important first step, however there are significant shortcomings in the approach in using single spot urine samples for biomonitoring of NSS.
NSS often have very short half-lives (see Tables 2 to 11). This means that the detected level is highly influenced by the relative time between consumption and provision of urine sample on that same day; recent consumption can yield very high concentrations, while the consumption over 12 hours prior to the urine sample will only show very low concentrations. The accuracy of the estimated daily NSS excretion will likely be highly dependent of the consumption pattern, bioavailability and excretion rates of NSS. As the dietary behaviours are likely to be very different across individual participants some NSS could be consumed in a short time frame (e.g. the consumption of NSS containing yoghurt during breakfast) or drawn out in near continuous low-level consumption throughout the day (e.g. the drinking of NSS beverages from bottles in a sip-by-sip manner).
There are clear uncertainties in the estimation of the 24-hour creatinine clearance for the individuals in the NDNS. Creatinine clearance can differ due to turnover of muscle mass and associated creatinine excreted, as well as dietary factors of meat intake that can all effect the urine concentration and the validity of the 24-hour creatinine clearance estimations. The models used to estimate 24-hour creatinine clearance are not recent and have not been validated for the UK setting. The wide range of ages and body compositions warrant that the creatinine clearance estimation models should be validated for the NDNS context.
Any estimates of 24-hour exposures or dietary intakes of NSS are underpinned by the available ADME data on each substance. Much of the available ADME data are in animals, and where human data are available, the data relates to adults. Therefore, increased uncertainty applies to estimates made for children.
It should be noted that BMI for children was calculated as kg/m2, and did not account for age and gender. Therefore, the analysis of NSS per BMI for children should not be interpreted as an exposure relative to healthy weight.
Simple summaries of artificial sweetener concentrations should be interpreted with caution because a large proportion of the analytical results were below the LOD and LOQ. Although imputation enables the estimation of summary statistics such as means and percentiles, these estimates do not accurately characterise the lower tail of the distribution and may be influenced by the assumptions underlying the imputation approach. This limitation also affects estimates derived from generalised linear models fitted to the imputed data, potentially reducing the accuracy of estimated effect sizes and model predictions. Future analyses of population-level artificial sweetener concentrations may benefit from methods that explicitly account for values below the LOD and LOQ, such as left-censored regression models and mixture models.
An important and commonly used NSS is aspartame, which cannot be reliably measured by biomonitoring owing to a lack of reliable biomarkers. As aspartame is often used in combination with acesulfame, it was proposed that aspartame exposure might be estimated using acesulfame as a proxy. Any estimations made in this way are subject to high uncertainty as the ratio aspartame:acesulfame may vary and each may be used in isolation.
Some sugar alcohols are used as sweeteners but may also occur naturally in some foods. Therefore, it is not possible to determine the source of exposure from detection of these substances in urine alone. Exposures to other NSS may come from sources other than food, such as toothpaste, medicines and chewing gum, and there is no way of confirming the exposure source via biomonitoring.
Although this proof-of-concept work is not suitable for making reliable quantitative estimates of individual NSS exposures, it has effectively demonstrated that the use of spot urine samples is a valuable approach to qualitative measurement of NSS exposure in the population, and suggests there may be measurable differences across different groups at the population level.
6. Further work
This research project was designed as a proof-of-concept for biomarker measurement of NSS in urine for exposure assessment. Further work on 24-hour urine could help develop this approach further, including understanding the utility of spot urine-based studies. There is currently a limited understanding of how the food matrix affects the rate of absorption and excretion of NSS, for instance for food products with high fat or protein content. The literature is almost exclusively focussed on kinetics of NSS given dissolved in water. This is especially relevant for NSS in processed food and further work is necessary.
6.1. NDNS 2008 to 2019 (Years 1 to 11) 24-hour urine samples
In the first few years of the NDNS rolling programme (2008 to 2013, Years 1 to 5), 24-hour urine samples were collected for participants aged 4 years and above. In this period of the NDNS, food diaries were used for dietary assessment, although the time of the diaries did not correspond or overlap exactly with the urine collection. This phase of the NDNS is the only time when 24-hour urine samples were collected from children. Subsequently, 24-hour urine samples were collected from adults as part of urinary sodium surveys.
There is a total of 4,380 24-hour samples available in the NDNS Bioresource, dating from between 2008 and 2019 (see Table 24).
A recommendation is that the NDNS Bioresource collection of 24-hour urine samples could be analysed for their NSS profile and creatinine. This will yield several important insights:
-
Provide the data to validate the creatinine clearance rate estimations, crucial for the interpretation of the current data or any other work on NSS or other food additives in spot urine samples.
-
Provide data on children and young people.
-
Provide a baseline measurement of NSS exposure in 2008 and 2019 and provide opportunity to assess changes over the time period that these samples were collected and allow for comparison in any further projects with spot and 24-hour urine samples.
-
The number of 24-hour urine samples is almost 5 times larger than the current study and should therefore provide a more detailed understanding of NSS exposure, representative for the UK.
-
Alignment with dietary assessment. The use of the Years 1 to 5 24-hour urine samples will allow for a much more accurate estimation 24-hour excretion rate, which can be compared to the dietary intake data for that participant (reported through the 4-day estimated food diary). This will provide an opportunity to investigate the relationship between daily food diaries and daily NSS excretion, although the diary data may not refer to the urine sample collection day, so uncertainty will remain.
6.2. Upcoming Urinary Sodium Survey
As part of the 2023 to 2030 NDNS, the Urinary Sodium Survey in England (of adults aged 19 to 64 years) will collect 24-hour urine samples. These samples will become available around 2028 to 2029 and could be analysed for NSS.
With this additional data, it will be possible to:
-
Revalidate 24-hour creatinine clearance rates (that is after the analyses of Years 1 to 5 of the 24-hour urine samples), which will help the interpretation of spot urine samples in other/future years of the NDNS.
-
Have an up-to-date understanding of NSS exposure in the UK.
-
In conjunction with the analysis of Years 1 to 5 of the 24-hour urine samples, it will be possible to estimate changes in NSS exposure in adults between these two time periods.
6.3. Matrix effects
Further investigation is required to determine how food matrices (e.g., matrices high in fat or protein) within processed foods affect the absorption and excretion kinetics of these additives, to facilitate more accurate integration of dietary and biomonitoring data.
7. Conclusion
This proof-of-concept exercise demonstrates that it is possible to measure exposure to food additives (specifically NSS) from stored urine samples of the NDNS. This information was integrated with literature survey results to interpret the measured urine concentrations and together it provided information on the qualitative and quantitative ranges of exposure. The data show potential associations with age, sex, and BMI at a population level. There was a very wide range of detected urinary concentrations, but samples without any detectable NSS were rare, suggesting widespread exposure to NSS is common across the UK population.
The very short half-lives of many NSS, and the limitation of single spot urine samples, make it impossible to use these data to make robust estimates of individual level UK NSS exposure.
Some individuals exhibited very high urinary concentrations of NSS which may be a result of a large exposure to NSS close to the provision of the spot urine sample and is not expected to be indicative of steady state exposure. Even if these exposures are assumed to represent the steady state, there are no concerning exceedances of the relevant toxicological reference values; therefore, this study does not indicate a concern for safety from NSS for UK consumers.
There are existing 24-hour urine samples available (Years 1 to 5 of the NDNS), and new 24-hour urine samples will be collected as part of the upcoming NDNS Urinary Sodium Survey which offers the potential to provide a better estimate of daily intakes in the UK. Time trend analyses will also be important to understand population intakes and trends over time.