
Executive Summary
The objective of this risk assessment was to assess the difference in the per portion microbiological risk to consumers from minced meat and meat preparations, intended to be eaten cooked, produced by UK cutting plants processing less than two tonnes per week (“low-throughput establishments”). These establishments are currently exempt from the routine microbiological sampling requirements specified in assimilated Regulation (EC) No 2073/2005 (and Regulation (EC) No 2073/2005 in Northern Ireland). The assessment compared the consumer risk from low-throughput establishments with that from establishments producing more than two tonnes per week (“high-throughput establishments”) which are subject to mandatory sampling.
This risk assessment was informed by microbiological results from FSA research project FS900516, which measured Salmonella spp., Escherichia coli and aerobic colony counts (ACC) levels in minced meat and meat preparations from cutting plants in England, Wales, and Northern Ireland. FBO self-collected data were made available by Food Standards Scotland (FSS). The available results included presence/absence testing for Salmonella spp. and enumeration of indicator organisms, namely presumptive E. coli and ACC, on beef, pork, lamb, and chicken products.
Indicator organisms were considered as contextual information rather than direct measures of consumer illness risk. ACC was used to assess overall microbiological quality and process hygiene, while E. coli served as an indicator of faecal contamination control. Neither indicator demonstrated evidence that poorer hygiene performance was systematically associated with either low or high-throughput establishments.
It should be noted that this is an assessment of the relative risk between high- and low-throughput cutting plants and does not represent an assessment of the risk to UK consumers from minced meat and meat preparations as a product category or from cutting plants as a sector.
Sampling results showed that Salmonella spp. detections were rare in both throughput categories. Although a higher proportion of batch-level failures was observed in low-throughput establishments (4.5%) compared with high-throughput establishments (1.0%), this difference was not statistically significant, and the overall number of positive batches was very small (2%). No Salmonella spp. was detected in beef samples. Indicator E. coli results did not differ significantly by establishment size, suggesting similar performance of key hygiene barriers related to faecal contamination across both categories. ACC results showed species-specific differences, but no consistent throughput-related pattern, with higher levels in beef and pork coming from larger establishments but lower levels in lamb originating from the same establishments; these differences were interpreted as reflecting general hygiene, process, or storage variation rather than throughput-size related likelihood of pathogen introduction.
Consumer exposure after products leave the cutting plant was assessed using national consumption and behavioural data. Consumption patterns varied by species of meat-producing animal and age group of consumers, with beef minced being the most frequently consumed, while poultry minced was the least frequently consumed product during the period of the consumption survey, across all age groups. Consumption of undercooked minced meat does occur but is uncommon and mainly confined to specific adult groups. Nevertheless, the products considered in this risk assessment are intended to be eaten cooked. Although cross contamination and temperature abuse can increase microbial exposure, there is no evidence that these behaviours differ according to the size of the cutting plant of origin, so they are not expected to contribute to any difference in risk. Adequate cooking (achieving a core temperature of 70 °C for at least two minutes, or an equivalent time-temperature combination) is sufficient to eliminate vegetative pathogens, including Salmonella spp.
National surveillance data indicate that Salmonella spp. remains an important public health hazard, with recent increases in reported human cases despite heterogeneous trends in livestock reservoirs. Meat and meat products continue to feature in food incidents and outbreaks, particularly minced meats and chicken. However, these data provide context on hazard relevance and disease burden rather than evidence of differential exposure linked to establishment throughput.
On the basis of the available data considered in this risk assessment, there was insufficient statistical evidence to demonstrate a difference in the per-portion likelihood of microbiological exposure of UK consumers to Salmonella spp. from minced meat and meat preparations intended to be eaten cooked, originating from UK cutting plants producing less than two metric tonnes per week in comparison to those producing more than two metric tonnes. However, the low number of positive Salmonella spp. samples and failing batches resulted in substantial uncertainty and limited statistical power, meaning that a true difference in risk between throughput groups cannot be excluded. Therefore, the uncertainty associated with this assessment is High.
Statistically significant species-specific differences were detected for ACC contamination, although those did not translate into a consistent overall throughput size effect. These results are more likely to reflect species-specific processing steps and variability in operational practices, rather than a consistent effect of establishment size. E. coli levels were broadly comparable between throughput groups and species, indicating that controls of faecal contamination appear similar across establishment sizes.
The severity of detriment of salmonellosis is considered to be Low for the general population and Medium for vulnerable groups, with Medium uncertainty due to the range of serotypes detected in Salmonella spp. positive samples.
Lay Summary
This risk assessment was commissioned following an internal audit requiring the FSA, as the competent authority, to update the evidence base supporting exemptions from microbiological testing for small cutting plants. These establishments produce less than two metric tonnes per week of combined minced meat and meat preparations, intended to be eaten cooked.
The risk assessment addresses the risk question: “What is the difference in the microbiological risk to UK consumers from minced meat and meat preparations intended to be eaten cooked, produced in cutting plants processing less than two metric tonnes per week, compared with those producing more than two metric tonnes?”
Under Regulation 2073/2005, cutting plants are normally required to carry out microbiological testing for Salmonella spp., E. coli, and aerobic colony counts (ACC) to check hygiene and food safety. However, smaller cutting plants, producing fewer than two metric tonnes per week of products intended to be eaten cooked, are currently exempt from mandatory microbiological testing in the UK. This assessment was undertaken to inform a decision by the FSA about whether it is justifiable to maintain that exemption, using up-to-date data.
This assessment was based on microbiological data gathered from an FSA survey (FS900516), which collected samples from cutting plants in England, Wales, and Northen Ireland, together with data from Food Standards Scotland (FSS), provided by establishments from their own testing programmes. Results on Salmonella spp., E. coli, and ACC levels in minced meat and meat preparations were collected. Together these datasets were used to provide a current picture of contamination level and hygiene performance in small and larger establishments.
Across all species tested and analysed (beef, pork, lamb and chicken), Salmonella spp. was detected only rarely. While Salmonella spp. was found slightly more often in small establishments compared to large establishments, the difference was small and not statistically significant. No Salmonella spp. was detected in beef samples from either group. In larger establishments Salmonella spp. was detected only in chicken.
Results for generic E. coli, which is used as an indicator of faecal contamination, showed no clear difference between smaller and larger establishments. This suggests that key hygiene controls were broadly similar in both groups. ACC findings, which reflect general microbiological quality rather than food safety, showed some species-specific differences: higher contamination levels in beef and pork from smaller establishments whereas lamb contamination was higher in some larger establishments. For chicken, ACC levels were similar across both categories. These differences were interpreted as reflecting variation in processing or handling practices rather than increased food safety risk.
Consumption and handling of meat after it leaves the cutting plant were also considered. Beef minced was identified as the most frequently consumed product, while poultry minced was the least frequently consumed. Undercooked minced meat consumption does occur, mainly among some adult groups, but it is uncommon. There is no evidence that consumer handling, cooking, or hygiene practices differ depending on whether meat comes from a small or large cutting plant. When meat is cooked properly, to a core temperature of 70 °C for at least two minutes (or an equivalent time-temperature combination), Salmonella spp. and other bacteria are effectively destroyed.
National surveillance data on human salmonellosis were reviewed to provide wider context. These show that Salmonella spp. remains an important cause of foodborne illness in the UK, with recent increases in reported human cases despite mixed trends in livestock. Meat and meat products continue to feature in food incidents and outbreaks. However, these data do not indicate whether meat from smaller establishments poses a higher risk than meat from larger establishments.
Based on the evidence reviewed, there was insufficient evidence to conclude that microbiological risk to UK consumers from minced meat and meat preparations intended to be eaten cooked, produced by cutting plants processing less than two tonnes per week, is higher than the risk from plants producing more than two tonnes per week. This conclusion reflects the very low number of Salmonella spp. detections overall, the lack of meaningful differences between smaller and larger plants, similar hygiene indicator results, and comparable consumer handling and cooking practices.
There is high uncertainty in this assessment, primarily due to the very low detection rate of Salmonella spp. and the small sample sizes for certain Salmonella-animal species combinations, sampling that was carried out over a limited time period, and some differences that existed between data sources. Importantly, this assessment compares the relative risk between small and large cutting plants only; it does not assess the overall risk of minced meat and meat preparations as a product category.
1. Statement of purpose
1.1. Risk question
What is the difference in the per-portion microbiological risk to UK consumers from minced meat and meat preparations intended to be eaten cooked, from UK cutting plants producing less than two metric tonnes per week, compared to those producing more than two metric tonnes per week?
1.2. Scope of risk assessment
This risk assessment assesses the risk to consumers posed by minced meat and meat preparations produced from animal species including beef, lamb, pork, venison, chicken and game, where data are available. The focus is on establishments with an average throughput of less than two tonnes per week (“low throughput”), which are currently exempt from the specified microbiological sampling in assimilated Regulation (EC) No 2073/2005 (Regulation (EC) No 2073/2005 in Northern Ireland) (Gov.UK, 2005a).
Regulation 2073/2005 sets out the sampling frequencies for undertaking microbiological testing against food safety criteria (FSC) for Salmonella spp., and process hygiene criteria (PHC) for E. coli and aerobic colony counts (ACC), with exemptions permitted in some cases. Chapter 3.2 of the regulation sets out that when justified on the basis of risk analysis and consequently authorised by the competent authority, small establishments producing minced meat and meat preparations in small quantities may be exempt from the specified sampling frequencies (Gov.UK, 2005b).
Exemptions and flexibilities from the specified sampling frequencies have been applied to smaller Food Business Operators (FBOs) in the UK, since at least January 2006, when the first version of the FSA’s Meat Industry Guide (MIG) was published. The MIG was withdrawn in November 2020; however, these sampling frequencies are now set out in Chapter 4.3 of the Manual for Official Controls (MOC) (FSA, 2024a). One of the exemptions applies to establishments producing an average of less than two metric tonnes per week of combined minced meat and meat preparations intended to be eaten cooked, which are currently not required to undertake any sampling.
As a result of an internal audit by Operational Assurance in 2023, it was agreed to review the rationale for the exemptions. This assessment compares the per portion risk from low-throughput establishments with that associated with the same product types produced in establishments averaging more than two tonnes throughput per week, which are required to undertake microbiological sampling.
1.3. Terms of reference
This risk assessment aims to establish the evidence base to assess whether the exemption for establishments producing an average of less than two tonnes per week of combined minced meat and meat preparations intended to be eaten cooked remains justified.
The assessment focuses on comparing the relative risk between throughput categories, rather than characterising the absolute risk within each category. The lack of comprehensive information on the total throughout per establishment size prevented a more comprehensive category-specific risk characterisation and limited the extent to which conclusions could be generalised to a population basis.
In scope:
-
Products in scope are defined as follows:
-
Minced meat: boned meat that has been minced into fragments and contains less than 1% salt (FSA, 2018a; Gov.UK, 1996).
-
Meat preparations: fresh meat, including meat reduced to fragments, to which foodstuffs, seasoning or additives have been added, or which has undergone processes insufficient to modify the internal muscle fibre structure of the meat and thus eliminate the characteristics of fresh meat (FSA, 2018a; Gov.UK, 1996).
-
Animal species
Minced meat and meat preparations from beef, lamb, pork, venison, chicken and game, where data are available.
-
Cutting plant sizes
-
Smaller establishments (throughput <2-tonne/week exempt from microbiological testing),
-
Larger establishments (throughput >2-tonne/week which do carry out microbiological testing).
-
-
Data sources
-
Data gathered from cutting plants during research project FS900516 (England, Wales and NI),
-
Data obtained by FSS from Food Business Operators (FBOs).
-
Out of scope:
-
Products
Mechanically Separated Meat (MSM) or minced meat and meat preparations intended to be eaten raw or undercooked (e.g., burgers intended to be eaten less than thoroughly cooked). If an establishment produces even a small quantity of such products, it is not exempt from sampling. -
Management plans
It is not within the scope of this assessment to evaluate plant-specific risk management plans, the interventions used in plants of all sizes in response to sampling failures, or the risk associated with any alternative sampling frequencies.
Key Assumptions
For the purposes of this risk assessment, it is assumed that post-production handling of the meat products is the same irrespective of the size of the establishment in which they were produced. Post-production handling includes transport, storage, pre-cooking preparation, and cooking.
1.4. Background
Microbiological criteria provide benchmarks for assessing the microbiological quality of food products and verifying the correct functioning of manufacturing processes. Although microbiological testing on its own cannot guarantee that a tested food is safe, these criteria serve as key targets and reference points for FBOs and competent authorities to manage and monitor food safety (European Commission, 2005). In the UK, the FSA is the national authority responsible for food safety and food hygiene across England, Wales and Northern Ireland, while Food Standards Scotland (FSS) is the food safety authority in Scotland.
Assimilated Regulation (EC) No 2073/2005 (as amended) establishes the microbiological criteria applicable to specific micro-organisms, along with the implementing rules that FBOs must comply with when applying the general and specific hygiene requirements set out in Article 4 of Assimilated Regulation (EC) No 2073/2005 (Gov.UK, 2005b).
Any establishment that cuts meat and then places it on the market as fresh meat must be approved as a cutting plant and is therefore subject to official veterinary controls, with certain exemptions for retail premises selling directly to the final consumer, e.g. retail establishments that supply cut meat directly to the consumer (FSA, 2024a). In practice, that means butcher shops or supermarkets that cut meat on site and sell directly to consumer are exempt from a cutting plant approval requirement. Regulation (EC) No 853/2004 (EC) sets out the hygiene requirements that apply to all approved establishments where meat cutting takes place (FSA, 2024a; FSS, 2018).
When implementing general and specific hygiene measures described in (EC) No 853/2004, the FBO must follow assimilated Regulation (EC) No 2073/2005 (as amended) which sets out the microbiological criteria for specific microorganisms. This regulation defines two distinct categories of criteria: food safety criteria (FSC) and process hygiene criteria (PHC) (Gov.UK, 2005a).
Food safety criteria (FSC) evaluate the safety of the final product. Failure to meet an FSC requires that the affected batch must not be placed on the market (withdrawal) or, if already distributed, must be removed from the market (recall). Any FSC established must be relevant to protecting consumer health and practical to implement. They are developed in line with internationally recognised principles, such as those of the Codex Alimentarius (Codex, 2025), and are based on formal risk assessments whenever possible.
Process hygiene criteria (PHC) are set to assess the hygienic performance of the production process. They indicate whether slaughter, dressing and/or processing operations are carried out hygienically at the time of sampling and whether the food safety management systems in place are effective. If PHC is not met, the FBO must review and improve their production processes (FSA, 2024a).
During the production of minced meat, meat preparations and meat products, any bacteria, including pathogenic bacteria, present on the surface of the carcase meat can be spread throughout the product. Additionally, contamination may be introduced from the environment, or through handling and processing failures (FSS, 2018). Compliance with PHC is therefore critical for food safety. PHC results are used to verify whether FBOs’ production processes and their Hazard Analysis and Critical Control Points (HACCP) systems are functioning effectively, and ensuring compliance with regulatory requirements (FSA, 2024a). Where PHC results are unsatisfactory the FBO must take action to improve production hygiene and selection of raw materials.
In the UK, PHC are set for faecal and other forms of bacterial contamination in food. PHC apply only to food businesses involved in manufacturing, preparing, or producing the specific food in question. They are set for products at defined stages of the production process and do not apply to foods that have already been placed on the market.
Table 1 summarises the microbiological criteria applicable to minced meat and meat preparations under assimilated Regulation (EC) No 2073/2005 Annex I. For high-throughput establishments, FBOs shall take samples for microbiological analysis at least once a week; for E. coli and ACC, the frequency may be reduced to fortnightly testing if satisfactory results are obtained for 6 consecutive weeks. A similar approach may be taken for testing for Salmonella spp. if satisfactory results are obtained for 30 consecutive weeks or where an effective national or regional control programme is in place and demonstrates low prevalence (EU, 2005; FSA, 2005). In the UK, establishments producing an average of less than 2 metric tonnes per week of combined minced meat and meat preparations intended to be eaten cooked are currently not required to take any samples (FSA, 2024a).
2. Hazard identification
Meat intended for portioning may be contaminated with pathogenic bacteria, and these organisms can multiply rapidly if the meat is stored at insufficiently low temperatures. Inadequate hygiene practices further increase the risk of contamination, including the transfer of bacteria from raw meat to other foods, particularly ready-to-eat products, thereby increasing the likelihood of foodborne illness.
This risk assessment is based on the microorganisms regulated as FSC or PHC for minced meat and meat preparations intended to be eaten cooked. These are Salmonella spp. (FSC), indicator E. coli species and ACC (PHC). While all Salmonella species can cause disease in humans when ingested via food, indicator E. coli and ACC are used as process and hygiene indicators. Both provide important but different information about hygiene controls during slaughter, processing and storage, and together they support the interpretation of microbiological performance in meat production systems.
2.1. Microorganisms relevant to food safety and hygiene process
2.1.1. Salmonella spp.
Salmonella spp. are gastrointestinal zoonotic bacteria that can be transmitted from animals to humans. They belong to a group of Gram-negative, flagellated, facultatively anaerobic bacilli (Ehuwa et al., 2021). Most of the non-typhoidal Salmonella spp. serovars have a broad host range and are commonly found in the intestinal tract of many animals, including chicken, pigs, cattle, sheep, horses, dogs and wildlife such as birds, reptiles and rodents (Chlebicz et al., 2018; Ehuwa et al., 2021; UKHSA, 2025b). In food-producing animals, Salmonella spp. can contaminate meat through direct faecal contamination during slaughter and processing. It may also be present on raw meat surfaces, in raw milk, and in products made from under-processed animal products as a result of cross-contamination (Chlebicz et al., 2018).
Transmission to humans occurs via the faecal-oral route, most frequently through the consumption of contaminated food or through cross-contamination during food preparation (Ehuwa et al., 2021). Salmonella spp. are of public health concern because it is a leading cause of foodborne illness worldwide, can cause severe disease in vulnerable populations, and is readily spread if effective hygiene, cooking and food-handling controls are not in place. Consequently, controlling Salmonella spp. along the food chain is critical for protecting both consumer health and food safety (Ehuwa et al., 2021).
2.1.2. Generic (Indicator) Escherichia coli (E. coli)
Generic E. coli is used as a specific hygiene indicator, particularly in meat production, because it originates from the intestinal tract of animals. Its presence in the final product suggests faecal contamination or cross-contamination during slaughter or processing and may indicate a failure in personal hygiene, evisceration or cleaning processes.
Whilst most E. coli strains are not pathogenic, elevated levels of generic E. coli are associated with an increased likelihood of enteric pathogens (e.g. Salmonella spp. or pathogenic E. coli) being present (National Research Council (US), 1985; UKHSA, 2024).
2.1.3. Aerobic colony count (ACC)
Aerobic colony count (ACC) measures the total population of viable aerobic and facultative anaerobic microorganisms and is used as a general indicator of overall microbiological quality, reflecting the effectiveness of cleaning, sanitation, temperature control, handling, storage time, and shelf-life management. When the level of indicator organisms is elevated, we assume that the risk of pathogens has increased but may not have been captured by sampling, because pathogens often occur sporadically and at low levels, whereas indicator organisms act as conservative early-warning signals of underlying control failures (National Research Council (US), 1985; UKHSA, 2024).
2.1.4. General limitations of sampling on the interpretation of microbiological criteria
The application of microbiological criteria has some limitations. Factors such as sampling variability, methodological constraints and uneven distribution of microorganisms in food, mean that microbiological testing alone can never guarantee the safety of a food product. For this reason, food safety is primarily achieved through a structured preventive system, including the implementation of good hygiene practices, and adherence to Hazard Analysis and Critical Control Point (HACCP) principles, rather than reliance on end-product-testing alone. In the absence of appropriate corrective action, failed or unsatisfactory microbiological sampling results do not, by themselves, improve the microbiological safety of meat. Proportionate, routine microbiological testing should instead be viewed as a tool for verification and trend monitoring, supporting effective implementation of hygiene and process controls across establishments of all sizes.
2.2. Physicochemical properties of meat
Raw fresh meat has typically acidic to neutral pH of 5.3-5.8, and water activity (aw) of 0.56-0.73 (USDA, 2025). Salmonella spp. are highly adaptable bacteria capable of growing across a broad environmental range. They multiply between 8-45 C (optimum 37 C), tolerate pH 4.0-9.5 (optimum 6.5-7.0), and can survive in low water activity (<aw 0.94) environments (Chlebicz et al., 2018). Therefore, if Salmonella spp. are present in meat, its physicochemical properties would support the pathogen’s survival.
2.3. Sampling survey
This risk assessment used the results from the FSA’s sampling survey FS900516: ‘A survey of Salmonella spp., E. coli and aerobic colony count (ACC) in minced meat and meat preparations from cutting plants in England, Wales and NI’, carried out between 7th October to 15th November 2024. The survey was designed to address a data evidence gap to inform a strategic risk assessment on process hygiene criteria. Samples of minced meat and meat preparations were collected over a 6-week period, from both high-throughput and low-throughput meat cutting plants. The plants were based in England, Wales and NI and were visited by unannounced FSA inspectors. Each plant was visited once a week, and 5 samples were collected per visit as described in the legislation (Gov.UK, 2005a), either of different animal species, if more than one was processed, or of different batches if only one species was processed. Samples were collected at random, prior to packaging, then sent to the laboratory within 24 h from sampling and tested within 24 h of receipt. The survey was carried out to establish new baseline levels for these microorganisms within the food products in scope, to inform an FSA assessment of the relative risk to consumers from products from cutting plants processing two metric tonnes of meat a week or less, which are currently exempted from sampling.
Data provided by FSS from establishments approved by FSS was also analysed. This dataset included results of sampling by FBOs in Scotland which are either non-exempt or which might be exempt from testing (those under two-tonne production per week) but choose to sample.
The number of establishments for which data were available in both datasets can be found in Table 2. The number of total approved establishments is also included in the table for context. The number of samples taken per establishment size and animal species can be found in Table 3.
The dataset contained limited or no sampling results for venison and game, and therefore only animal species such as beef, pork, lamb and chicken (chicken) have been analysed and discussed in this risk assessment. Similarly, data were not sufficient to compare mixed or other (buffalo and venison) products. Unknown products could not be classified by species and were not included in the analysis either.
3. Exposure assessment
3.1. Methodology
Data were available for England, Wales, Northern Ireland and Scotland. The data were combined for analysis. The variables listed in Table 4 were considered for suitability for the analysis.
The dataset contained a total of 3,285 datapoints (number of test results for all samples, including for ACC, E. coli and Salmonella spp.). After filtering out poorly defined species such as “Mixed”, the datapoints available dropped to 3,015. The results_unit variable also contained some blanks which were filtered out to avoid ambiguity. Therefore, the total number of datapoints used in the analysis was 2,717.
Not all data and metadata were available for all of the datapoints. Censored data (observations where the exact value is only partially known, either because it falls above, below, or within a certain range, such as when a value is below the limit of quantification (LOQ) or limit of detection (LOD) of the test used) were treated using substitution based on the analyte in question. This is explained in more detail in the respective analyte sections.
The objective was to compare microbiological results (ACC, E. coli, Salmonella spp.) across different cutting plant sizes (≥2 tonnes/week vs <2 tonnes/week).
The following explanatory variables were considered:
-
Batch number (also an identifier for the establishments)
-
Animal species
-
Data sources (FSA/FSS)
Data obtained from FSA’s sampling survey FS900516 and from Scottish FBOs were not balanced in the same way (different data distribution across species, establishment sizes, etc.) when descriptive statistics were examined before considering data source as a variable in the models, and this was taken into account when the data was analysed.
3.2. Salmonella spp.
Testing of minced meat and meat preparation samples for Salmonella spp. detection, enumeration, and serotyping was carried out in accordance with ISO 6579-1 using a horizontal method (a standardised procedure applicable across different food matrices rather than tailored to a specific product type). Following confirmation of Salmonella spp. isolates, serotyping was performed by determining the presence or absence of specific O-, H- and Vi-antigens.
For Salmonella spp., an initial mixed-effects logistic regression model was explored to assess associations with establishment throughput while accounting for batch-level clustering. The logistic regression was chosen because Salmonella spp. is in the form of binary data (“Detected” and “Not Detected”). Batch number was included as a random effect to account for non-independent repeated samples within a batch. However, due to the very low number of positive detections, the model provided limited scope for reliable inference. Consequently, a simpler batch-level pass/fail approach was used. Each batch was classified as Fail if it contained at least one positive result and Pass if it contained no positive results for Salmonella spp.
A species (beef, pork, lamb and chicken) stratified descriptive analysis was conducted to compare batch failures for Salmonella spp. between high-throughput and low-throughput cutting plants. Additionally, a Fisher’s exact test was conducted for each species to determine if there is enough evidence of a difference between high- and low-throughput cutting plants. Odds ratios (ORs) and confidence intervals (Cis) were also calculated to give extra context for the magnitude and uncertainty of this difference.
Due to the low Salmonella spp. detection rates and small effective batching sizes, statistical power was limited.
3.3. Aerobic colony count (ACC)
Enumeration of ACC was based on colony count at 30 °C by the pour plate technique, according to ISO 4833-1:2013.
For ACC, a linear mixed-effects model was fitted to log10-transformed results, with data source, throughput, species, throughput and species interaction included as fixed effects. Batch number was included as a random effect to account for non-independent repeated samples within a batch. The linear model was chosen because ACC data is continuous. Further species-specific analysis was performed using estimated marginal means (EMMs) to determine which species showed significant difference between high- and low-throughput establishments. EMMs were calculated from the fitted model to compare mean ACC levels between high- and low-throughput establishments.
Descriptive checks suggested that FS900516 survey data (FSA) and Scottish FBOs data (FSS) were not distributed in the same way across species and throughput. Therefore, source (FSA or FSS) was added as an extra explanatory variable. Where censored ACC values were reported, upper-censored values were replaced with their stated limits (e.g. >3,000,000 is given as 3,000,000) and lower-censored values were replaced with half their stated limits (e.g. <10 is given as 5). This approach was considered acceptable for ACC because the proportion of censored data was low (9.4%), and any assumptions made with these conversions expected to have minimal impact on the results. A sensitivity analysis was additionally performed excluding all censored observations to assess the robustness of the conclusions.
3.4. Generic (Indicator) E. coli
The E. coli enumeration method was based on a horizontal method for the enumeration of beta-glucuronidase-positive Escherichia coli, according to ISO 16649-2:2001 (colony count technique at 44 °C using 5-bromo-4-chloro-3-indolyl beta-D-glucuronide).
For E. coli, applying the same analytical approach as for ACC was not considered appropriate across all species because the number of results below the LOQ differed substantially between chicken and non-chicken species. Non-chicken (beef, pork and lamb) animal species had very high levels of censoring, with approximately 85-90% of non-chicken results below the LOQ, predominantly as <10 cfu/g. In contrast, chicken data had little to no censoring, as samples were commonly contaminated. Therefore, E. coli was analysed separately for chicken and non- chicken species.
For non-chicken, results were converted to binary outcomes based on whether a result was censored (reported as <10 cfu/g) or uncensored (reported as numerical values). Some results were reported as less than 100 cfu/g (2.9%), rather than less than a 10 cfu/g, so these were excluded from this binary classification to avoid ambiguity with respect to the less than a 10 threshold.
A mixed-effects logistic regression model was fitted with throughput, species and their interaction included as explanatory variables. Batch number was included as a random effect to account for repeated samples within batches. Source was not included as a fixed effect as the proportion of censored data for non-chicken E. coli was very high, leading to less information in the non-censored part of the data. Adding another fixed effect would have reduced model stability/interpretability. Secondary analysis was performed to check the effects of adding source as a fixed effect. Further species-specific analysis was performed using EMMs from the fitted model. Within each species, comparisons between high- and low-throughput establishments were evaluated, consistent with the approach used for ACC.
For chicken, where censoring was minimal (1/56 samples), a linear mixed-effects model was fitted with log10-transformed results with throughput as a fixed effect and batch as a random effect. Source was not included as a fixed effect for the chicken analysis as the data from the FSS source had no chicken present.
It is important to note that because the censoring differed greatly between non-chicken and chicken, the E. coli analysis addressed related but distinct questions depending on species. The non-chicken analysis compared the likelihood of results being below the LOQ (<10) with measurable values, whereas the chicken analysis compared differences in measured E. coli levels. Although both assess potential differences between low-throughput and high-throughput establishments, they do so in different ways and should not be interpreted as directly comparable tests.
3.5. Software for statistical analysis and data visualisation
The data was analysed with the R programming language, version 4.5.1. The tidyverse, emmeans, logistf, lme4, lmerTest, and Matrix suite of packages were used (D. Bates et al., 2015, 2026; Heinze et al., 2025; Kuznetsova et al., 2017; Lenth et al., 2026).
Data was visualised with the R programming language, version 4.5.1, with tidyr, dplyr, stringr, ggplot2, broom, scales, and patchwork suite of packages (Pedersen, 2025; Wickham, 2016; Wickham et al., 2019, 2025b, 2025a).
3.6. Results
3.6.1. Salmonella spp.
At the sample level, the detection rate of Salmonella spp. in high-throughput establishments were lower than in low-throughput establishments. In low-throughput establishments, the highest detection rate was observed in pork (12.7%), followed by lamb (2%) and chicken (6.3%). In contrast, in high-throughput establishments, Salmonella spp. were only detected in chicken (7.5%). No detections were recorded in lamb or pork samples from these larger establishments. No Salmonella spp. were detected in beef in either throughput category of establishments. These results are presented in Table 5 in more detail.
Mixed-effects logistic regression models were explored, but due to the very small number of Salmonella spp. failures the models were not informative. A Fisher’s exact test was considered more appropriate as the primary analysis, as it produces a simple exact comparison of the observed failure rates without requiring estimations of fixed and random effects variables.
Due to the low overall detection rate of Salmonella spp. at a sample level, statistical analysis was conducted using a batch-level pass/fail outcome in accordance with the EU microbiological criteria approach. A batch was classified as a Fail if it contained at least one Salmonella spp. positive result, and as a Pass if all results were negative.
The results of the species stratified Fisher’s tests are presented in Table 5. Interpretation of this analysis was limited by the small number of Salmonella spp. batch failures observed across all species, resulting in substantial statistical uncertainty. No comparison was possible for beef as Salmonella spp. batch failures were not identified in either throughput category. Similarly, the low number of failures observed for lamb prevented any meaningful inference on differences between throughput groups.
For pork, the Fisher’s exact test produced a p-value of 0.0503 which is not significant by conventional standards (p < 0.05). Although the p-value was close to the conventional significance threshold, only two failing batches were observed in total, meaning that the estimate is highly unstable and should be interpreted with caution. For chicken, the observed batch failure proportions were identical (12.5%) providing no evidence for a difference in Salmonella spp. batch failure rates by establishment size. For several species, the OR and upper CI often output as “Inf” (infinity) due to the absence of observed failures in a certain category suggesting a high level of uncertainty. Overall, the sparse number of failures across species substantially limited the statistical power of the species-stratified analysis.
To overcome this limitation and to increase statistical power, batches were analysed across all four animal species at the batch-level, high-throughput establishments recorded 2 Fails out of 208 batches (1%), while low-throughput establishments recorded 4 failing batches out of 89 total batches (4.5%). These results are shown in Table 7.
Fisher’s exact test produced a p-value of 0.0682, indicating that the difference in batch failure rates between throughput groups did not reach conventional levels of statistical significance (p<0.05). Therefore, there was insufficient statistical evidence to conclude that Salmonella spp. batch failure was more common in establishments processing less than two tonnes per week compared with those processing more than two tonnes per week. However, the observed difference in failure rates was numerically notable (4.5% in low-throughput and 1% in high-throughput plants), and the analysis was based on a small number of failing batches (6/297). As a result of the low statistical power of the tests, the findings should be interpreted with caution.
To provide additional context on the magnitude and precision of the observed association, ORs and 95% CIs were also calculated. This analysis estimated that the odds of Salmonella spp. batch failure were approximately 4.8 times higher in low-throughput establishments than in high-throughput ones (OR=4.82). However, the corresponding 95 % CI (0.68 to 54.16) was very wide, reflecting substantial uncertainty in the estimate due to the small number of observed failures. Importantly, the confidence interval includes 1, indicating that the data are also consistent with no true difference between establishments sizes. This interpretation aligns with the Fisher’s exact test (p=0.0682), which did not reach the conventional threshold for statistical significance (p < 0.05).
Overall, while the results may suggest a possible association between low-throughput plants and higher Salmonella spp. batch failures, the available data are insufficient to support this conclusion. Nonetheless, Salmonella spp. detections highlight that Salmonella spp. remains a food safety risk due to its ability to survive common environmental conditions and its potential to cause illness.
When Salmonella spp. was detected, the samples were serotyped. Table 8 illustrates the diversity of Salmonella serotypes detected across different batches and animal species, highlighting the heterogenous nature of contamination sources. Three different serotypes (Ohio, Infantis and Deby) were associated with chicken, while S. Diarizonae was associated with lamb and S. Panama/Huston with pork.
3.6.2. Generic (Indicator) E. coli
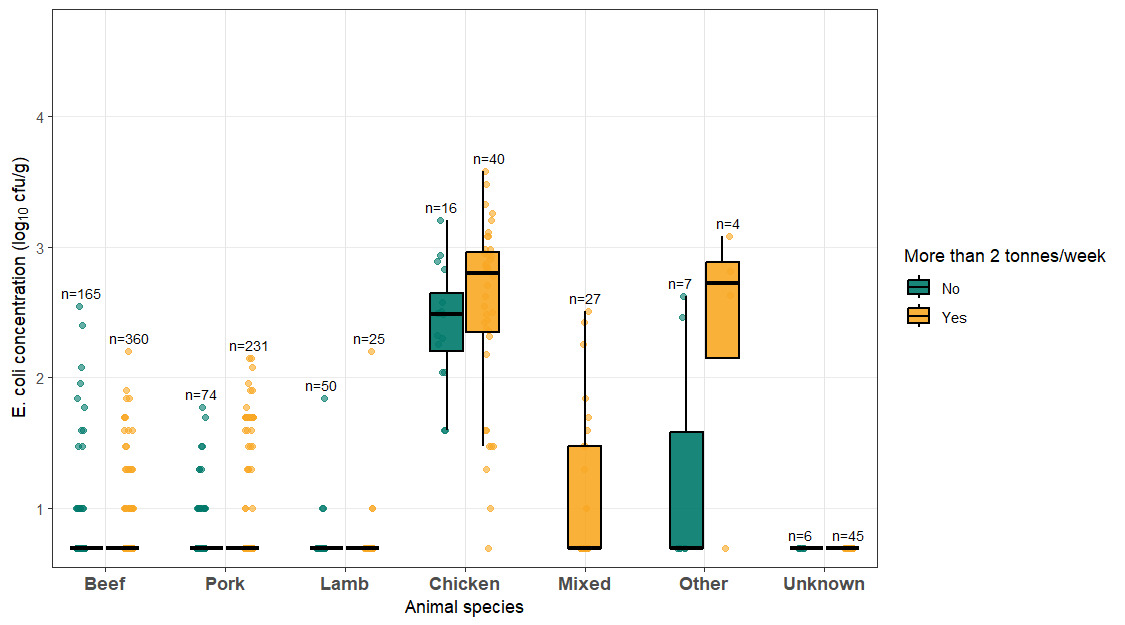
Indicator E. coli counts were determined using ISO 16649-2:2001, a culture-based enumeration method for β-glucuronidase-positive Escherichia coli (Campden BRI, 2018). This method is widely used for the enumeration of generic E. coli in food samples, although it may not detect certain β-glucuronidase-negative strains such as some E. coli O157 isolates. The results can be seen in Figure 1.
A high proportion of E. coli results were censored (Table 10), but the extent of censoring varied substantially across species. Beef, pork and lamb had very high levels of censoring, whereas chicken results were largely uncensored. As a result, a single analysis across all species was not considered appropriate. Instead, the analysis was split into two groups, one for chicken and one for non-chicken, each using their own analysis methodology.
For non-chicken species (beef, pork and lamb), the high proportion of censored results (<10 cfu/g) meant that substituting censored values with numerical estimates, as was done for ACC (3.6.3), was not considered appropriate. Instead, results were analysed as a binary outcome, indicating whether a test result was reported as below the limit of detection (<10) or as a measurable value.
A mixed-effects logistic regression model was fitted with throughput category, species and the throughput by species interaction included as fixed effects, and batch included as a random effect to account for repeated sampling within batches. There was no evidence that the throughput effect differed by species (p=0.942). The throughput by species interaction was not significant (p=0.942). Therefore, no further analysis on the species-specific results was conducted.
For chicken, where censoring was minimal, a mixed-effects linear regression model was fitted to log10-transformed E. coli counts, with throughput included as a fixed effect and batch number as a random effect. This showed no statistically significant difference between low- and high-throughput establishments (p=0.971). Overall, no evidence was found to suggest differences in E. coli outcomes between establishments of different throughputs for any animal species, including chicken. However, because non-chicken and chicken analyses address different outcome measures - probability of results below the LOQ versus differences in measured levels - these findings should be interpreted within the context of their respective analytical approaches. Together these findings suggest that there is no evidence that either smaller or larger establishments had systematically poorer control of faecal contamination at the time of sampling. Exploratory models which include source as a fixed-effect variable did not change any of the statistical conclusions.
3.6.3. Aerobic colony count (ACC)
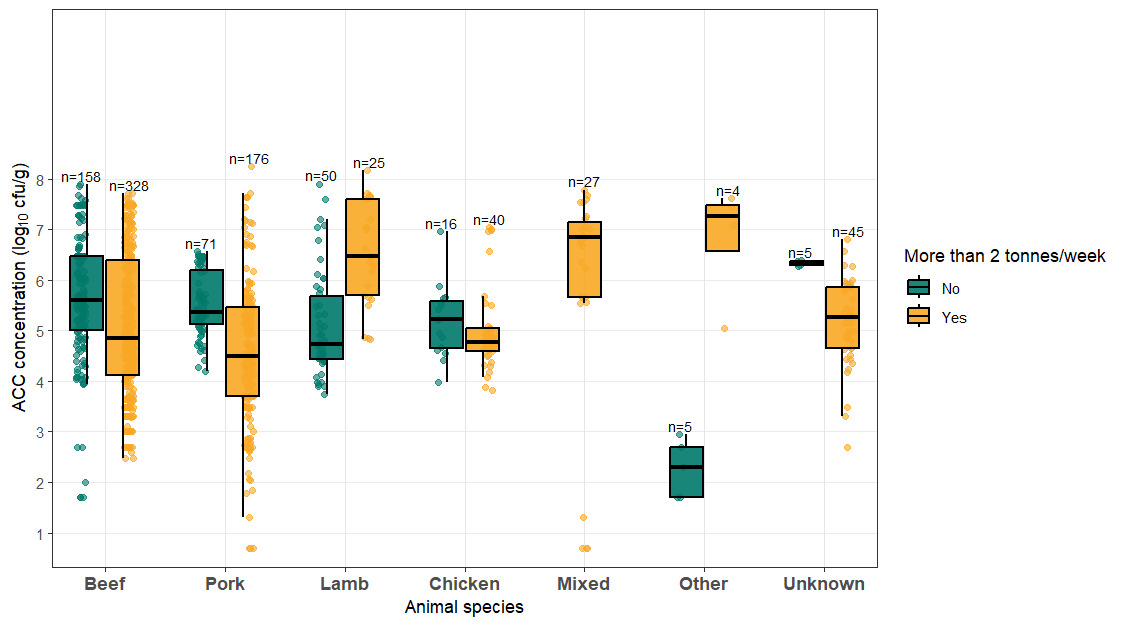
ACC sampling suggested differences in contamination levels between establishment throughput categories that varied by animal species. For beef and pork, higher ACC levels were observed in low-throughput establishments compared with high-throughput establishments. In contrast, lamb samples showed higher contamination levels in high-throughput establishments, while no clear difference was observed between throughput categories for chicken (Figure 2).
A linear mixed-effects model was fitted to log10-transformed ACC results, with source, throughput, animal species (beef, pork, lamb, chicken), and the throughput and animal species interaction included as fixed effects, and batch number as a random effect to account for repeated non-independent samples within batches. There was no overall difference in ACC levels between high- and low-throughput establishments when the results were pooled across species (p=0.822). However, there was strong evidence of a species-specific throughput effect, as indicated by a statistically significant throughput and species interaction (p<0.001). There was also evidence of a source effect (p=0.042) suggesting the ACC levels differed between the two data sources, with levels being higher in the FSA dataset.
Results for the species-specific tests EMMs tests are shown in Table 9.
Sensitivity analysis was conducted by removing censored values and repeating the statistical tests. This assessed whether uncertainty associated with the censored values influenced the results. The conclusions remained unchanged for the throughput effect, throughput and species interaction effect, source effect and most of the species-specific effects. Pork was the only exception where the result changed from statistically significant to non-statistically significant by the removal of censored values (p=0.036 to p=0.275). This suggests that the apparent difference between high- and low-throughput establishments for pork was sensitive to treatment of censored values and was not robust when observations were excluded. This finding may reflect differences in the frequency of non-detected values between throughput groups and/or reduction in statistical power following the exclusion of censored observations.
In summary, ACC levels were higher in low-throughput establishments for beef and pork products, while levels were higher in lamb products from high-throughput establishments. No significant throughput-related difference was identified for chicken. The results suggest that the overall microbial load is influenced not only by the establishment size but also by species-specific processing practices. Although ACCs are not generally considered a direct food safety risk, elevated levels indicate general hygiene or processing issues. Because ACC testing is performed routinely alongside pathogen testing, these findings provide useful context to support a consistent interpretation of the overall microbiological results.
3.6.4. Conclusions on overall results
The microbiological findings showed species-dependent statistically significant differences for ACC. Species-dependent differences were observed for Salmonella spp. as well, albeit these were not statistically significant in this case. No statistically significant differences were observed for E. coli results.
Taken together these findings suggest that any differences between low- and high-throughput establishments for ACC and Salmonella spp. are species specific rather than consistent across all parameters measured. In low-throughput establishments, the detection of Salmonella spp. in pork, lamb and chicken alongside elevated ACC in beef and pork indicates that for certain species these establishments may experience greater challenges related to general hygiene control or environmental contamination. However, E. coli levels were comparable between throughput groups and animal species, suggesting that faecal contamination controls are broadly similar across establishment sizes. In high-throughput establishments, the only Salmonella spp. detections were associated with chicken, while ACC values were higher in lamb - reflecting species-specific risks that may be more strongly influenced by processing complexity and line throughput rather than establishment size alone. Overall, the similarity of E. coli levels across both throughput categories suggests that core hygiene controls are consistently applied, while observed differences in Salmonella spp. and ACC likely reflect variations in species-specific processing steps and mitigations practices rather than a simple effect of throughput.
These interpretations of the findings are subject to uncertainty due to the relatively small number of establishments included in the dataset and the lack of information on how representative the sampled establishments were of their throughput categories, which limits the ability to generalise results across establishment sizes. Similarly, uncertainty arises from the limited number of independent samples underpinning the analysis, which may not adequately represent the variability in microbiological performance within each throughput category.
3.7. Post- processing handling assumptions
For the purposes of this risk assessment, it was assumed that the handling of meat products after they leave the cutting plant is similar regardless of the size of the plant in which they were produced. The assessment therefore assumes a reasonably foreseeable and most likely consumer exposure scenario, with Salmonella spp. contamination at the point of dispatch as a starting point, as Salmonella spp. is the only foodborne pathogen included in this assessment.
This exposure scenario considers consumer purchasing habits, the potential for temperature abuse during transport, storage and handling at a domestic setting, the probability of cross-contamination during meal preparation, typical consumption patterns, population immunity to Salmonella spp. with expected clinical outcomes, and national data on reported Salmonella spp. occurrence in animals. As there is no evidence to suggest that these post-processing factors vary systematically between meat originating from different processing plant sizes, consumer risk is assumed to be directly related to the level of contamination present at the point the product leaves the cutting plant.
In the following sections it is explained why post-processing handling was assumed to be a constant for the purposes of this risk assessment.
3.7.1. Purchasing habits
Wave 9 of Food and You 2 collected information on where and how often participants purchased food. Supermarkets were the most frequently used outlets: 69% of respondents reported purchasing from large supermarkets weekly or more often, 52% from online supermarkets and 49% from mini supermarkets. Independent retailers (e.g. butchers, greengrocers, fishmongers), corner shops, and local/farmers’ markets were used less often, with the majority of respondents shopping at these locations 2-3 times per month or less. Recipe boxes were the least used sources, with 83% of respondents reporting they had never used them (Moore et al., 2025).
While the survey indicates that most people buy their food from large retailers, the information currently available does not allow any conclusions on the onward supply routes of products from low- and high-throughput establishments. An implicit industry assumption appears to be that smaller businesses typically supply local customers (BMPA, 2026.).
3.7.2. Storage, transport to retailers and handling at home
Assimilated Regulation (EC) No 854/2004 and assimilated Regulation (EC) No 853/2004 set minimum standards for hygiene and storage that all approved cutting plants are required to comply with, regardless of establishment size. Therefore, it has been assumed that handling and storage practices at the cutting plant level do not systematically differ between low- and high-throughput establishments (FSA, 2018b).
Although controls throughout farming and slaughter reduce contamination, Salmonella spp. may remain present on raw meat. Persistence of Salmonella spp. contamination has been demonstrated in experimental studies; for example, Chea et al. (2022) showed that despite washing raw chicken carcasses twice, Salmonella spp. contamination remained present in 88.9% of chicken samples.
Several food handling practices therefore aim to slow, rather than eliminate, microbial growth. Temperature abuse during transport, storage, defrosting, or preparation, can allow Salmonella spp. to grow to potentially hazardous levels (Ehuwa et al., 2021; Silva, 2022) and can similarly increase the total microbial load (Necidová et al., 2024). Refrigeration is an important control step and has been shown to reduce Salmonella spp. levels, particularly at lower temperatures, but it does not eliminate the organism (Silva, 2022). Salmonella spp. can survive freezing and resume growth once favourable conditions return (Ayuti et al., 2024).
While these behaviours are consistent across domestic settings, the relevance of temperature abuse may differ for products from smaller establishments, if for example those products are distributed via shorter or local routes such as direct sales or farmer’s markets, where time-temperature controls may be more variable than in large supermarket distribution systems. However, due to lack of information on post-cutting distribution routes, transport and storage conditions by establishment size, those parameters were treated as a constant in this assessment.
3.7.3. Probability of contamination during meal preparation
Research shows that poor domestic hygiene practices during food preparation substantially increase the risk of microbial cross-contamination. Salmonella spp. and other pathogens have been shown to transfer to kitchen surfaces and utensils including cutting boards, knives, and hands after handling chicken or vegetables (Bai et al., 2021; Cardoso et al., 2021; Chea et al., 2022; Lai et al., 2023; Luber et al., 2006; Møretrø et al., 2021). For example, researchers showed that using the same utensils for raw chicken and ready-to-eat (RTE) foods, particularly when vegetables were washed first, resulted in significantly higher contamination of ready-to-eat chicken salad (Cardoso et al., 2021; Luber et al., 2006). Such findings highlight how utensil handling strongly influences pathogen transfer during food preparation (Bai et al., 2021; Chea et al., 2022). Even the handling of cooking ingredients such as salt can act as an unexpected vehicle of cross-contamination; in an artificially contaminated experiment, Salmonella enterica and Listeria monocytogenes were isolated from nearly all salt and seasoned lettuce samples, and both pathogens survived in low moisture salt for over four months (Alves et al., 2022).
Collectively, these studies demonstrate that inadequate hygiene practices that include using the same utensils for raw meat and RTE foods, contaminated surfaces, and improper handling of ingredients, significantly increase the likelihood of pathogen transfer during meal preparation (Alves et al., 2022; Chea et al., 2022; Møretrø et al., 2021).
While these practices significantly influence individual consumer risk, there is no evidence that they occur differently, depending on the processing plant size from which the meat originates. Accordingly, cross-contamination during meal preparation is included as part of the exposure pathway but it is assumed to contribute similarly across all plant-size categories.
3.7.4. Consumption
Consumption data from the Diet and Nutrition Survey of Infants and Young Children (DNSIYC) (DH, 2013) and the National diet and nutrition survey (NDNS) years 1-11 (B. Bates et al., 2014, 2016, 2020; Roberts et al., 2018) were used to characterise population consumption patterns of minced meat products.
Across all age groups, pork minced frequency of consumption was low, not exceeding 5.4% of consumers with the most frequent consumption reported among children aged 4-10 years. The frequency of beef minced consumption was considerably higher, ranging from 30% to 49%, with the most frequent intake reported among children aged 4-10 years (49%) and teenagers (48%). The frequency of lamb minced consumption remained low (3.2% to 5.8%) across all age groups, while the frequency of poultry minced consumption was very low, compared to other minced meat, generally not exceeding 1.7%.
Table 11 and Table 12 present mean and 97.5th percentile consumption estimates for pork, beef, lamb, and poultry minced meat. Chronic consumption values (Table 11) are expressed as grams per person per week for all standard age groups, considering data on a weekly basis is likely to be a conservative approach. Acute consumption values (Table 12) are expressed as grams per person in a day as they are based on acute maximum day calculations.
Across all four meat types, consumption increased steadily from infancy through adulthood, with adults aged 19-64 years showing the highest consumption under both chronic (regular/long term ingestion) and acute (maximum consumption during the survey period) consumption scenarios. Older adults (65+ years) showed slightly lower but still substantial consumption levels. Beef and lamb minced generally showed the highest consumption levels across age groups, while poultry minced contributed the least to overall exposure on the basis of consumption frequency.
Consumption estimates derived from NDNS and DNSIYC were based on relatively small numbers of consumers. When the number of consumers is less than 60 (fewer than 60 consumers for: pork minced: infants, toddlers; and poultry minced: toddlers), this should be treated with caution and may not be representative at a population level.
Chronic data in g/person/week included in Table 11 was multiplied up from the data per day, considering data on a weekly basis is likely to be a conservative approach. Acute data has been calculated as the maximum consumed in one day across all days on which consumption was recorded in the survey. As this represents short-term exposure, it has not been multiplied up to a weekly conversion. Values were from daily consumption estimates and are expressed as weekly intakes. For each meat type and age group, results are presented as mean/97.5th percentile for chronic (g per person per week) and acute (g per person in a day) consumption. Data are provided for the standard age groups.
3.7.4.1. Consumption of undercooked products
Because the risk associated with Salmonella spp. in minced meat is strongly influenced by cooking practices, additional NDNS data on consumption of undercooked burgers were considered. The NDNS (2019-2023) survey reported the proportion of respondents who consumed rare beef burgers or/and rare burger & other meat (burgers made from non-beef meats), in the past 12 months. No equivalent data were available for infants, as this information was not collected in the DNSIYC survey (2011) (“NDNS 2019 to 2023,” 2025a). (“NDNS 2019 to 2023,” 2025a) presents the percentage of respondents reporting consuming rare burgers or other meats.
Overall, consumption of undercooked beef or other pink/red meats was uncommon and mainly observed in adults, particularly males aged 19-64 years. Across the population, 8% reported eating rare beef burgers and 2% reported eating rare non-beef meat burgers (“NDNS 2019 to 2023,” 2025a).
Findings from Wave 9 of Food and You 2 survey were consistent with these results. Consumption of sausages when pink was unusual, with 94% of respondents reporting they never ate sausages in this state and only 5% reported occasional consumption. In contrast, consumption of pink or undercooked beef burgers was more frequent, with one third reporting occasional consumption (Moore et al., 2025). This behaviour was most prevalent among adults aged 25-34 (54%) and declined with increasing age (Moore et al., 2025).
3.7.4.2. Cooking guidance and risk mitigation
The FSA recommends that meats including minced or skewered meat are thoroughly cooked, with the centre of the food reaching at least 70 °C for 2 minutes or the following temperature-time combinations: 60 °C for 45 minutes, 65 °C for 10 minutes, 70 °C for 2 minutes, 75 °C for 30 seconds, 80 °C for 6 seconds (FSA, 2024b). This advice reflects the increased risk associated with minced meat, as grinding redistributes surface bacteria throughout the product. Therefore cooking food thoroughly is required to kill any foodborne microorganisms that might be present in the food (FSA, 2024b).
4. Hazard characterisation
4.1. Salmonella spp.
Typical symptoms of Salmonella spp. infection can vary from asymptomatic carriage to symptoms that include abdominal pain and diarrhoea, sometimes accompanied by vomiting, nausea, fever, chills, muscle or joint pain, cramps, and reduced appetite (Chlebicz et al., 2018). After symptoms resolve, carriage may persist for up to 4 weeks in adults and 7 weeks in children. However, some people including young children less than 5 years of age, adults aged 65 years and older, or those with weakened immune systems, are at higher risk of developing more severe illness or longer-term complications(UKHSA, 2025b).
The incubation period ranges from 6-72 hours, depending on dose and host factors, and illness typically resolves within 7 days (Chlebicz et al., 2018; Eikmeier et al., 2018). The infectious dose can vary widely, usually falling between 106-108 cells, but in highly susceptible individuals, as few as 10 cells may trigger disease (Chlebicz et al., 2018). The presence of Salmonella spp. in food (especially high in high fat content) is particularly hazardous to children and other high-risk populations, as these foods can protect the pathogen. during passage through the stomach. Even low doses (perhaps as few as 10 to 100 cells) pose a significant risk to health (Podolak et al., 2010).
4.1.1. Salmonella spp. in livestock
Recent surveillance data by APHA (2025) indicate mixed trends in Salmonella spp. detection in livestock in GB. In 2024, isolations decreased in cattle (by 16% from 2023 and 14.9% from 2022) but increased in sheep (up 3.1% from 2023 and 7.4% from 2022), and pigs (up 20.5% from 2023 and 45.3% from 2022) from already elevated levels. In chicken, Salmonella spp. isolations dropped in chickens (down 25.5% from 2023 and 18.4% from 2022) and remained stable in turkeys compared with 2023, though well below 2022 levels. No isolations were recorded in game birds in 2024 (APHA, 2025). Across all animal isolates examined, 73.3% showed full susceptibility to 16 tested antimicrobials, unchanged from 2023.
4.1.2. Human Salmonellosis
The IID2 study (2008-2009) reported a substantial decline in Salmonella spp. intestinal disease (IID) presenting to general practice, with an incidence of 0.2 cases per 1,000 person years, representing an eightfold reduction compared with IID1 (1993-1996) and accompanied by a more than fourfold decrease in national surveillance reports (Tam et al., 2011).
In 2024 confirmed human Salmonella spp. infections in the UK increased, reaching a decade high with a 17.1% rise compared with 2023, increasing from 8,872 to 10,388. Children under 10 years of age represented a substantial proportion of cases (21.5%) (UKHSA, 2025a). The most frequently reported serovar was Salmonella Enteritidis (16.8% increase). Salmonella Typhimurium was the second most commonly reported serovar (15.2% increase) (UKHSA, 2025b).
In summary, despite earlier long-term declines more recent data indicate a reversal of this trend. Additionally, although Salmonella spp. isolations declined in some livestock sectors in recent years, human infections increased in the same period. These findings illustrate that livestock surveillance trends alone are insufficient to explain patterns of human infection, as transmission is shaped by multiple intermediary stages including, processing, distribution and consumer handling.
4.1.3. Salmonella serovars detected in the sampling survey
The severity of illness associated with Salmonella spp. is recognised to vary by serovar, host susceptibility and dose (Cheng et al., 2019; Colin et al., 2025; WHO, 2018). The Salmonella spp.-positive samples that were identified during the sampling survey used in this assessment included S. Diarizonae, S. Ohio, S. Infantis, S. Derby, and S. Panama/Houston. These serovars differ in their epidemiology and public health significance.
Some of the detected serovars are generally associated with lower public health impact. S. Diarizonae, while common in sheep, is rarely implicated in human infection and is largely confined to high-risk groups, which suggests minimal public health impact and supports risk management exemptions in some countries (Gerlach et al., 2017; Uelze et al., 2021). Similarly, S. Ohio is an infrequent zoonotic pathogen, typically associated with enterocolitis and only rarely linked to extraintestinal disease (Kato et al., 2012).
In contrast other serovars identified in the survey can be of greater concern. S. Infantis is an emerging concern of increasing global prevalence in chicken and is frequently associated with multidrug resistance in broiler-derived isolates (Mattock et al., 2024). Derby is a widely distributed, host-generalist serovar commonly associated with swine and chicken, capable of causing both self-limiting gastroenteritis and, less commonly, invasive disease, with growing concerns regarding antimicrobial resistance (Wang et al., 2026).
S. Panama, although an uncommon cause of gastrointestinal illness, is notable for its increased propensity for invasive and extraintestinal infections, with 7% of isolates in England recovered from non-gastrointestinal sites compared with 2-3% for S. Typhimurium and S. Enteritidis (Pulford et al., 2019).
Collectively, these findings demonstrate variability in pathogenicity, host association, and antimicrobial resistance profiles among the serovars detected. This diversity introduces uncertainty in the characterisation of the severity of detriment.
4.1.4. Risk factors for severe Salmonellosis outcomes
Severe Salmonella spp. infections, including both enteric fever and invasive non-typhoidal Salmonella spp. (iNTS) disease, remain major contributors to global morbidity and mortality, particularly in regions with high burdens of infectious disease (Shi et al., 2025).
Research demonstrates that host genetic factors play an important role in shaping susceptibility to Salmonella spp., largely through their influence on innate and adaptive immune responses (Aribam et al., 2016; Bhimani et al., 2025; Gilchrist et al., 2015; Griffin et al., 2011). Turgeon et al. (2017) highlight the disease burden experienced by vulnerable populations (seniors) in Canada, reporting that seniors make up 50% of non-typhoidal Salmonella spp.-related hospitalisation and 82% of deaths (Turgeon et al., 2017). They also recorded longer hospital stays among elderly individuals (7 days) than other adults (4 days). Teklemariam et al. (2023) provided an extensive review demonstrating that disease severity is strongly influenced by the infecting serotype, the host’s underlying health status, and the presence of multidrug resistant (MDR) strains. The rise of MDR Salmonella spp. complicates clinical management and amplifies the public health impact of infections, particularly in vulnerable groups (Teklemariam et al., 2023). While non-typhoidal Salmonella spp. typically causes self-limiting gastroenteritis in immunocompetent individuals, MDR variants are associated with more severe and more frequent fatal infections (Teklemariam et al., 2023).
In summary, host susceptibility to Salmonella spp. is dependent on genetic and demographic factors; clinical severity is exacerbated by antimicrobial resistance; and protective immunity requires coordinated cellular and humoral responses. These studies inform understanding of disease mechanisms and highlight that infection outcomes vary widely across individuals.
4.1.5. Disease attribution
In the reporting period 2024/25, a total of 269 incidents involving meat and meat products (other than chicken), and 111 incidents involving chicken meat and chicken products, were reported to the FSA, out of total of 1,825 food incidents. In the same period, 20 meat and meat products (other than chicken) and five incidents involving chicken meat and chicken products were reported to the FSS, out of total 125 food incidents reported overall. These figures include incidents associated with all reported pathogens.
Additionally, foodborne infections associated with meat are documented by frequent outbreaks (Gormley et al., 2011). Meat-related foodborne outbreaks are most caused by Salmonella spp., Shiga toxin-producing E. coli, and Campylobacter, with minced or ground beef, chicken meat, and processed meat products frequently implicated.
4.2. Aerobic colony count (ACC)
The aerobic colony count (ACC), also known as the total viable count, is an indicator of the overall microbiological quality of a product rather than safety, and cannot generally be used alone to assess the presence or absence of foodborne hazards (UKHSA, 2024). Elevated ACC values are unlikely to directly cause disease in consumers; however, they provide contextual information on the hygienic conditions under which meat has been processed, handled or stored.
In the context of hazard characterisation, ACC results can signal underlying issues such as inadequate hygiene practices, poor temperature control, prolonged storage or reduced shelf life. For this reason, ACC testing is often done alongside pathogen testing in labs, and it is used to support consistent interpretation of overall microbiological findings (UKHSA, 2024). However, ACC levels exceeding the guideline thresholds cannot, on their own, justify product recalls or legal action; instead, they should be used to highlight possible weaknesses in food processing, preparation, storage, or shelf life (UKHSA, 2024). Therefore, within this assessment, ACC results are used to contextualise Salmonella spp. results, which is the only pathogen in scope, i.e., ACC results were used to provide general context on overall hygiene and microbial levels when interpreting Salmonella spp. findings.
4.3. Generic (Indicator) Escherichia coli
Generic E. coli is used in food microbiology as an indicator of faecal contamination, rather than a direct measure of consumer health risk. While their detection alone does not necessarily indicate that a food product is unsafe, it usually signals a breakdown in food safety controls and an increased likelihood that faecal pathogens may be present in the product. Detection of E. coli therefore raises concerns about potential contamination (UKHSA, 2024).
Evidence supports the association between the detection of E. coli with detection of foodborne pathogens. For example, McLauchlin et al. (2018) reported that for all samples investigated in their research (curry, betel and banana leaves), where Salmonella spp. was detected, unsatisfactory or borderline levels of E. coli were also found, with significant association between the presence of Salmonella spp. and increasing levels of E. coli (P<0.001; OR=1.72, 95% CI 1.31–2.25) (McLauchlin et al., 2018).
Therefore, within this assessment, generic E. coli results are used to contextualise Salmonella spp. results, which is the only pathogen in scope.
5. Risk characterisation
The aim of this risk assessment was to evaluate the difference in microbiological risk to consumers from minced meat and meat preparations intended to be cooked, from establishments producing less than two tonnes per week (low-throughput), which are currently exempt from the specified microbiological sampling in assimilated Regulation (EC) No 2073/2005 (and Regulation (EC) No 2073/2005 in Northern Ireland). Risk from these low-throughput establishments was compared with that from establishments producing more than two tonnes per week (high-throughput), which are required to undertake routine microbiological sampling.
The assessment was based on sampling data from an FSA surveillance project and FBO data available to FSS. Testing results were available for the presence or absence of Salmonella spp., and levels of indicator E. coli and ACC.
Sections 5.1, 5.2, 5.3 below outline the rationale for the characterisation estimation of the risk (likelihood of occurrence) in Section 5.4, the uncertainty associated with it and the estimation of severity of disease.
5.1. Sampling results and statistical analysis
Salmonella spp. positive samples were more frequently reported in low-throughput compared to high-throughput establishments when results were pooled across all animal species, with failure rates of 4.5% and 1% respectively, although this result was not statistically significant (Fisher’s exact test, p=0.068). Additionally, the estimated odds of Salmonella spp. batch failure were approximately 4.8 times higher in low-throughput establishments than in high-throughput ones (OR=4.82). However, due to the low failure rates, the corresponding 95 % CI (0.68 to 54.16) was very wide and included 1, which indicates uncertainty and no statistically significant difference between throughput groups.
No statistically significant difference was found for indicator E. coli between establishments of different sizes as defined in this assessment. Finally, while there was no overall significant difference between low- and high-throughput establishments on ACC levels, species-specific differences were detected: higher ACC levels were recorded in beef and pork products from high-throughput establishments, but lower in lamb products (not statistically different). No statistically significant difference was observed for chicken products.
When considered together, the ACC and indicator E. coli results suggest that differences observed in overall microbial loads (ACC) are not mirrored by corresponding differences in faecal contamination indicators. This pattern is consistent with the interpretation that elevated ACC levels, where observed, were more likely driven by general hygiene, process or storage control failures rather than failures in faecal contamination controls. The absence of throughput-related differences in indicator E. coli supports conclusions such as that core hygiene barriers relevant to pathogen introduction, particularly those linked to gut-derived contamination, were broadly similar across establishments of different sizes. Any species-specific differences in ACC levels between establishments of different sizes are likely to reflect differences in the processing steps and risk mitigation measured implemented by those establishments.
Sampling itself does not directly reduce public health risk. Any public health risk is minimised only when unsatisfactory process hygiene criteria (PHC) results lead to the implementation of appropriate corrective actions by food business operators. Such actions may include the evaluation of monitoring data over time to identify adverse patterns, followed by process improvements intended to reduce future contamination levels. In establishments exempt from testing, no equivalent trigger is present, although interventions may still be implemented for other operational reasons, for example following process modifications, identification of hygiene or equipment issues, internal reviews, or outcomes of official inspections. Implementation of PHC requirements, as described in the legislation may also be tightened or revised in response to outbreaks, rising disease incidence, and public health concern.
5.2. Consumption and handling of products after dispatch from the cutting plants
Consumption patterns vary by both animal species and age group, with consumers of all ages consistently reporting more frequent beef minced consumption compared to products from other animal species, reflecting its relatively high consumption across much of the population. In contrast, poultry minced consumption is very low compared with other minced meats and therefore contributes minimally to overall exposure. Whilst consumption of undercooked minced meat products does occur, it is uncommon and it largely confined to certain adult sub-groups.
Factors such as cross-contamination during food preparation and temperature abuse during transport storage or handling can increase microbial growth, but there is no evidence to suggest that these consumer level behaviours differ systematically according to the size of the cutting plant of origin. As a result, these factors were treated as a constant in this comparative risk assessment.
Importantly, adequate cooking (core temperature to 70 °C for at least two minutes or equivalent) is sufficient to eliminate microbial cells present in food, pathogenic or otherwise.
5.3. Incident and outbreak data
Livestock surveillance data indicate heterogeneous trends in Salmonella spp. occurrence across animal species and despite general decline in prevalence in recent years, human salmonellosis cases show an increasing trend. These trends suggest that mitigations successfully implemented at the primary production level do not necessarily translate into a reduction in the burden of disease. As FSA and FSS incident data indicate, meat and meat products remain prominent in food safety incidents and outbreak investigations, with such products frequently implicated, reflecting their susceptibility to contamination and the opportunities for bacterial growth and cross-contamination along the supply chain.
5.4. Overall risk characterisation
On the basis of the available data considered in this risk assessment, there was insufficient statistical evidence to demonstrate a difference in the per-portion likelihood of microbiological exposure of UK consumers to Salmonella spp. from minced meat and meat preparations intended to be eaten cooked, originating from UK cutting plants producing less than two metric tonnes per week, in comparison to those producing more than two metric tonnes. However, the low number of positive Salmonella spp. samples and failing batches resulted in substantial uncertainty and limited statistical power, meaning that a true difference in risk between throughput groups cannot be excluded. The uncertainty associated with this risk characterisation is High.
Statistically significant species-specific differences were detected for ACC contamination, an indicator of hygiene or temperature process failures. However, those did not translate into a consistent overall throughput size effect, i.e., while contamination levels differed by animal species, there was no clear pattern showing that either size plants consistently had higher or lower contamination. These results are more likely to reflect species-specific processing steps and variability in operational practices, rather than a consistent effect of establishment size. E. coli levels were broadly comparable between throughput groups and species, indicating that controls of faecal contamination appear similar across establishment sizes.
It should be noted that this is an assessment of the relative risk between high- and low-throughput cutting plants and does not represent an assessment of the risk to UK consumers from minced meat and meat preparations as a product category or from cutting plants as a sector.
The uncertainty is primarily driven by the limited availability of data and the low Salmonella spp. detections, which also resulted in statistical uncertainties as highlighted in previous sections and in Section 6. The uncertainty also lies around the sampling differences between data sources as well as number of establishments included in the datasets.
The severity of detriment of salmonellosis is considered to be Low for the general population and Medium for vulnerable groups (as described in 4.1.1). Due to the range of serovars detected in the survey underlying this risk assessment, which are associated with different clinical outcomes, the uncertainty on the severity of detriment is Medium.
For the definitions of risk, uncertainty and severity characterisations, please see the Annex.
6. Uncertainties
The conclusions of the risk assessment are subject to several sources of uncertainty, which are ranked below in order of their potential to influence the final risk characterisation. Those most likely to alter the outcome, if further information became available, are listed first.
With potential to change the conclusions:
-
Low levels of Salmonella spp. positive samples and failing batches in both low- and high-throughput establishments resulted in limited statistical power to detect differences between the groups. Only six batch failures were observed, resulting in wide confidence intervals and uncertainty around the estimated effect size. Although no statistical significance was observed, this may reflect insufficient sample size rather than true equivalence of risk.
-
It is not known whether the sampled establishments included in this assessment are representative of their size categories; however, this has been an implicit assumption throughout.
-
The datasets used in this assessment were collected through different sampling mechanisms. FSA data were obtained through unannounced official sampling, whereas FSS data included results of FBO self-sampling. The two datasets also differed in their distribution of data across species and establishment sizes.
-
The lack of comprehensive information on the total throughputs by cutting plant, and their association with total UK throughput, limits the ability to fully characterise representativeness of establishments by size.
With potential to influence interpretation of results:
-
Any differences in processes, product handling or mitigations between establishments within each of the size categories has not been recorded and was not available for the assessment, and this may account or mask for some of the variability that might otherwise be explained.
-
The FSA surveillance sampling on which this risk assessment was partly based was carried out over a 6-week period during autumn only. As a result, the findings did not capture seasonal variation in contamination levels, production practices or pathogen prevalence.
-
Not all sampling events (datapoints) included complete metadata and multiple batch sampling was reported in many cases. In addition, censored data (observations where the exact value is only partially known, either because it falls above, below, or within a certain range) were handled using predefined assumptions.
With potential to influence biological interpretation and measurement accuracy
-
Data on sampling times was limited and when available not varied enough to include in the analysis. This limitation did not allow us to investigate the contamination levels in production lines throughout the day and whether the contamination increases or not with the volume of product processed.
-
The sampling and testing methodologies for the FBO self-testing results provided by FSS could not be confirmed.
-
Pathogens like Salmonella spp. may be unevenly distributed within batches, particularly in minced meat. As a result, sampling may fail to detect contamination when present elsewhere, especially so when the contamination is low.
With potential impact on context:
-
For E. coli, non-chicken species were analysed using a binary outcome (<10 cfu/g vs measurable values), whereas chicken data were analysed using measured log-transformed E. coli counts. Although both assess potential differences between low-throughput and high-throughput establishments, they answer slightly different questions and should not be directly compared.
-
The lack of data on post-cutting transport and storage conditions by establishment size, as products from less than two tonne establishments may enter shorter or less standardised supply chains (e.g. direct sales or farmers’ markets) where time-temperature control may differ from large retail distribution systems.
-
While reasonable assumptions were made when the decision was made to handle post-plant handling as a constant, any potential differences in variables such as distribution conditions and duration or logistics have not been examined/measured. For example. it could not be quantified how much of the products originating from low- or high-throughput establishments are distributed to large vs smaller retailers.
-
Consumption estimates derived from NDNS and DNSIYC were based on relatively small numbers of consumers. When the number of consumers is less than 60 (fewer than 60 consumers for: pork minced: infants, toddlers; and chicken minced: toddlers), this should be treated with caution and may not be representative at a population level.
-
Surveillance data for venison and game were limited or not available and therefore only animal species such as beef, pork, lamb and chicken were analysed and discussed in this risk assessment.
7. Future research Recommendations
-
A surveillance of common practices in the processing of different animal species in UK cutting plants would be beneficial to identify possible reasons for the species-specific differences observed in the data used for this risk assessment.
-
Further structured surveillance incorporating longer sampling periods and sample sizes powered to detect differences between animal species would improve statistical power and reduce uncertainty. This would increase confidence in detecting or excluding meaningful differences in Salmonella spp. risk between throughput groups and by species.
-
Further research is recommended to investigate whether observed species-specific differences in aerobic colony counts across establishment sizes are driven by differences in processing steps and the presence or absence of specific risk mitigation measures.
-
This risk assessment was based on a relatively small number of establishments included in the dataset, with a lack of comprehensive information on the overall throughput of UK establishments by throughput category. A data collection exercise to build a more comprehensive picture of what is produced and marketed within the UK would support future risk assessments.
Acknowledgements
We would like to thank the Food and You team as well as Exposure Assessment Team (EAT) within the FSA, for providing data from Wave 9 of Food and You 2 and consumption data from NDNS and DNSIYC.