


1. Introduction
In the last few years, wastewater-based epidemiology has emerged as a useful tool and indicator for community infections and pathogen prevalence, to support the more traditional clinical surveillance (Doss et al., 2025). Wastewater surveillance enables the detection of pathogens at population level, from symptomatic and asymptomatic individuals, offering an alternative for tracking pathogen circulation, identification of emerging threats, and monitoring trends over time. Furthermore, during COVID-19 pandemic, several SARS-CoV-2 variants were detected in sewage, correlating with those found in clinical specimens supporting wastewater surveillance as a complementary tool (Li et al., 2022). The relevance of wastewater monitoring has been also highlighted in 2022, when circulating poliovirus (PV) was detected in London sewage in the absence of symptomatic cases, emphasising the importance of this surveillance (Klapsa et al., 2022).
Focussed on collecting data on foodborne pathogens present in wastewater, the PATH-SAFE project leveraged on the existing wastewater screening programme organised by UKHSA to support PV surveillance following detections in 2022. The waterwork network has been stablished considering demographic requirements for PV monitoring, including vaccination coverage and high-risk communities (UKHSA, 2025a). The PATH-SAFE project was initiated in April 2024, for a period of 12 months, raw (pretreatment) wastewater materials were processed by NHS Lothian for the UKSHA PV surveillance as well as for the PATH-SAFE project. The materials were screened for 5 foodborne pathogens using real-time PCR. The pathogens tested were Campylobacter spp. (C. jejuni and C. coli), Salmonella spp., and Shigella spp., Shiga toxin-producing Escherichia coli (STEC), and norovirus (NoV).
Campylobacter spp. is one of the leading causes of bacterial gastrointestinal disease. It is usually transmitted through contaminated or uncooked chicken, and infection with Campylobacter can cause diarrhoea, fever and stomach pain, however vulnerable patients can develop severe illness and complications (UKHSA, 2025b). Salmonella spp. is also transmitted through contaminated food, including poultry, meat, eggs, raw fruit or vegetables, and unpasteurised milk products. Shigella spp. is transmitted through the oral-faecal and sexual routes, and the infection also causes enteric symptoms. Escherichia coli (E. coli) infections can be harmless to humans or manifest through gastrointestinal symptoms, however there are strains that can cause severe illness. STEC O157 strain can cause serious gastrointestinal illness, particularly in vulnerable patients infected with this strain, including a serious life-threatening condition, haemolytic uraemic syndrome which can result in kidney failure (Byrne et al., 2020). NoV infection is the leading cause of gastrointestinal disease in the UK affecting a wide demographic. NoV outbreaks have been reported to cost society an estimated £1.7 billion and the NHS £115 million per year (FSA, 2020; Lopman et al., 2004; Sandmann et al., 2017). The economic impact of NoV infection stresses the importance of strong NoV surveillance.
Further characterisation was undertaken for NoV, a genetically diverse group within the Caliciviridae family. Classification is based on the sequence of two genes (dual classification), NS7 and ORF2, encoding the RNA-dependent RNA polymerase (RdRp) and the capsid protein (VP1). NoV can be grouped into ten different genogroups (GI-GX), which can be further divided into genotypes denoted by a number (e.g., GI.1). Relevant to humans are genogroups I, II, IV, GVIII and GIX (Chhabra et al., 2019), however most strains in human infections belong to genogroups GI and GII, with GII.4 genotype accounting for the majority of outbreaks of gastroenteritis until recently (Chhabra et al., 2024).
The aim of this study is to produce a dataset of foodborne pathogen detections through wastewater surveillance around the UK using molecular screening for gastrointestinal pathogens over one year.
2. Methods
2.1. Part I: pathogen detection
2.1.1. Sewage materials
Sewage samples from 32 sewage treatment work locations were processed: Canvey Island, Newcastle Howdon, Blackburn, Bury, Davyhulme, Birmingham Minworth, Leicester Wanlip, Nottingham Stokebardolph, Liverpool, Preston Cliff March, Salford, Bradford Esholt, Leeds Knostrop, Sheffield Blackburn Meadows, London Beddington, London Hogsmill, London Riverside, Luton East Hyde, Maple Lodge, London Long Reach, Dalmarnock, Daldowie, Paisley, Shieldhall, Levenmouth, Meadowhead, Seafield, Nigg, Dalmuir, Hatton, Peacehaven and Shoreham (UKHSA, 2025a).
Sewage samples were taken at the inlet point in the process, before any treatment (raw influent), including grab (taken at a single point of time) and composite (multiple grab samples pooled into a single sample) materials.
2.1.2. Concentration of raw wastewater and subsequent extraction from the supernatant fraction
For each 500ml raw wastewater sample, 30ml was aliquoted into 2 conical tubes and spun down for 10 minutes at 2000xg at 4°C. The resulting pellet was stored (see next section) and the supernatant was decanted into a Thermo Scientific Nalgene Rapid-Flow 0.45μm Filter unit attached to the Fisher Scientific Filtration Vacuum Pump until the sample has passed through (filtrate). Vivaspin 20 (Sartorius, 10,000 MWCO) Centrifugal Concentrator were pre-rinsed with 20ml of molecular grade water. The filtrate (approx ~60ml) was passed through the Vivaspin 20 filter unit by centrifugation for 16 minutes at 4000xg and 4oC. The concentrated sample were pooled, extracted using QIAmp Viral RNA Kit according to the manufacturers’ instructions and eluted in 35μl AVE buffer.
2.1.3. Processing of wastewater pellet and total nucleic acid extraction
The pellet fractions for a small number of samples, was resuspended in 1ml phosphate buffered saline (PBS), spun down at 15,000xg for 5 minutes and the supernatant removed. The pellets were then stored at -80°C until processing. To extract the nucleic acid from the wastewater pellets, MagMAX™ Microbiome Ultra Nucleic Acid Isolation Kit (Applied Biosystems) was used. Briefly, each pellet was resuspended in 1ml of lysis buffer supplemented with 200μl of proteinase K before extraction on a Kingfisher Flex using MagMAX_Microbiome_Flex24_Wastewater.
2.1.4. Real-time PCR detection assays
Primer and probe sequences for all assays are detailed in Table 1 and the methodology outlined below for the individual assays. Prior to amplification, the extracts were spiked with phocine human herpes virus (PhHV) at a pre-determined concentration as amplification internal control.
2.1.5. Campylobacter spp. (Campylobacter jejuni and Campylobacter coli) and Salmonella spp. real-time PCR
A mastermix containing 10µl Express SuperScript qPCR Supermix (Invitrogen) and the Salmonella spp. primers (0.3µM each) and probes (0.2µM each), Campylobacter spp. primers (0.5µM each) and probes (0.3µM each) and the PhHV primers (0.3μM each) and probes (0.1μM each) was prepared. 8μl of wastewater extract was added to the reaction. Amplification conditions were 95°C for 20s then 45 cycles of 95°C for 3s, 60°C for 30s.
2.1.6. Shigella spp. real-time PCR
A mastermix containing 10µl Express SuperScript qPCR Supermix (Invitrogen), the Shigella spp. primers (0.125µM each) and probes (0.625µM each) and PhHV primers (0.3μM each) and probes (0.1μM each), and 8μl of extract was added to the mastermix. Amplification conditions were as described above.
2.1.7. Norovirus genogroups GI and GII real-time RT-PCR
The NoV detection assay used in this project was based on a published assay (Kageyama et al., 2003). Briefly, a mastermix containing 10µl Express SuperScript qPCR Supermix and 2μl Superscript (Invitrogen) was prepared, containing the primers (0.4µM each) and probes (0.08µM each) and 6μl of extract was added. Cycling conditions were 50°C for 15m, 95°C for 20s followed by 45 cycles of 95°C for 3s, 60°C for 30s.
2.1.8. Multiplex real-time PCR assay for detection of Escherichia coli O157:H7 and screening for non-O157 Shiga toxin-producing E. coli
A multiplexed real time qualitative assay, previously developed by the Scottish E. coli Reference Laboratory (SERL) was used to detect the following gene targets: shiga toxin 1 (stx1), shiga toxin 2 (stx2, including the stx2f variant), rfb gene (which is specific for O157) (Holland et al., 2000) and PhHV as the amplification control. A mastermix containing 2X Quantitect Multiplex PCR reagent (Qiagen) and 0.2µM and 0.1µM for each of the primers and probes respectively was prepared. 2µL of the extract was added and the amplification performed using cycling conditions: 95°C for 15m then 45 cycles of 95°C for 15 s, 60°C for 1m.
2.2. Part II: Norovirus genotyping
2.2.1. Wastewater samples and control materials
Of the 287 samples from which NoV GI and GII were detected, 18 samples lacked enough remaining extracts to attempt sequencing, and 3 were excluded from the study due to low concentrations after PCR amplification. As a result, there were 272 materials (266 wastewater samples and 6 controls) for which sequencing was attempted.
Control material was sourced from the National Collection of Pathogenic Viruses. NoV GI (RMNOROG201) and GII (RMNOROG2) Lenticules© were reconstituted following manufacturer’s instructions and single-use aliquots prepared to avoid freeze-thaw cycles. The copy number of NoV genomes in each preparation is estimated as: 6.4 x 10³ - 1.1 x 10⁴ per ml (average 8.7 copy/ml) for GI and 1.5 x 10³ - 4.6 x 10³ per ml (average 3 copy/ml) for GII. An in-house real time-PCR detection assay resulted in Ct values of 32.6 and 30.3 respectively.
A known and well-characterised NoV positive sample was also used as control material for the validation and training stages.
2.3. Inhibitor removal and RT-PCR amplification
The samples were analysed as described by Scott et al., 2024 (Scott et al., 2024). The procedural methods are publicly available (https://www.protocols.io/view/long-amplicon-nanopore-sequencing-for-dual-typing-di2r4gd6). Briefly, the 25µl of extracted viral RNA was purified using Mag-Bind® Total Pure NGS beads (Omega Bio-tek Inc.) and cDNA was synthesised using 10µl of the extracts and 2.5 µl LunaScript® RT SuperMix Kit (New England Biolabs). 5µl of cDNA was used as template for amplification in two separate PCR reactions for GI and GII, both of which resulted in long amplicons covering the VP1 and RdRp encoding genes.
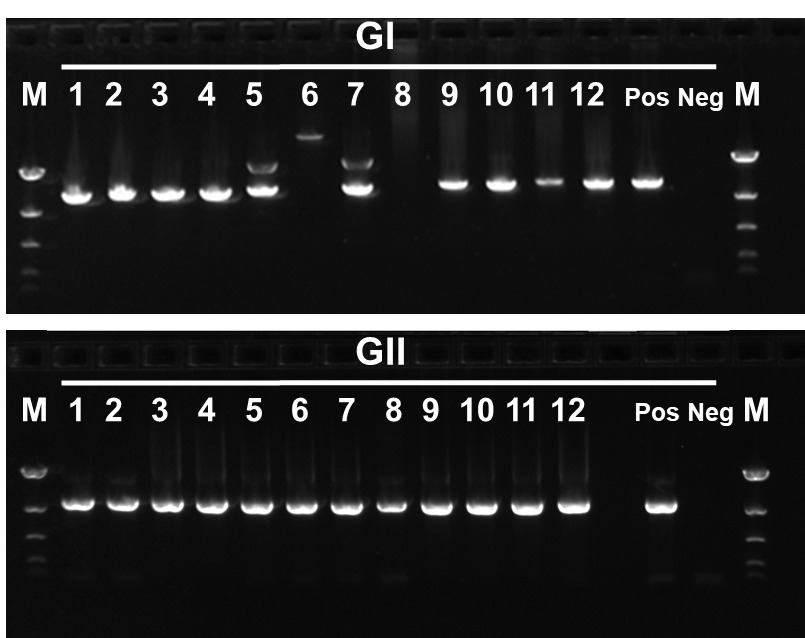
Amplification success was determined by visualisation of amplicons after gel electrophoresis using precast 2% agarose gel (E-gel, Life Technologies).
2.4. Library preparation and nanopore sequencing
For those samples where amplification was confirmed, a post-PCR clean up step was performed using 10µl of amplicon and 4µl of ExoSapIT (Applied Biosystems). Quantification of the cleaned amplicons was performed using Qubit (Invitrogen) and calculation of concentrations with an adjustment in the quantity of end-prepped DNA used in the native barcoding step done to retain 10 fmol of DNA input for the reaction.
For library preparation, the Native Barcoding Kit 96 V14 (Oxford Nanopore Technologies) following the manufacturer’s instructions for sequencing of amplicons was used. Sequencing was performed on a GridION (MinKNOW software release 24.06.15) using R10.4.1 flow cells at 400bps with a 5khz sampling rate and v4.3.0 super accurate basecalling model. Negative and positive controls were included for quality assurance.
2.5. Bioinformatics and data analysis
Bioinformatic pipeline was developed for this project (Appendix I: Methods supplementary material). Representative sequences were typed using version 2 of the Norovirus Typing Tool (Kroneman et al., 2011). Any representative sequences which could not be assigned to a genogroup, capsid or polymerase type were not subject to any further analysis. Alignment results for each sample were imported into R 4.1.2 (R Core Development Team 2016), and processed using base R , with ggplot 3.3.6 used to plot graphs (Wickham, 2009), and openxlsx 4.2.5.2 package for importing spreadsheets. To try and account for the possibility of ‘index hopping’ representative sequences supported by less than 2 percent of the median number of reads per a sample were removed from the results, with the calculation done separately for each library.
3. Results
3.1. Pathogen detections
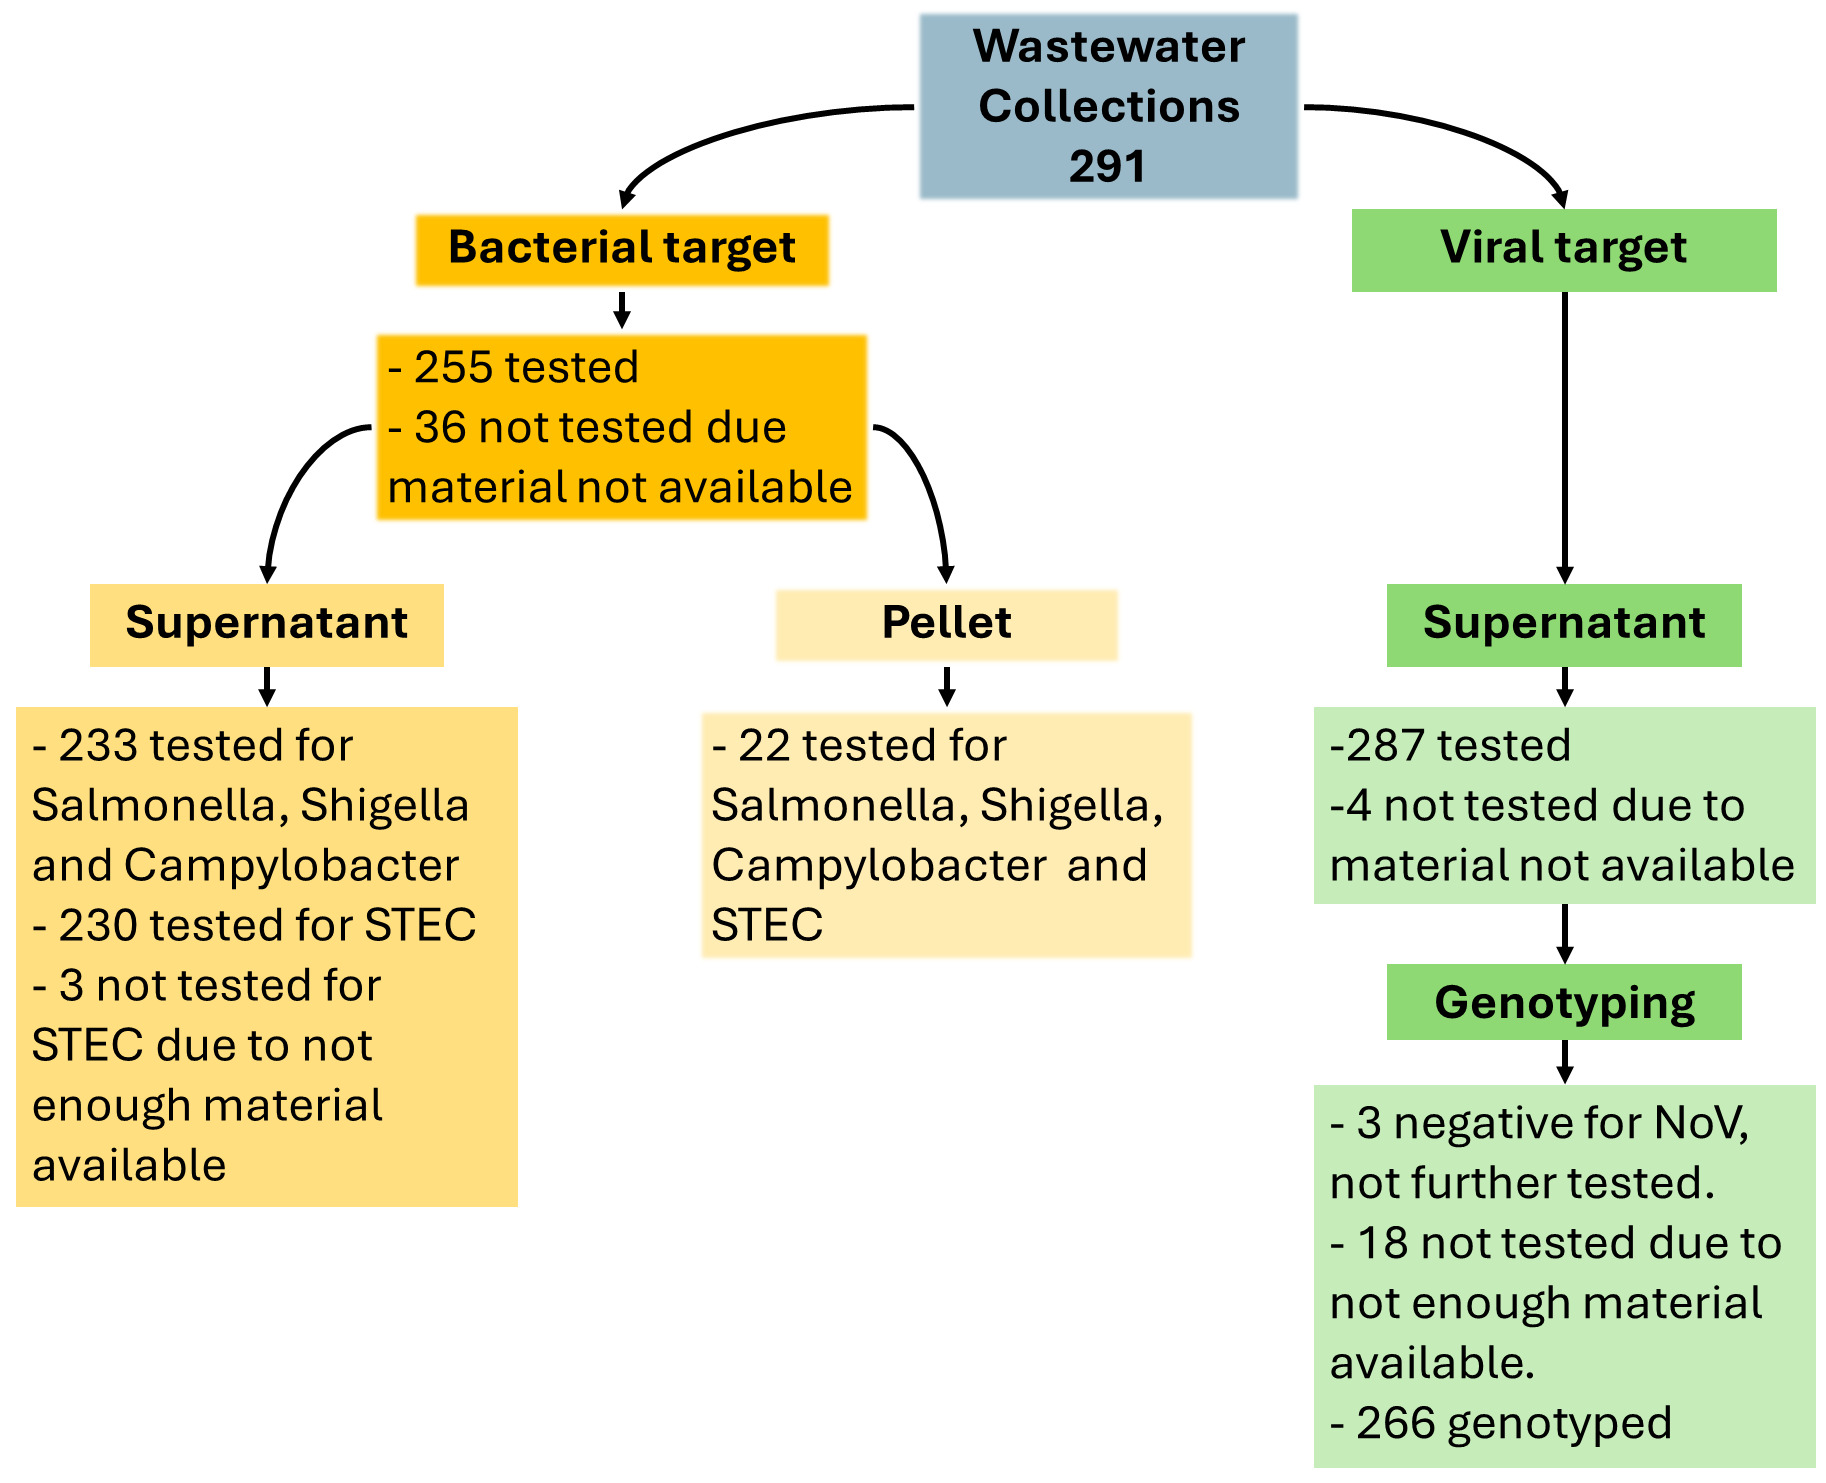
A total of 291 wastewater extracts from 32 collection sites (Appendix II, Table S1), collected between 1st April 2024 and 4th March 2025, have been tested by RT-PCR for the presence of bacterial and/or viral pathogens depending on the availability of the testing materials (Fig. 1).
Initially, detections for these bacterial targets were conducted in aliquots of the wastewater supernatant fraction as described in Methods. Supernatant fraction was tested based on the processing protocol used for PV detection. NoV (genogroups GI and GII) were tested in extracts from the supernatant fraction. In a small proportion of the wastewater samples, the pellet fraction was tested for the bacterial targets. Out of 291 extracts, Salmonella, Shigella and Campylobacter were tested in 255 samples, whereas STEC was tested in 252 samples due to insufficient material for 3 samples. For 36 wastewater collections, no supernatant material was available for bacteria detections and for 22 collections, only the pellet fractions were tested.

3.1.1. Supernatant fraction
Two hundred and thirty-three supernatant fractions out of 291, were tested for Salmonella spp., Shigella spp. and Campylobacter spp. and 230 for STEC (due to insufficient material for 3 samples). Detection results for the bacterial targets in supernatant extracts are summarised in Table 2.
A total of 287 out of 291 supernatant fractions were tested for NoV (4 samples were not tested for the viral target) (Dataset S1). No amplification of NoV genogroup I (GI) in the supernatant fraction was detected, however, 284 out of 287 wastewater samples produced detectable results for NoV genogroup II (GII) with Ct values ranging from 29.7- 40.1 (Database S1). Of the 284 positive NoV, 18 had insufficient material left to attempt NoV sequencing, only 266 were submitted to UKHSA and were progressed for sequencing.
3.1.2. Pellet fraction
Because of the low positivity rate for bacterial targets in the supernatant fraction, an alternative protocol was suggested (Cefas, personal communication) for using the pellet fractions instead of the supernatant fractions. A limited number of pellet fractions were available for testing this approach, only 22 wastewater collections were included for all bacteria targets (Dataset S1).
Detection results for the bacterial targets in 22 wastewater pellet extracts are summarised in Table 2.
3.2. Norovirus Genotyping
3.2.1. RT-PCR amplification and sequencing
A total of 266 wastewater samples positive for NoV were progressed for sequencing. The inhibitor removal step and RT-PCR amplifications were performed in small batches to ensure accuracy and to minimise chances of cross-contamination events. Amplicons were analysed by gel electrophoresis (Fig. 2).
NoV amplicons (GI and GII) from each waterwork site were pooled and processed for nanopore (MinION) sequencing as described in Methods section. All samples were sequenced in 4 independent runs.
3.2.3. Norovirus sequence analysis, metadata and genotype assignment
The sequencing raw data was analysed using the pipeline developed for this project (Appendix I: Methods supplementary material). A total of 1446 sequences from the VP1 and RdRp genomic area, from 266 wastewater samples across 32 collection sites have been generated (Sequence S1). To aid the analysis, these sequences were clustered using the following parameters: identity threshold of 98% and a maximum difference in length of 5 base pair (bp). The grouping resulted in 223 different sequences.
3.2.3.1. Results by site
Samples from 32 locations were processed in this dataset. However, samples were not collected from all sites every month. The maximum number of sites for which sequencing results were available in a month was 29, with lower numbers recorded for more recent months (Table 3). There were 30 regularly sampled sites, from which between 6 and 13 samples each were taken, as well as Peacehaven and Shoreham, which were added to the sewage network in the latest month of this study and were only sampled once for this project.
3.2.3.2. Norovirus genotyping results
Considering the VP1 diversity, a total of 9 GI and 27 GII genotyped have been identified (denoted by the GI or GII followed by a number in the genotype designation), whereas, 14 GI and 37 GII have been described based on RdRp diversity (denoted by P and a number between brackets in the genotype) (Chhabra et al., 2019).
Based on dual classification for NoV, 14 NoV GI and 22 GII genotypes were identified in the wastewater samples (Table 4). The diversity identified in this report represent 11.1% (n=14 over 126) and 2.2% (n=22 over 999) of the theoretically possible combinations of capsid (VP1) and polymerase (RdRp) genes.
The most frequent strains detected by site were GI.4 [P4], GI.6 [P11], GI.7 [P7], GII.17 [P17], GII.3 [P12] and GII.4 [P16] (Table 4). Only GII.17 [P17] was detected in every site at least once during the observation period. Some less frequent genotypes, such as GI.5 and GII.21, were detected in a fewer number of sites, however no geographical pattern was noticed.
3.2.3.4. Genotypes distribution by collection site
A total of 893 NoV strain detections, at different locations were counted (Table 5). The highest diversity of genotypes was detected in Maple Lodge with 13 different strains, followed by Blackburn, London Beddington, London Hogsmill, Luton East Hyde, and Newcastle Howden, with 12 different strains detected, followed by Davyhulme and Nottingham Stokebardolph where 11 strains were detected. Excluding Shoreham, which was only sampled once, the lowest diversity was detected in Meadowhead and Seafield, where only 5 different genotypes were detected.
3.2.3.5. Temporal distribution of genotypes
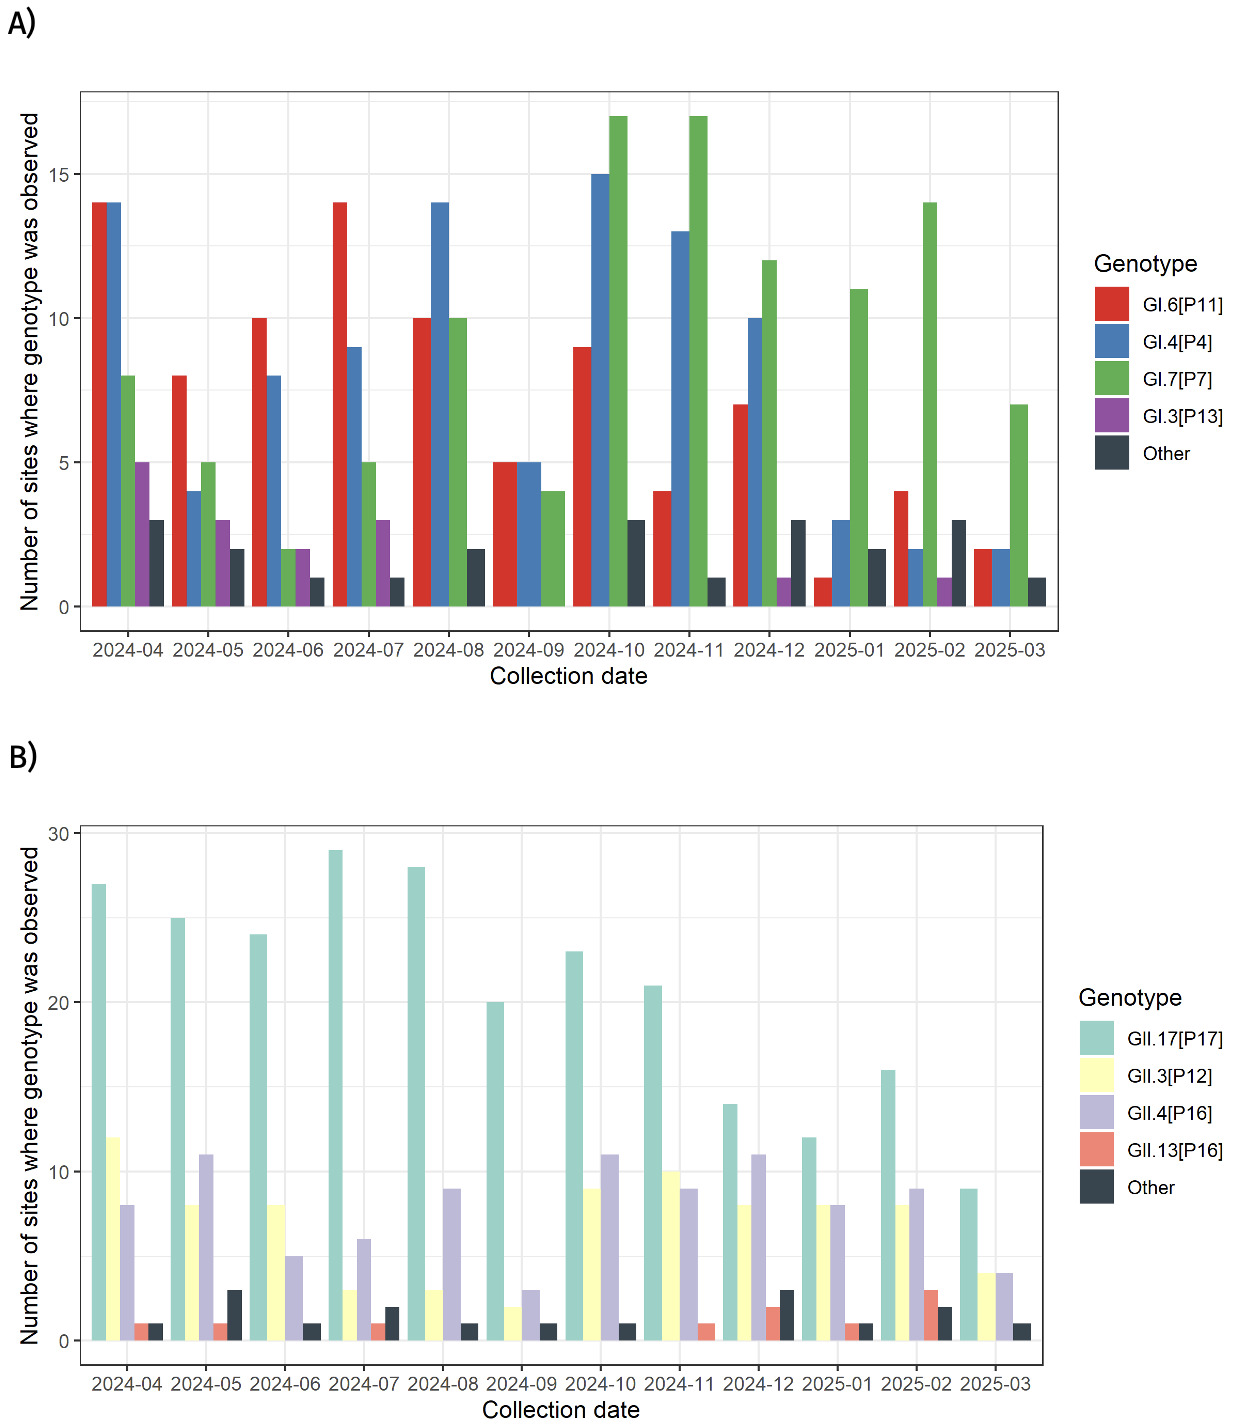
From April 2024 to March 2025, the number of sites where the NoV strains were detected is presented in Table 6 and Table S2 (Appendix II). For 8 sequences from 2 sites, no collection date was recorded (Unknown date). A total of 893 NoV strain detections at different locations were counted.
Both genogroups, GI and GII were detected in at least one site over this period (Table S3). Genotypes GI.4 [P4], GI.6 [P11], GI.7 [P7], GII.3 [P12], GII.4 [P16] and GII.17 [P17] were detected in at least one site across every collection month (Table 7 and Fig. 3). Genotypes such as GI.3 and GII.13, were not consistently detected over the same period. Similarly, GI.1, GI.3, GII.2 and GII.13 amongst others, were not always detected (Table 7).

4. Discussion
The work summarised in this report is aiming to obtain information on the circulation of several gastrointestinal pathogens in wastewater samples collected from April 2024 to March 2025 from water treatment plants that are currently part of the PV enhanced surveillance network, deployed following PV detections in London sewage in 2022. The project scope includes detection of 4 bacterial targets Campylobacter spp. (C. jejuni and C. coli), Salmonella spp., Shigella spp. and STEC, and 1 viral (NoV) target, with subsequent genotyping of the NoV positive materials.
4.1. Detection of bacterial and viral targets
Detection of the 4 bacterial pathogens in samples derived from the supernatant fraction was less successful than in the pellet fraction, where a higher proportion of positive bacterial detections was obtained. Previous studies have reported higher prevalence of bacterial pathogens in wastewater samples, however the rate of detection reported here do not align with those findings. For example, a meta-analysis of the prevalence of Campylobacter spp. in all types of wastewater-relevant samples, including influent, effluent and sludge samples collected in treatment plants, was calculated as 52.97 % (Zhang et al., 2023), however in this report only 27.3% of the pellet processed were positive for the pathogen. Other publications have detected Salmonella spp. in 62% of irrigation wastewater extracts by PCR in samples collected in Spain from October 2015 to February 2016 (Santiago et al., 2018) compared with detection rates of only 22.7% in our study. Although, shiga-toxin I and II was detected in 33% and 25% of samples taken from water treatment plants in Italy in 2014, compared with 63.6–68.2% respectively, the sample processing reported in the publication involves an enrichment step by culture growth, a step that might affect the detection rate as it requires viable cells (Bonetta et al., 2016). The small number of pellet samples analysed as part of this report limits our conclusions and hypothesis about the reasons for the differences in the number of detections in this report. They may reflect genuine differences in prevalence between studies, or it may indicate that the concentration and extraction method used in the present study requires further refinement to better preserve the bacterial content in the samples. Optimisation of the methodology used in this project is required if both viral and bacterial targets are in scope for future projects.
4.2. NoV genotyping
Of the 287 wastewater samples collected from April 2024 to March 2025, a total of 14 NoV strains belonging to genogroup I (GI) and 22 to genogroup II (GII) were identified. This is, in line with a previous study conducted in England where, 13 GI and 8 GII were described (Scott et al., 2024), although the variability in the present study is greater for genogroup GII.
Based on the capsid classification, GII.4 was the most represented genotype with the highest number of sampling sites with positive detections. This is comparable with results from a larger study involving 3,232 wastewater samples collected between May 2021 and March 2022 from 152 sewage treatment works (Walker et al., 2024b, 2024a). Interestingly, when the dual classification (capsid and polymerase) is considered, the most frequently detected strain for GII.4 was GII.4[P16] (n=122), followed by GII.4[P31] (n=8), suggesting a change in the dominant circulating strain compared with the earlier study that reported GII.4[P31] as the most frequently detected. The change in the dominant GII.4 strain, as indicated by the change in the polymerase (RdRp) gene, is consistent with reports from clinical samples in the literature (Ruis et al., 2017).
GII.3 and GII.17 were also detected at high levels in our study, similar to the 2021/22 work. Detection of the GII.17[P17] strain observed in the 2021/2022 project demonstrates the potential for wastewater surveillance to aid in early detection of novel variants, since the variant was infrequently detected in clinical surveillance until 2024. Up to 2023, a relatively small number of clinical samples containing GII.17 were detected through the routine NoV surveillance system at UKHSA (Chhabra et al., 2024). This represents only a small fraction of the total of strains detected in routine surveillance, most of which were attributed to the GII.4 strain. However, since 2024, the number of specimens genotyped as GII.17 has increased, and as of March 2025, this strain has surpassed GII.4 in frequency in clinical surveillance samples. The emergence of the GII.17 strain has been associated with an unusually high and prolonged NoV circulation in 2024 and 2025. Reports published by UKHSA in 2025, indicate a 168% increase in NoV laboratory reports compared with the 5-season average for the same period (UKHSA, 2025c) suggesting increased virus circulation during period typically considered as low season. Similar trend with increasing number of GII.17 detections have been reported worldwide (Chhabra et al., 2024).
4.3. Limitations
There are some limitations to the results and interpretation presented in this report. Site locations were selected to serve PV rather than gastrointestinal pathogen surveillance. There is a bias to high representation of urban population, however host attribution (human vs non-human) for the bacterial pathogens included in this project is not possible.
For NoV results, there is no weighting applied to account for differences in population density in different parts of the country to the number of sites in which each NoV genotype was observed, or the relative abundance of genotypes observed within a single sample. Therefore, these results are best interpreted as confirming the presence of a genotype within the local population living within the sewage treatment catchment area at the time of testing; an indication of the geographical spread of a strain, not an indication of the relative abundance or prevalence or pathogenicity. It is also notable the differences in diversity observed by site, with some sites presenting over double number of strains detected in others. This might also be an indication of the population covered within the catchment area.
Funding
The project (FBD.1, FS900511) was funded from the HM Treasury Shared Outcomes Fund through the Pathogen Surveillance in Agriculture, Food and Environment (PATH-SAFE) programme.