


1. Executive Summary
1.1. Introduction
In 2010, the Food Hygiene Rating Scheme (FHRS) was launched by the Food Standards Agency (FSA), to help consumers make more informed choices about where they eat or purchase food. The FHRS is operated in partnership with local authorities and the Welsh Government in Wales.
The FSA has conducted annual research into the display of food hygiene ratings across England, Northern Ireland and Wales since 2011. The objectives of the 2025 research were to provide a representative estimate of display both on physical premises and online, while also exploring business motivations related to display and their awareness and attitudes towards the Scheme. These insights support the FSA’s ongoing policy development and communication activity.
In line with previous years of the study, a two-strand approach was adopted to address the core research objectives. This involved 1,336 covert audits and 1,350 telephone surveys with food businesses in England, Northern Ireland and Wales.
A targeted audit of 413 food businesses in England with FHRS ratings between 0 and 2 (referred to as ‘low-rated’ businesses) was conducted in 2025 for the first time. This element of the research sought to understand whether lower-rated businesses display their ratings, and if so, whether an accurate rating was displayed.
1.2. Awareness and perceptions of the FHRS
Awareness of the FHRS remained high in 2025, with at least nine in ten businesses in England (90%), Northern Ireland (94%) and Wales (94%) reporting familiarity with the scheme. As seen in previous years, awareness was slightly higher in Northern Ireland and Wales, likely reflecting the impact of mandatory display requirements in those countries.
Most businesses (96%) were aware of their own food hygiene rating, and the majority were satisfied with it. Satisfaction was highest in England and Northern Ireland (both 91%). In Wales, satisfaction was slightly lower at 86%, which may relate to the distribution of ratings: businesses surveyed in Wales were less likely to hold a top rating of 5 (71% compared with 77% average across England, Northern Ireland and Wales), potentially influencing perceptions of their score.
Nearly all businesses across England, Northern Ireland and Wales considered the FHRS to be important to their business (England: 96%, Northern Ireland: 94%, Wales: 93%). Across the three countries, businesses showed strong agreement that the Scheme motivates businesses to maintain or improve their rating (England: 99%, Northern Ireland: 98%, Wales: 97%) shows customers they take food hygiene seriously (England: 97%, Northern Ireland: 97%, Wales: 94%) and that they are proud of their rating (England: 95%, Northern Ireland: 94%, Wales: 88%).
Across all three countries, most food businesses that reported receiving a FHRS rating of 4 or less were making changes to try to improve their rating (England 82%; Northern Ireland 80%; Wales 83%). These figures are broadly in line with 2024. The top two changes in each country were improving documentation and undertaking repairs or improvement works.
1.3. Audit of food hygiene rating display
Core audit: physical display
Across the three countries, display levels of FHRS stickers observed in the audits remained broadly consistent with 2024. The vast majority of businesses in Wales (95%) and Northern Ireland (92%) displayed an FHRS sticker in a location visible from outside or inside the premises, compared with 70% in England. The lower rate of display in England compared with Northern Ireland and Wales likely reflects the absence of a legal requirement to display a rating sticker in England.
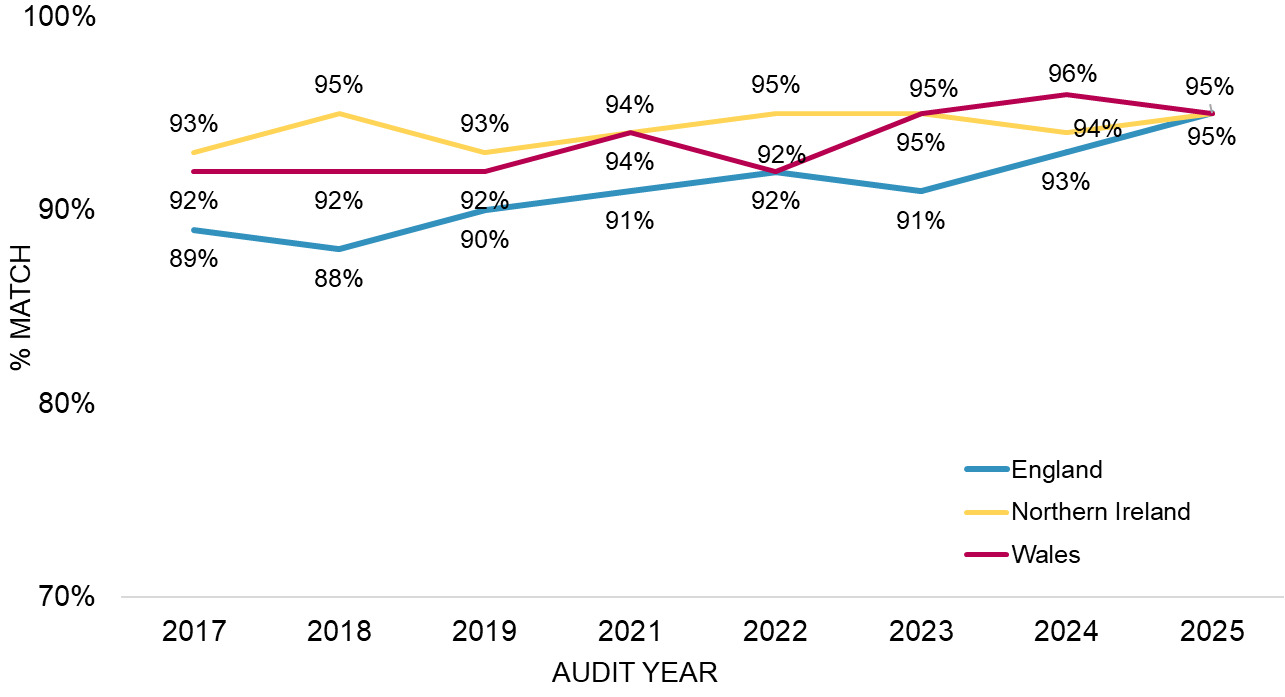
In England, display levels dipped slightly from 72% in 2024 to 70% in 2025, though this shift is not statistically significant. This comes after a sustained rise between 2017 and 2024, during which display increased by 17 percentage points. While there was no statistically significant change in display rates in Northern Ireland and Wales between 2024 and 2025, there has been a steady upward trend in recent years. For both countries, the rate of FHRS display has increased by 8 percentage points since 2021.
The vast majority of the outlets displaying an FHRS sticker in England, Northern Ireland and Wales were displaying a rating that matched the FHRS database at the time of audit (95% in all three countries). This is consistent with previous recent waves of the research[1].
Core audit: online display
Across England, Northern Ireland and Wales, most food businesses had an online presence in 2025, making active use of Facebook (England: 68%, Northern Ireland: 70%, Wales: 70%), Instagram (England: 47%, Northern Ireland: 43%, Wales: 38%) and their own business websites (England: 56%, Northern Ireland: 44%, Wales: 48%). Compared to 2024, findings indicate an increase in the use of social media platforms amongst food businesses in England and Wales.
Despite widespread use of social media, very few food businesses enabled online ordering through the platforms: only 1% of businesses in England, Northern Ireland and Wales who had a Facebook business page or Instagram profile facilitated orders via these platforms. Ordering via businesses own websites was more common than social media ordering across the three countries. Around a third (32%) of food businesses in England with their own website offered online ordering (18% of all audited businesses), 27% in Northern Ireland (12% overall) and 28% in Wales (13% overall).
Display of FHRS ratings online remained low across all three countries. Among businesses with a presence on each platform, fewer than one-in-ten displayed their rating on their website (England: 9%, Northern Ireland: 2%, Wales: 8%) and fewer than one-in-twenty displayed their rating on Facebook (England: 2%, Northern Ireland: 3%, Wales: 4%) or Instagram (England: 0%, Northern Ireland: 1%, Wales: 3%). Display also remained low when businesses facilitated online ordering across these platforms.
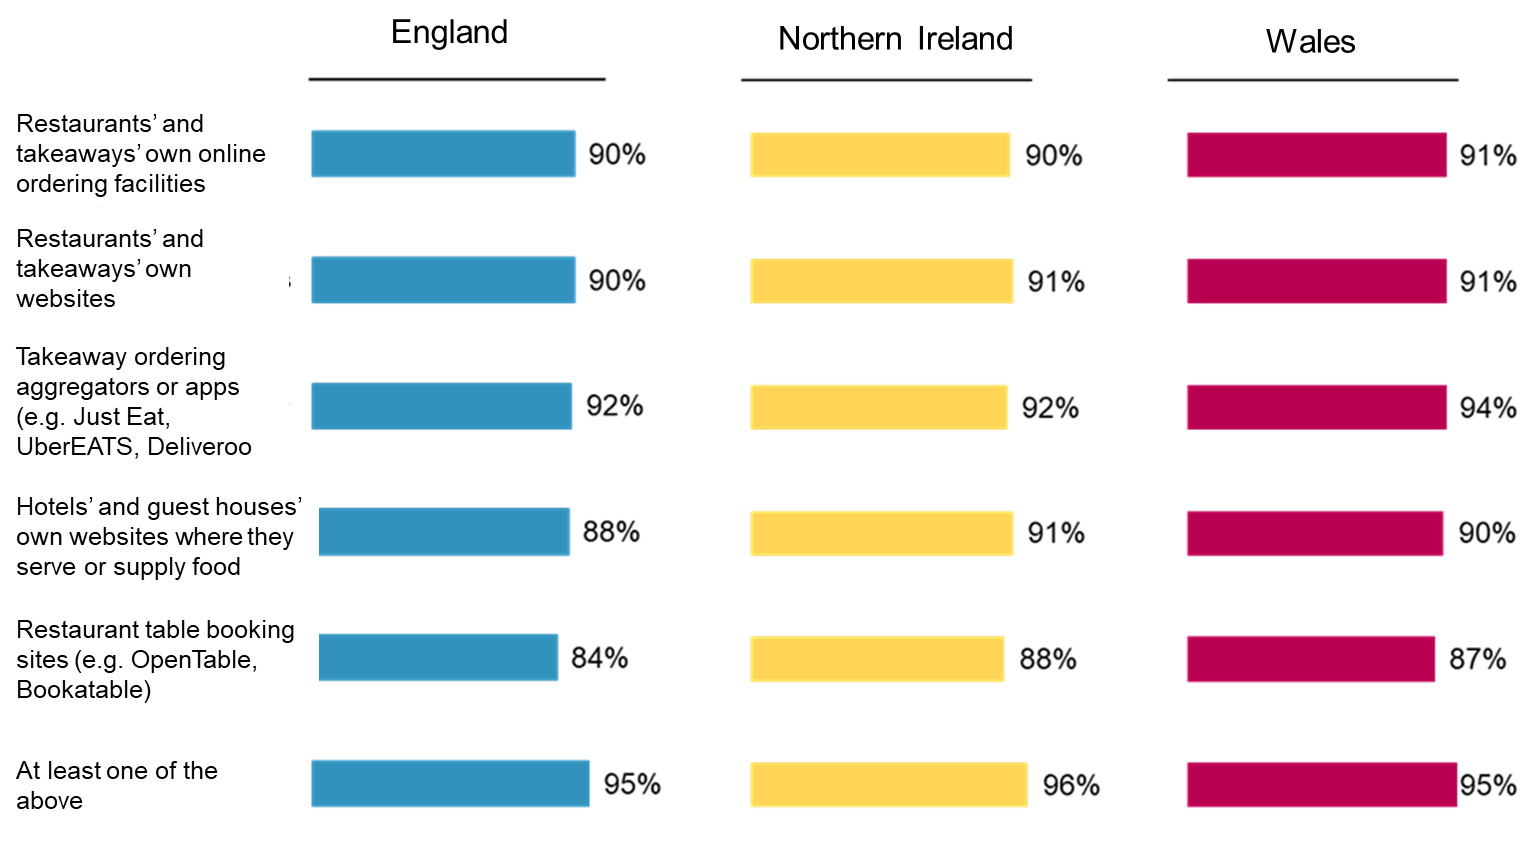
The vast majority of businesses across all three countries supported making display mandatory on at least one of the online platforms asked about, including food businesses’ own websites, social media and restaurant table booking sites (England: 95%, Northern Ireland: 96%, Wales: 95%). Support was driven by perceived customer benefits and confidence in food hygiene standards.
1.4. Low-rated audit in England: physical display
Just under one in five low-rated food businesses in England (18%) were displaying an FHRS sticker at the time of the audit. Given that display of rating stickers at premises is not a legal requirement in England, this low level of display is unsurprising.
Where stickers were displayed, they were typically placed prominently, with 96% clearly visible to customers and 92% visible from outside the premises. However, while visibility was high, the information displayed was usually invalid or out of date. Comparison with the FHRS database shows that almost all of those displaying a sticker were displaying an invalid rating at time of audit. Of the 413 businesses visited, only 71 were displaying an FHRS sticker, and only one was found to be displaying a valid rating.
To understand this pattern, the FSA reviewed historical FHRS records and found that the majority of low-rated businesses appeared to be displaying a rating from the previous or an earlier inspection[2], rather than the most recent inspection.
1.5. Self-reported food hygiene rating display
During the survey, almost all businesses in Wales (99%) and Northern Ireland (98%) reported displaying their FHRS stickers somewhere clearly visible to customers. Self-reported display was lower in England, at 86%. As with the audit results, the lower rate of self-reported display in England likely reflects the absence of a legal requirement to display FHRS stickers.
In line with previous waves, self-reported display rates in the telephone survey were notably higher than those observed in the audit across all countries. The gap was largest in England; 86% claimed to display their sticker, but the audit found only 70% did so. This difference may be driven by social desirability bias, with some businesses overstating compliance in an effort to align with expectations or avoid criticism.
In England, where display is voluntary, the most frequently cited reasons for not displaying a rating were having nowhere suitable to show the sticker so it can be seen from outside(26%) and not having received a sticker (18%). For these businesses, the strongest incentive for future display was achieving a higher rating (20%), with smaller proportions saying they would be encouraged if the rating felt more relevant to their business (10%) or if display became a legal requirement (8%). Self-reported non display in Wales and Northern Ireland was uncommon.
1.6. Attitudes towards mandatory physical display
Awareness of mandatory display remains very high in both Northern Ireland (97%) and Wales (98%), and the vast majority of businesses viewed the requirement positively (95% and 91% respectively). Businesses typically explained this positive view by highlighting the role mandatory display plays in helping customers make informed, safe choices and in promoting transparency.
Support for introducing mandatory display in England also remained strong, with 86% of businesses saying it would be a good thing. Supporters felt mandatory display would help customers identify safe places to eat and strengthen transparency across the sector. Among the small minority who were neutral or negative, the main concerns centred on the belief that customers pay little attention to hygiene ratings and perceived shortcomings in the scoring system.
1.7. Awareness and ease of use of safeguards
Recollection of receiving an inspection report letter remained high across all three countries in 2025: 84% in Northern Ireland, 87% in Wales and 76% in England. This is in line with 2024. However, recall levels across all countries remain below the higher levels recorded between 2018 and 2019 (England: 82-84%, Northern Ireland: 92-94%, Wales: 92-93%), indicating a longer term significant decline in businesses’ recollection of receiving an inspection letter.
Awareness of the three FHRS safeguards (appeal, the ‘right to reply’ and requesting a re-rating) available to food businesses with a rating between 0 and 4 was relatively high across all three countries (England: 77-88%, Northern Ireland: 77-89%, Wales: 80-92%). In each country, at least three quarters of businesses who reported ratings of 0 to 4 were aware of each safeguard.
Use of FHRS safeguards among surveyed businesses rated between 0 and 4 remained limited in 2025. Businesses reported the ‘right to reply’ (England 17%; Northern Ireland 15%; Wales 17%) and appeals (England 14%; Northern Ireland 12%; Wales 18%) as the most commonly used safeguards, but fewer than a fifth of businesses reported using them. Re-rating inspections were reported as the least used safeguard (England 3%; Northern Ireland 12%; Wales 9%).
Across all three safeguards, non-use was largely driven by acceptance of the rating or a focus on improvement rather than challenge. Many businesses rated between 0 and 4 said they did not appeal or request a re-rating because they were already making the required changes to improve their rating, while others accepted their rating despite reservations. Cost was mentioned as a barrier to not applying for an appeal or exercising the ‘right to reply’ in particular, suggesting confusion around the safeguarding process as there are no associated costs to businesses for either of these safeguards. Perceived impact also played a role: some businesses felt responding publicly did not matter enough to justify action.
1.8. Infographic

2. Introduction
2.1. Background to the FHRS
In 2010, the Food Standards Agency (FSA) launched the Food Hygiene Rating Scheme (FHRS). This scheme was designed to help consumers make more considered choices about where they eat or purchase food by providing ‘at-a-glance’ information about the hygiene standards of food businesses as of their last inspection by their local authority’s food safety officer.
Under the scheme, establishments where food is supplied, sold or consumed are given a rating ranging from 0 to 5, with 5 indicating ‘very good’ food hygiene and 0 indicating ‘urgent improvement necessary’. The ratings are determined by three elements:
-
hygienic food handling;
-
physical condition of the premises and facilities; and
-
food safety management.
_and_wales_(right).jpeg)
In Northern Ireland (since 2016) and Wales (since 2013), establishments are legally required to display their food hygiene ratings in a prominent place, like the front door, entrance or window of the business where it can be easily seen and read by customers. They are also required to provide information on their rating verbally if requested to in person or over the phone. Businesses in England are not legally required to display their rating at their premises but are encouraged to do so. Across England, Northern Ireland and Wales, food hygiene ratings are available to search on the FSA’s ratings website. The FSA also provides guidance and a free toolkit to help businesses get the most from their food hygiene ratings.
In Wales, the scheme differs slightly in that it also applies to businesses that sell food to other businesses, including food manufacturers and wholesalers. Furthermore, establishments that supply takeaway food must include a bilingual statement on their menu leaflets and flyers. This instructs customers on how to find details of their food hygiene rating on the FSA’s ratings website, as well as reminding consumers that they have a legal right to ask the food business for their food hygiene rating when they order food.
2.2. Research objectives
The FSA has undertaken research into the Display of Food Hygiene Ratings in England, Northern Ireland and Wales on an annual basis since 2011. The core research objectives in 2025 were to:
-
Provide an estimate of the proportion of food businesses (FBOs) that display food hygiene rating stickers at their physical premises and online.
-
Explore business awareness and attitudes towards the Scheme.
-
Explore the reasons and drivers behind display and non-display both at the premises and online.
-
Provide the FSA with robust insight to inform any legislative changes and to support communications.
In 2025, for the first time, an additional strand of research focused specifically on food businesses in England with FHRS ratings between 0 and 2 (referred to as ‘low-rated’ businesses) was undertaken. The objectives of this targeted research were to:
-
Measure the extent and accuracy of food hygiene rating display among lower-rated businesses.
-
Assess patterns and differences by business characteristics.
2.3. Methodology
In line with previous years of the study, a two-strand approach was adopted to address the core research objectives. This comprised:
-
A covert audit of 1,336 food businesses in England, Northern Ireland and Wales, conducted by Mystery Shoppers. This included both an audit of the businesses’ physical premises and their website, Instagram or Facebook Business Page, where applicable.
-
A telephone survey of 1,350 food businesses in England, Northern Ireland and Wales, conducted by IFF Research (450 per nation).
To address the objectives of the targeted research, a dedicated audit was carried out among low-rated food businesses in England. This involved a separate physical audit of 413 establishments with FHRS ratings between 0 and 2. Conducting this as a standalone audit was necessary because the main audit is designed to provide a representative estimate of FHRS display across England, Northern Ireland and Wales. FBOs with an FHRS rating of between 0 and 2 constitute only 3% of the underlying population in England. As a result, the number of low-rated businesses naturally captured in the main sample is relatively small and not sufficient for detailed analysis.
2.3.1. Sampling
For both the telephone survey and audits, a sample was drawn from the FSA’s FHRS database. The sample was processed to exclude food businesses that were ineligible for the research; these were defined as those who had not yet been inspected and issued with an FHRS rating, those who operated in a premise that was not publicly accessible, mobile food businesses or food businesses operating within a residential property.
The initial sample for both the telephone survey and audits included the following outlet types:
-
Accommodation (e.g., hotels) and pubs, bars, and nightclubs
-
Restaurants, cafes, and other catering businesses (e.g., event caterers and home caterers)
-
Retail (e.g., supermarkets, butchers, and bakeries)
-
Takeaways and sandwich shops
To ensure representativeness of the underlying population of food businesses, records were drawn from the sample frame using a stratified random sampling approach. Specifically, the sample was stratified by setting quotas for country, region within country, outlet type and FHRS rating. Additionally, businesses in Northern Ireland and Wales, takeaways and sandwich shops and those with a food hygiene rating of three or less were oversampled to ensure that robust results could be produced for each sub-group.
2.3.2. Fieldwork
The telephone survey and main audit strands each began with a pilot stage lasting up to a week. Mainstage telephone survey fieldwork occurred between 29 September - 12 November 2025 and mainstage audit fieldwork occurred between 10 October – 5 December 2025. The low-rated audits took place from 6 October – 4 November 2025.
In total, 1,336 successful mainstage audits were conducted. This is slightly below the targeted total due to a higher than expected number of unauditable locations (49 in total), and the exclusion of 11 records as a result of data quality checks conducted upon completion of the fieldwork period.
The final profile of the audits and telephone interviews achieved by country are detailed in Table 1. Additional business profile details (e.g. outlet type, food hygiene rating) can be found in the accompanying 2025 Technical Report.
In total, 444 audited food businesses also took part in the telephone survey. Detail on the profile of these businesses is also available in the 2025 Technical Report.
2.3.3. Data preparation
The data collected from the telephone survey and audits of food businesses was weighted to make it representative of the underlying population. Weighting the data was necessary because of the deliberate decision to stratify interviews to ensure sufficient base sizes were achieved by country and FHRS rating.
2.4. Reporting notes
Throughout the report the terms ‘business’, ‘establishment’, ‘premises’ and ‘outlet’ are used interchangeably to refer to food business sites.
To aid interpretation, the following markers and conventions are used in charts and tables:
↑ / ↓ denotes a significant difference compared to 2024
~ denotes findings should be treated with caution due to a low base size.[3]
* denotes figure is higher than the 2025 average for all three countries or individual countries (see graph notes for information)
** denotes figure is lower than the 2025 average for all three countries or individual countries (see graph notes for information)
Unless otherwise stated, all differences reported between sub-groups or between survey waves are statistically significant at the 95% confidence level. Where findings are indicative but not statistically significant, this is clearly noted.
Findings from the targeted audit are reported discretely in Chapter 10. They have been deliberately excluded from the main results in Chapters 1–9, which focus solely on the nationally representative audit and survey.
3. Audit of display of food hygiene rating stickers
This chapter covers the findings from the core physical audit of food businesses in England, Northern Ireland and Wales. It provides comprehensive analysis of the prevalence of FHRS sticker display, the location of stickers on display and the accuracy of displayed ratings. Findings from the targeted audit of lower-rated businesses in England are reported in Chapter 10.
3.1. Rates of display
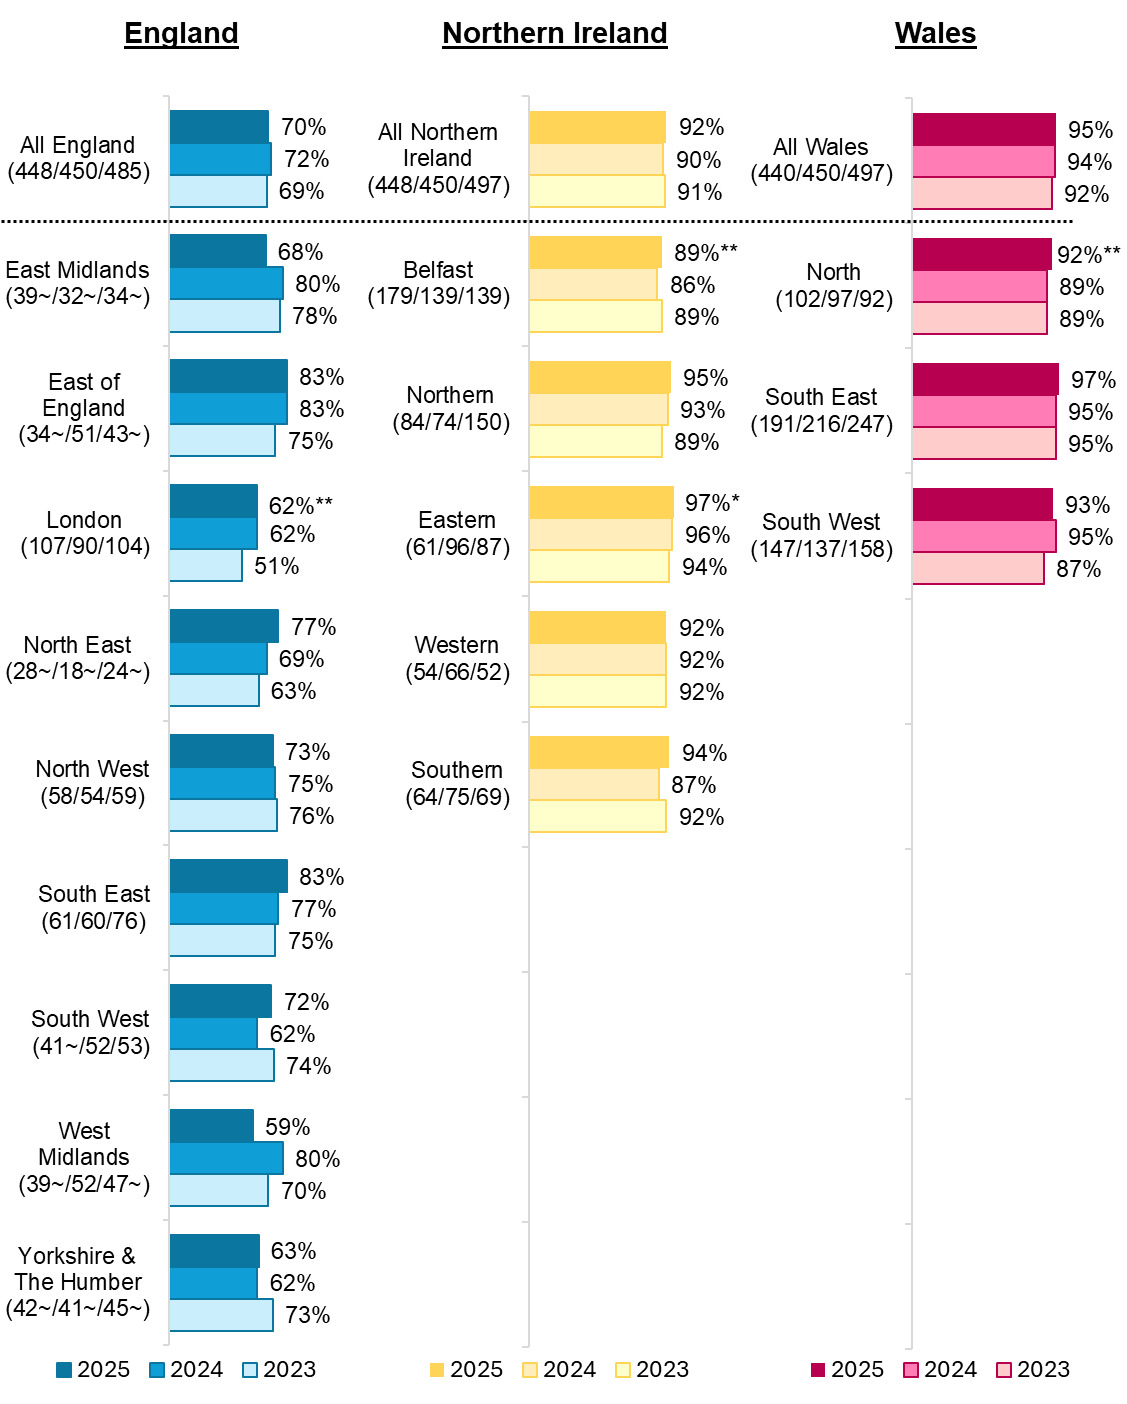
Around nine in ten outlets in Wales (95%) and Northern Ireland (92%), and seven in ten outlets in England (70%), were found to be displaying an FHRS sticker in a location visible from outside or inside the premises. These rates of display are in line with findings from 2024. The lower rate of display in England compared with Northern Ireland and Wales likely reflects the absence of a legal requirement to display a rating sticker in England.
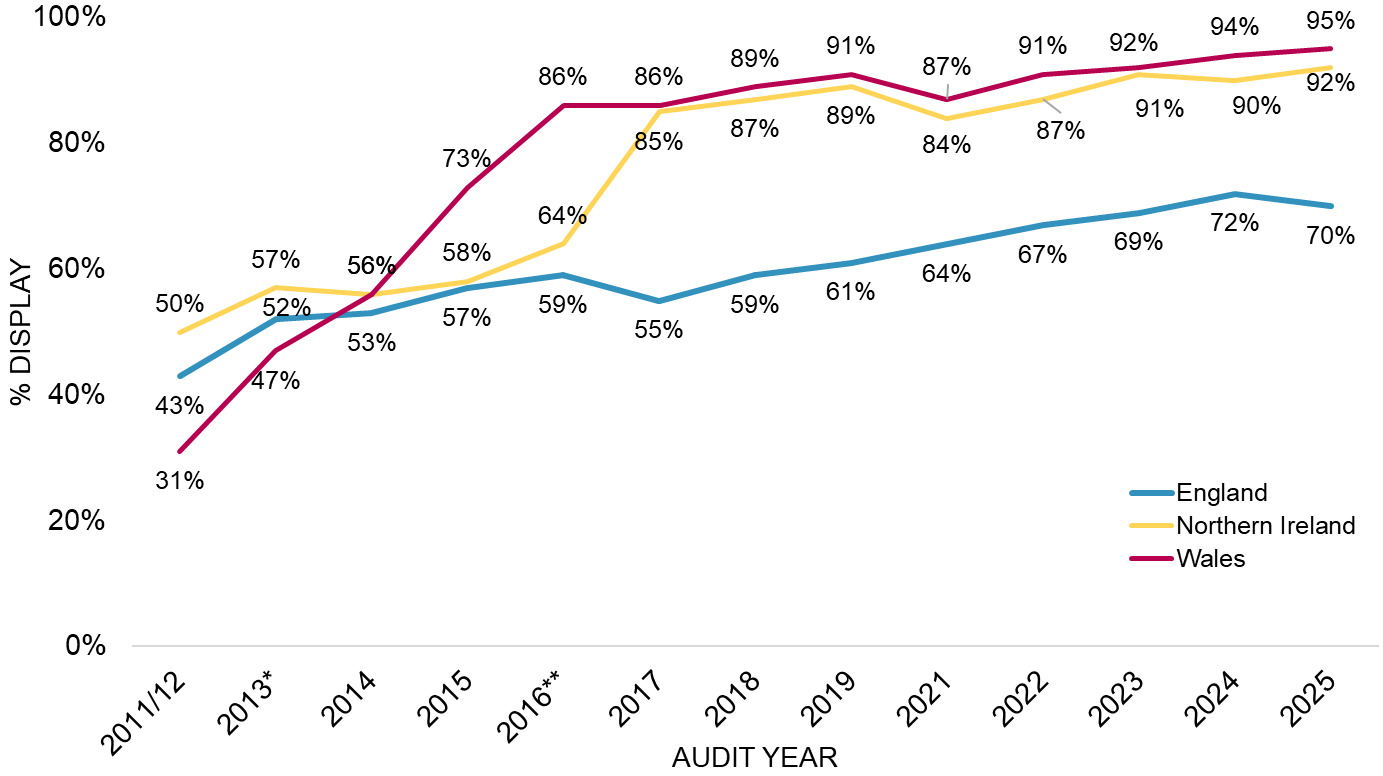
In England, the proportion of outlets displaying a sticker fell slightly from 72% in 2024 and to 70% in 2025, though this change is not statistically significant. This follows a period of sustained increase between 2017 and 2024, in which the rate of display grew by 17 percentage points (55% to 72%).
In Northern Ireland, rates of display have remained roughly consistent since 2023 (2023: 91%, 2024: 90%; 2025: 92%). Restaurants and cafes were more likely than average to display a rating (95%). In contrast, as seen in 2024 and 2023, accommodation businesses, pubs, bars and nightclubs in Northern Ireland were less likely to display a sticker (82%).
In Wales, 95% of businesses were displaying a rating sticker, which is consistent with 2024 (94%). This follows an upward trend between 2021 and 2024, in which the rate of display increased by seven percentage points from 87% to 94%. Restaurants and cafes were more likely than average to be displaying an FHRS rating sticker (98%).
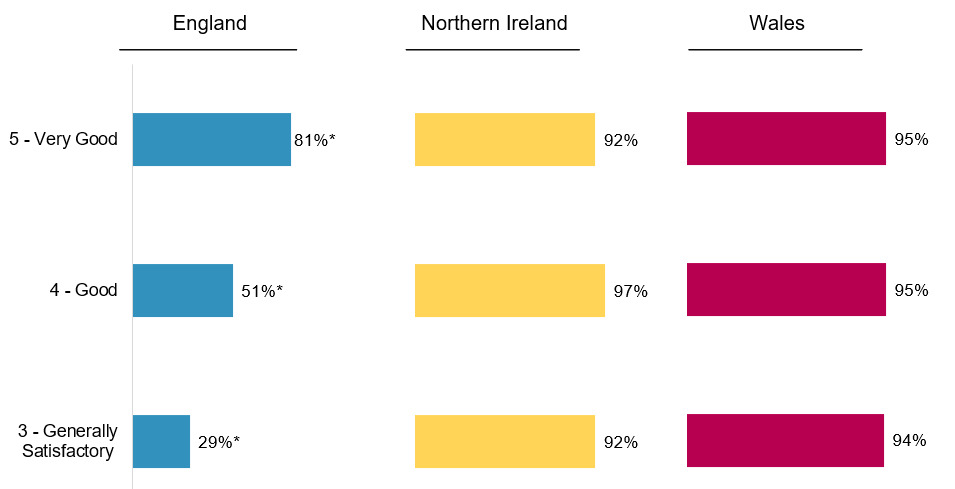
As presented in Figure 3, display rates in England remained strongly linked to food hygiene rating: 81% of outlets rated 5 displayed their sticker, falling to 51% for those rated 4 and 29% for those rated 3. In contrast, display rates were broadly consistent across different ratings in Northern Ireland and Wales. This reinforces the impact of mandatory display in providing transparency to consumers for all ratings.
The number of audited outlets rated 2 or below was very small (England: 20; Northern Ireland: 6; Wales: 19). Even so, clear differences emerged. Most businesses rated between 0 and 2 in Wales (16 out of 19) and Northern Ireland (4 out of 6) were displaying their rating. In England, however, only one of the 20 businesses rated 0–2 in the dataset was displaying a rating.
There was limited variation in the rates of display between different regions: however, as in 2024, there is evidence that rates of display were lower in major cities (see Figure 4).

3.2. Whether rating sticker was clearly visible
The physical audits also captured whether FHRS rating stickers were visible from outside business premises and whether they were clearly visible to customers, either inside or outside. ‘Clearly visible’ is defined as not obscured by any other stickers or posters and not blocked from view by any furniture or objects. As in previous years, the vast majority of FHRS stickers observed were clearly visible.
In England, 65% of businesses had a sticker on display that was visible from outside the premises. As shown in Table 2, this figure is in line with the previous three years (2022: 63%; 2023: 64%; 2024: 66%). Around one in 20 businesses in England only displayed a sticker inside their premises meaning their rating was not visible from outside (5%). Irrespective of the location of display, around seven in ten businesses displayed a sticker in a location deemed ‘clearly visible’ by auditors (69%). Retail businesses (60%) were less likely than average to be displaying their sticker in a clearly visible location.
In Northern Ireland, 87% of businesses had a sticker visible from outside the premises, which is an increase compared to 2024 (82%) but in line with previous years (2023: 88%; 2022: 85%), indicating that the long term trend is relatively stable. Additionally, nine in ten businesses (90%) displayed their sticker in a location deemed ‘clearly visible’. As in 2024, accommodation businesses and pubs, bars and nightclubs were less likely to have an FHRS sticker displayed in a clearly visible location (79%).
In Wales, nine in ten (90%) of the audited food business outlets were displaying a sticker in a location that was visible from outside, which is in line with 2024 (91%) and broadly in line with previous waves since 2022. Additionally, the number of businesses displaying a sticker only visible from inside (5%) and not displaying a sticker (5%) remained broadly consistent with findings in 2024. Slightly over nine in ten businesses (92%) displayed a sticker in a location deemed ‘clearly visible’ by auditors (92%). Retail businesses (87%) were less likely than average to be deemed to be doing so.
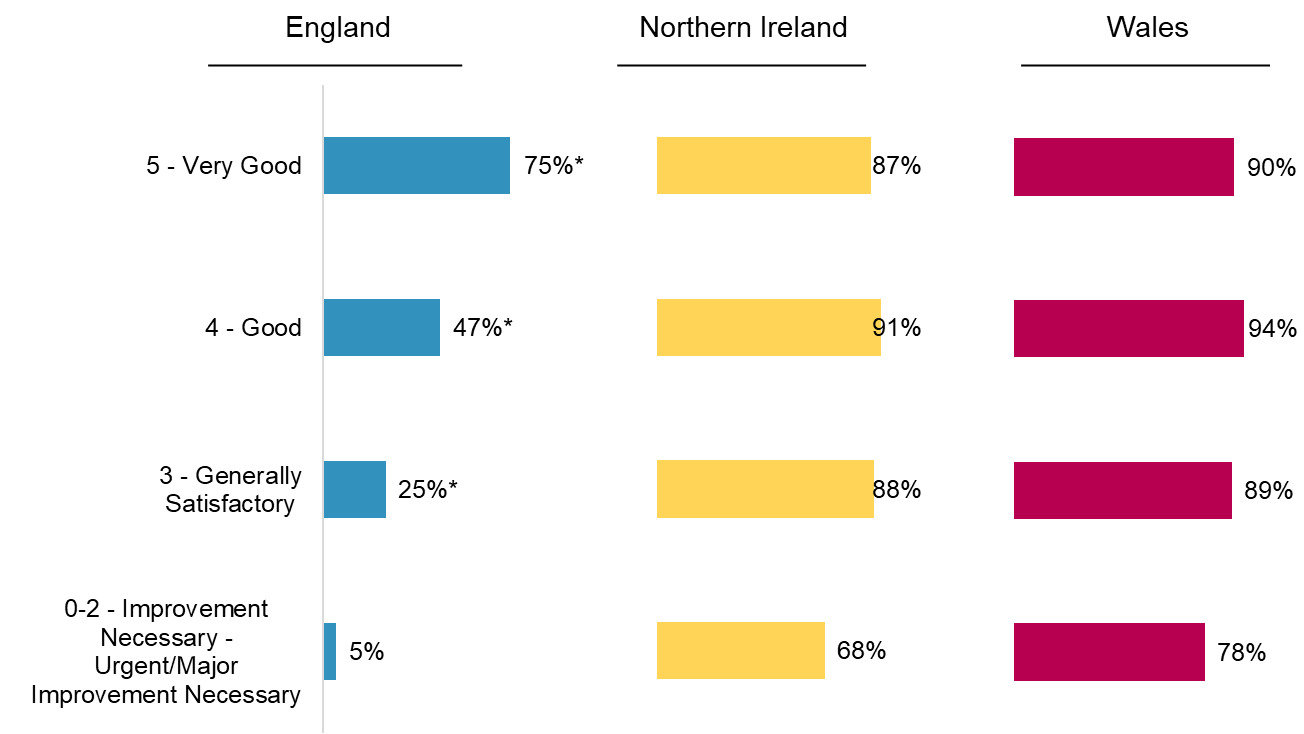
As depicted in Figure 5, businesses in England with a rating of 5 were more likely to display their sticker in a location visible from outside the premises (75%) compared to those rated 4 and below. In contrast, there was no statistically significant variation by FHRS rating in Northern Ireland and Wales. While figures for businesses with a rating of 3 and below are included in Figure 5, they should be treated with caution due to the small sample sizes.
3.3. Whether the outlet displayed a valid rating
As shown in Figure 6, the vast majority of the outlets displaying an FHRS sticker in England, Northern Ireland and Wales were displaying a rating that matched the FHRS database at the time of audit (95% in all three countries). This is consistent with previous recent waves of the research.[4]
.png)
Almost all of outlets with a rating of five on the FHRS database that were displaying a sticker were found to be displaying a valid rating (England: 99%, Northern Ireland: 98%, Wales: 99%).
A minority of outlets across England, Northern Ireland and Wales were found to be displaying an invalid rating during the audit. Table 5 shows the invalid stickers displayed by outlets across the three nations, split by their actual rating on the FHRS database at the time of audit. This includes outlets who were displaying multiple stickers of different ratings. The most common invalid rating was outlets rated a 4 displaying a 5 (23 businesses).
4. Online display
This chapter examines both observed and self-reported use of online platforms by food businesses, focusing on how these platforms are used to facilitate orders and the prevalence of FHRS rating displays. It offers a comprehensive overview of different types of online platforms, including businesses’ own websites, social media channels, and food delivery aggregators. The chapter concludes by assessing attitudes towards the visibility of FHRS ratings on food delivery aggregators and the mandatory display of ratings online.
In the online audit, auditors assessed the online presence of food business operators, the facilitation of online orders, and the display of FHRS ratings on three prominent online platforms: Facebook business pages, Instagram profiles and businesses’ own websites. The audit also involved a separate assessment of the use of online food delivery aggregators (rating display on these platforms was not recorded as part of the audit as the format of display is already known).
4.1. Display on social media and websites
In England, as presented in Table 6, most businesses had an online presence in 2025: 68% were on Facebook, 47% on Instagram, and 56% had their own website. Both social media platforms saw increases from 2024 (60% on Facebook; 37% on Instagram).
Online ordering functionality was very uncommon on social media. Only 1% of businesses enabled orders through Facebook or Instagram. In contrast, online ordering was far more likely to be offered through a business’s own website: 32% of those with a website supported online ordering, equivalent to 18% of all audited businesses. Amongst businesses with a website, takeaways and sandwich shops were much more likely than average to offer this (65%).
Display of FHRS ratings online remained low. Among businesses with a presence on each platform, just 9% displayed their rating on their website, 2% on Facebook, and none on Instagram. Of the 83 businesses facilitating online orders (either through Facebook, Instagram or their own website), 13 businesses (16%) were displaying their rating on at least one of the platforms.
In Northern Ireland, as shown in Table 7, most businesses had an online presence: seven in ten (70%) had a Facebook page, 43% had an Instagram page, and 44% had their own website. Instagram presence increased in 2025 compared to 2024 (30%).
Facilitating online orders on social media was low (1% on Facebook, and none on Instagram). Around a quarter (27%) of businesses with a website offered online ordering, which represents 12% of all audited businesses in Northern Ireland overall. As in England, amongst businesses with a website, takeaways and sandwich shops were more likely than average to have an online ordering function on their website (67%).
Very few outlets with an online presence[5] were found to be displaying their rating online: 2% displayed their rating on their website, 3% on their Facebook page, and 1% on their Instagram page. Of the 48 businesses facilitating online orders through Facebook, Instagram, or directly through their own website (excluding aggregators), just 2 (4%) were displaying an FHRS rating online on any of the three platforms.
In Wales, as shown in Table 8, most businesses also had an online presence: seven in ten had a Facebook page (70%), just under four in ten had an Instagram page (38%), and just under half (48%) had their own website. The proportion of businesses with presence on social media increased compared to 2024 (Facebook: 62%; Instagram: 28%).
As in England and Northern Ireland, very few businesses facilitated online orders through social media (1% through Facebook and 1% through Instagram). Of those with a website, 28% had an online ordering function, which represents 13% of audited businesses in Wales overall. Of those with a website, almost eight in ten takeaways and sandwich shops (79%) offered an online ordering function.
Relatively few businesses in Wales were displaying a rating online. Among those present on each platform, an FHRS rating was visible on 4% of Facebook business pages, 8% of websites and 3% of Instagram pages. Considering only those that facilitate online orders on any platform (n=69), 20 businesses (29%) were found to be displaying a rating on any of the three audited platforms.
4.2. Use of third party websites/apps
As part of the online audit, checks were also conducted on the presence of businesses on three major online food delivery aggregators: Just Eat, Deliveroo and Uber Eats. Two fifths (41%) of businesses in England, a fifth (19%) in Northern Ireland, and around a quarter (24%) in Wales used at least one of these platforms. This represents an increase amongst businesses in England compared with 2024 (32%), while levels in Northern Ireland (19% in 2024) and Wales (23% in 2024) remained consistent. Across all three countries, the most widely used food delivery aggregator was Just Eat (England: 31%; Northern Ireland: 16%; Wales: 19%).

Usage of online delivery aggregators varied noticeably by outlet type. Takeaways and sandwich shops were the most likely to use them overall. Looking at trends over time, usage among these outlets increased in England (from 57% in 2024 to 72% in 2025) and in Wales (from 26% to 48%), while remaining relatively stable in Northern Ireland (39% to 42%). Previously, usage had remained relatively stable in 2024 compared to 2023 (the first year that this data was collected).
4.3. Attitudes towards online display
In the telephone survey, businesses were asked which online platforms they felt it should be required by law to display food hygiene ratings on. As shown in Figure 8, the majority of businesses agreed that it should be mandatory to display ratings on at least some online platforms (England: 95%; Northern Ireland: 96%; Wales: 95%). This remains in line with attitudes in both 2024 and 2023
There was limited variation between types of outlet in the support for mandatory display on online platforms. However, in England and Wales, businesses who were part of a chain were more likely to agree with mandatory display on at least one of the online platforms mentioned (98% in both).
Businesses who were supportive of mandatory online display typically felt it would benefit customers, signal that they maintain high standards and would align with existing requirements to display the rating at their physical premises.
“Anybody selling food to the public should let them know food is handled in a safe manner. Places with bad hygiene should not get away with it.”
Retail, Northern Ireland, FHRS rating of 5
“I think it’s all about reputation and it shows that you’re doing the right thing.”
Restaurant/Café/Canteen, Wales, FHRS rating of 2
Amongst the minority of businesses who were not supportive of mandatory online display, some were concerned about the cost or complexity of implementing this as a policy or felt it would not be necessary to have this as a law. Others disagreed with the idea because they felt the rating system was unfair or that customers do not understand how it works.
“Pointless, I think people have the ability to find out info from a business themselves, they don’t need an online rating. People don’t understand what businesses are getting judged on, it’s just a number, and they will see a number and judge.”
Restaurant/Café/Canteen, Northern Ireland, FHRS rating of 5
"In England, you don’t have to display it but in Wales we do, so I don’t understand why that is. If someone wants to know your rating they can go on the Council website [sic].[6] I don’t think having a rating displayed brings any merit."
Pub/Bar/Nightclub, Wales, FHRS rating of 1
4.4. Reported online display
In the telephone survey, a notable proportion of businesses self-reported displaying their FHRS rating online (England: 31%, Northern Ireland: 24%, Wales: 35%). These self-reported figures are considerably higher than those observed in the online audit. The difference may reflect the broader scope of the survey question, which captures display on any online platform, whereas the audit is limited to checks on Facebook, Instagram and businesses’ own websites.
Businesses that reported displaying their FHRS rating online were also asked which platforms they displayed on. Across all three countries, over half of these businesses said they displayed their rating on their own website or social media platform where an online ordering function was available, however due to the low base sizes these findings are indicative only (see Table 9).
4.5. Attitudes towards online display in the future
Businesses in the survey that reported not displaying their rating online were asked if they would consider doing so in the future. Over half of businesses across the three countries agreed that they would: 63% in England, 53% in Northern Ireland and 58% in Wales. Reported openness to displaying ratings online has risen compared to 2024 in England (55% in 2024) and Wales (49% in 2024).
Among businesses that would consider displaying their FHRS rating online, the most common platforms where they would consider display were their websites (England: 58%, Northern Ireland: 45%, Wales: 50%), Facebook (England: 24%, Northern Ireland: 39%, Wales: 34%) and Instagram (England: 17%, Northern Ireland: 24%, Wales: 13%).
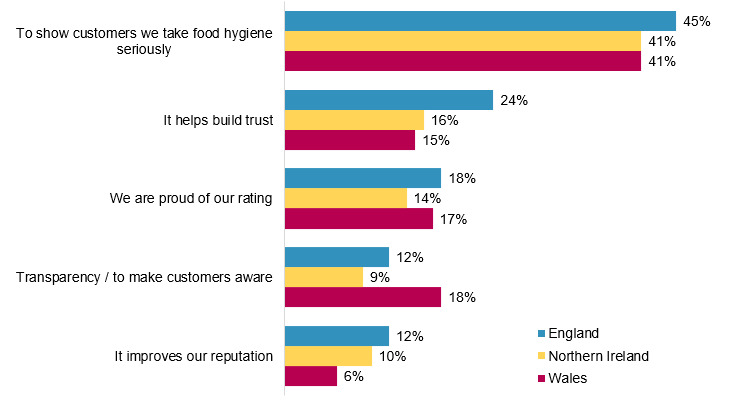
Businesses that reported displaying their rating online were asked why they do so. As shown in Figure 9, the most common reason for online display was to show customers that food hygiene is taken seriously (England: 45%, Northern Ireland: 41%, Wales: 41%).
Over a quarter of businesses not displaying their rating online said that nothing would encourage them to do so (England: 26%, Northern Ireland: 32%, Wales: 28%). Across all three countries combined, retail FBOs (32%) were the business type most likely to say that nothing would encourage them to display online (vs. 28% of takeaways, 25% of restaurants/cafes and 15% of accommodation businesses). Approximately one in seven (14%) businesses in England said they would be encouraged to display their Food Hygiene Rating online if they received a better food hygiene rating (compared to 5% in Northern Ireland and 9% in Wales).
5. Awareness of the scheme and satisfaction with ratings
Awareness of the FHRS among businesses is important to drive and maintain compliance with food hygiene standards. This chapter covers awareness of the scheme in England, Wales and Northern Ireland, and then explores businesses’ satisfaction with their current ratings and perceptions of the minimum rating that they would find satisfactory.
5.1. Awareness of FHRS
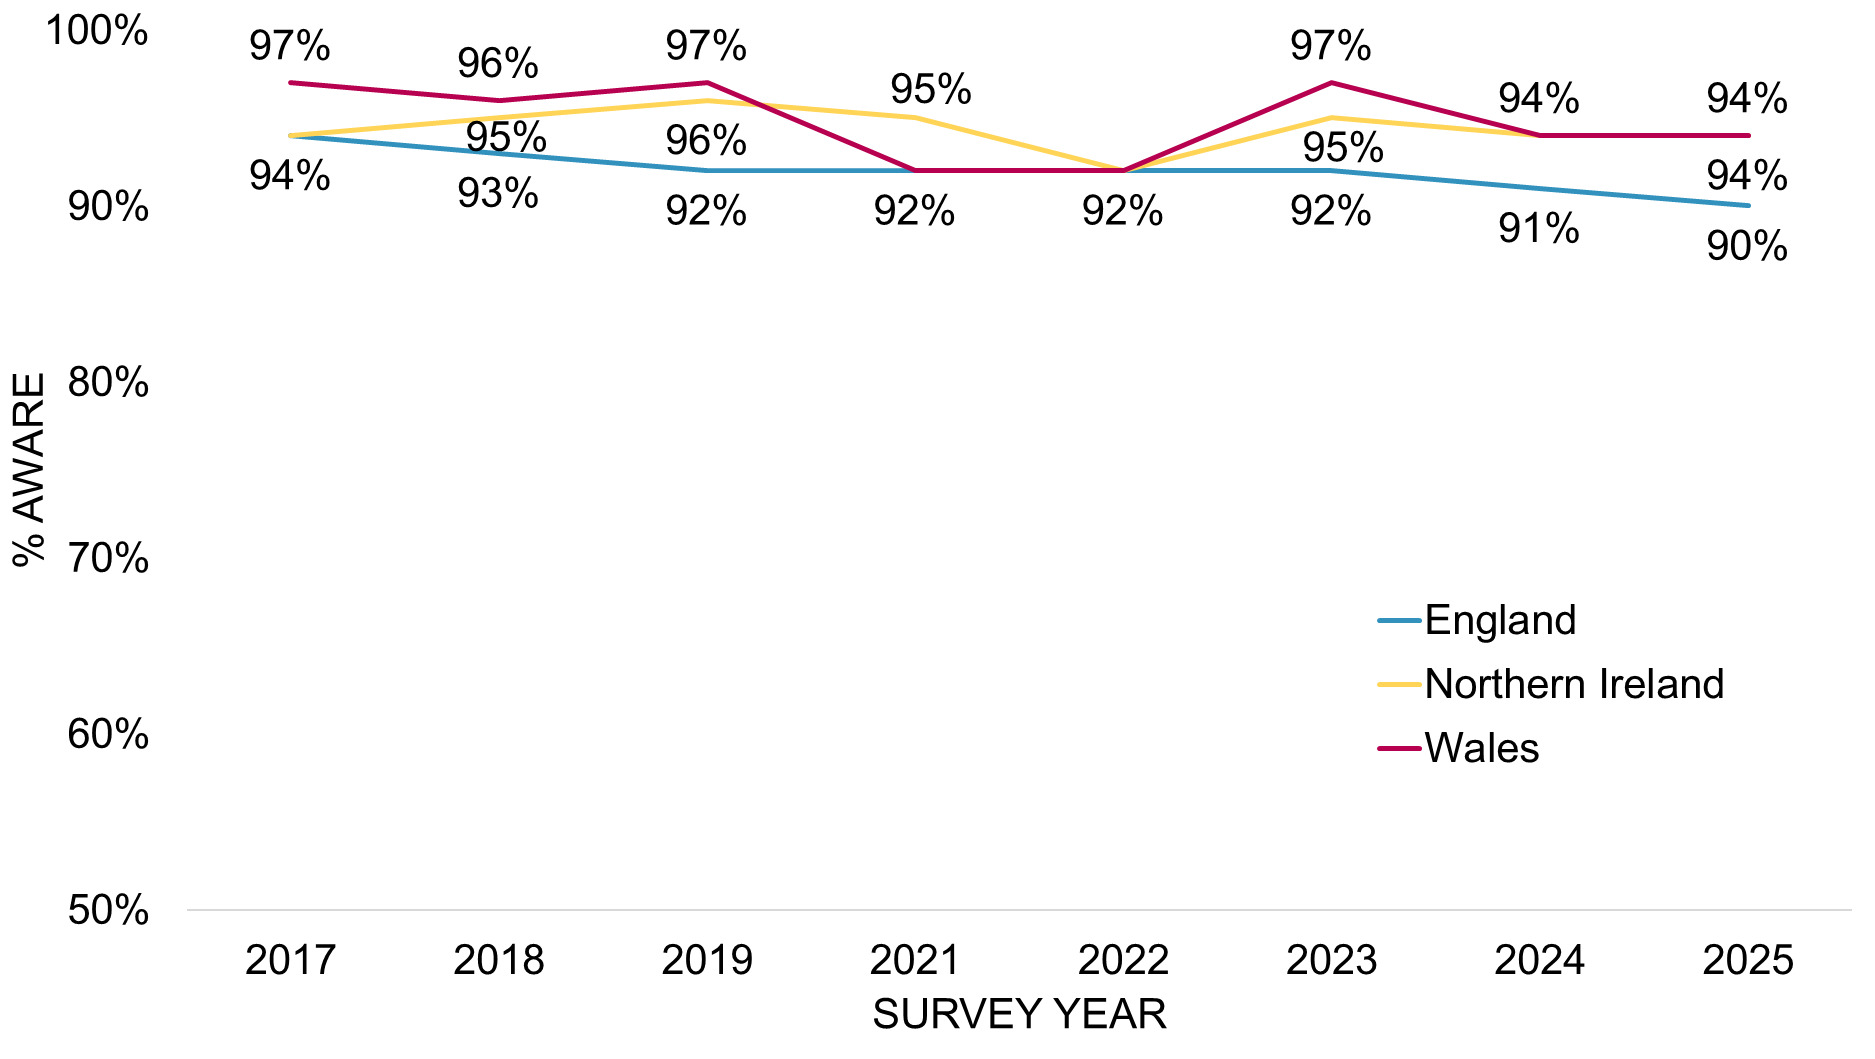
Awareness of the FHRS remained high, with at least nine in ten businesses in England (90%), Northern Ireland (94%) and Wales (94%) reporting that they had heard of the scheme. As in previous years, awareness remains slightly higher in Northern Ireland and Wales than in England, likely reflecting the differences in legal requirements. There have been no statistically significant changes in awareness compared to 2024, and the long term trend has remained relatively stable.
5.2. Satisfaction with food hygiene rating
The vast majority (96%) of businesses were aware of their food hygiene rating, and of these, most were satisfied with this rating, especially in England (91%) and Northern Ireland (91%), as shown in Figure 11. Satisfaction was slightly lower in Wales (86%), which may be linked to the distribution of ratings, as businesses surveyed in Wales were less likely to have a rating of 5 (71% compared to 77% average across England, Northern Ireland and Wales[7]).
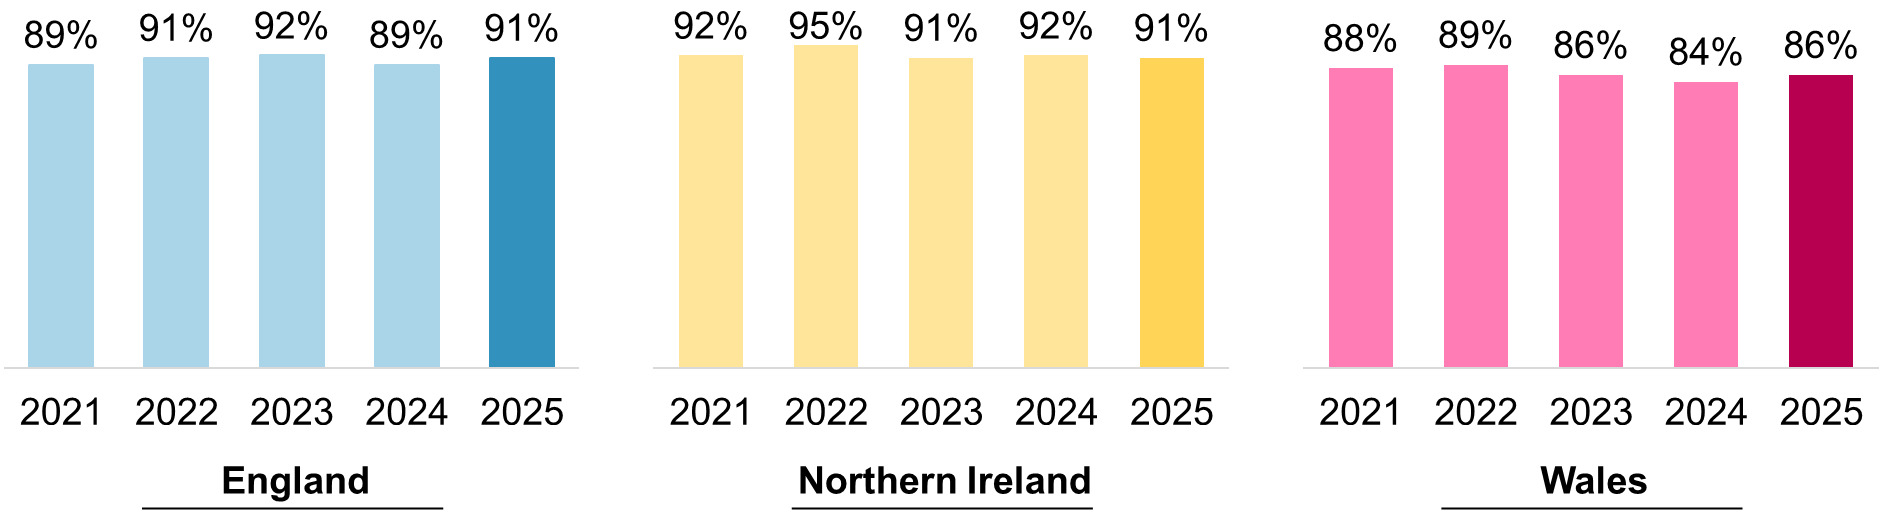
Across all three nations, a relatively small percentage were dissatisfied with their rating: 8% in England, 9% in Northern Ireland and 13% in Wales.
The most common reasons reported by businesses for dissatisfaction included receiving a rating that was low or lower than expected and disagreeing with rating or feeling it was unfair. Additional common reasons reported included: the business being marked down due to their building or damaged equipment; the rating being lowered by a poor score on confidence in management, paperwork or record keeping; and the rating being lower than last time.
5.3. Minimum satisfactory rating
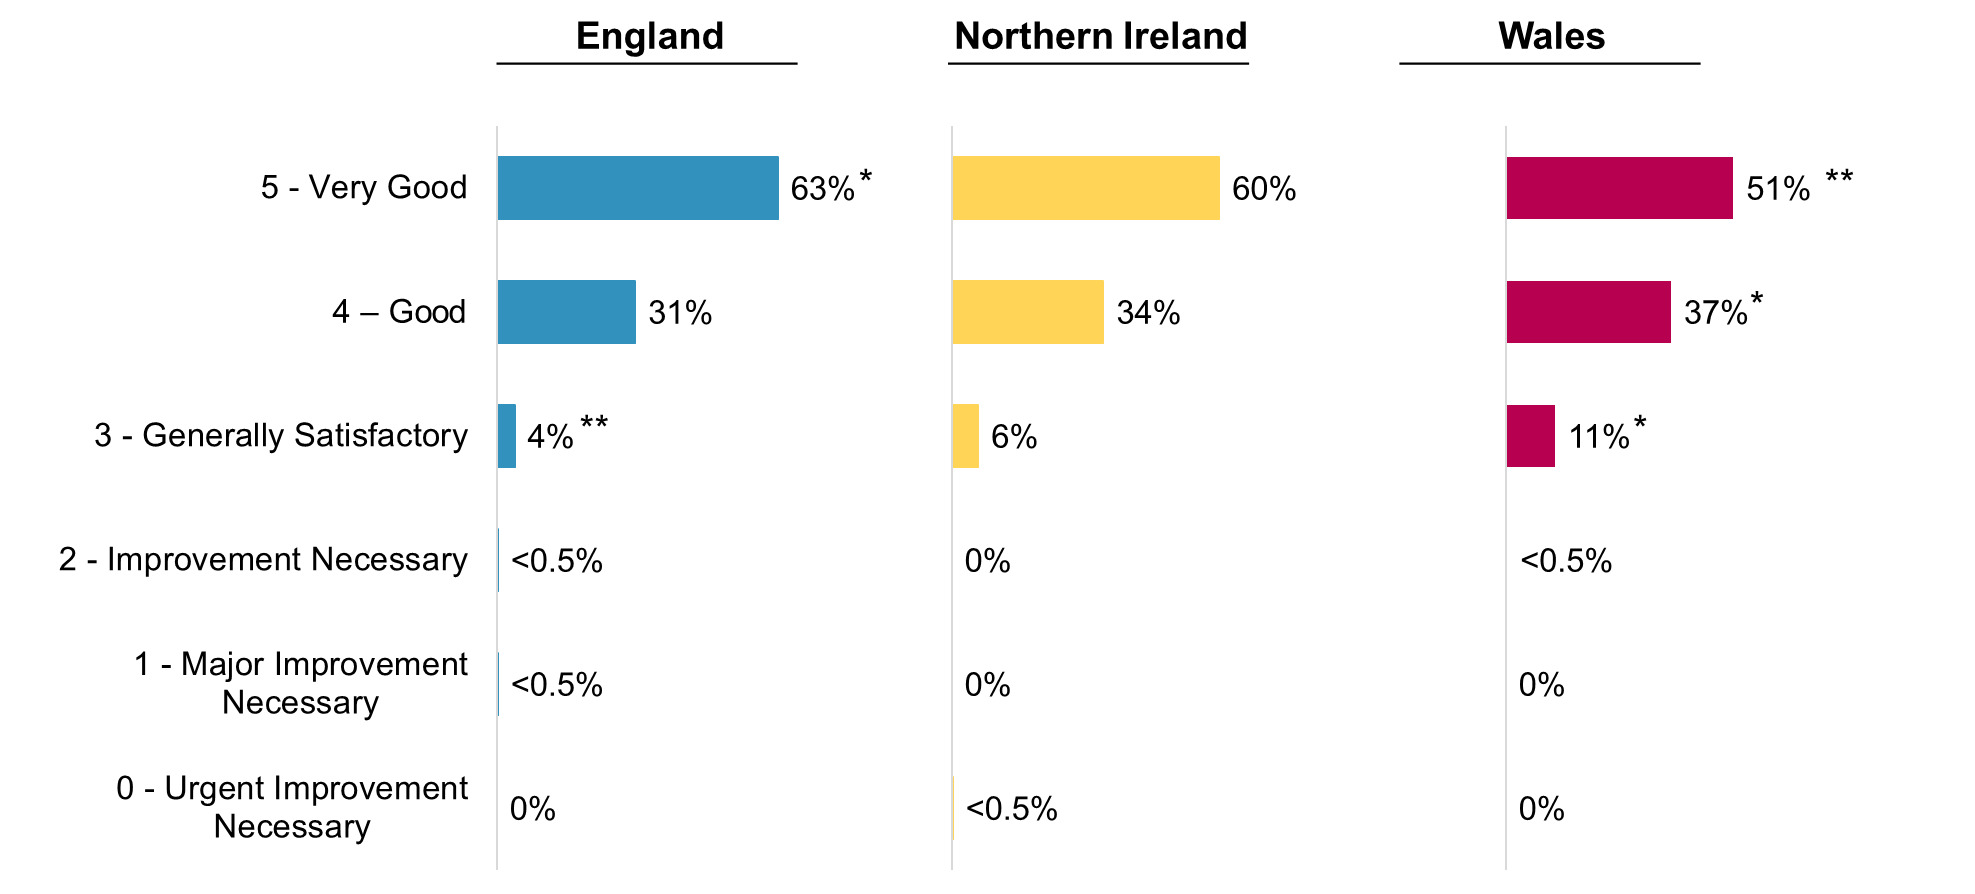
Businesses were asked to specify the lowest food hygiene rating they would be satisfied with. As shown in Figure 12, around six in ten businesses in England (63%) and Northern Ireland (60%) would only be satisfied with a rating of 5. In Wales, this proportion was lower, at around half of businesses (51%).
Around a third of businesses across all three nations would be satisfied with a rating of 4 (England: 31%, Northern Ireland: 34%, Wales: 37%). A further 11% of businesses in Wales said they would be satisfied with a rating of 3, compared with 4% in England and 6% in Northern Ireland.
Across all countries, those currently rated 5 were more likely to say they would only be satisfied with a rating of 5 (77% in England, 69% in Northern Ireland and 65% in Wales).
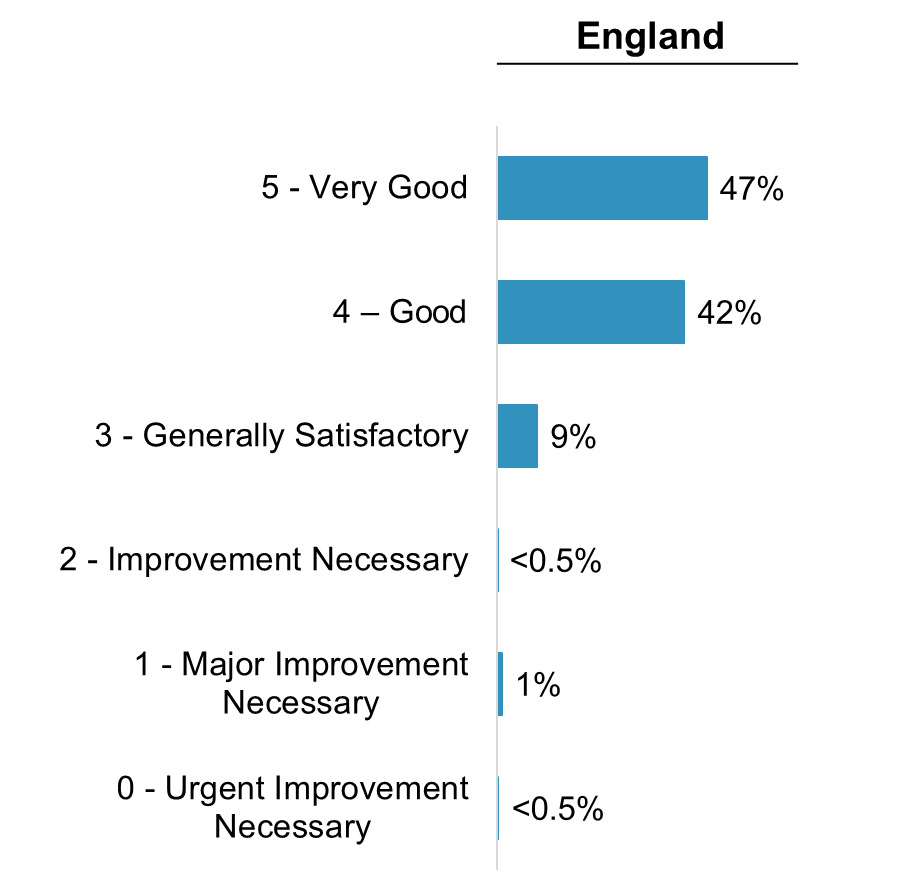
Businesses in England were also asked about the lowest rating they would consider ‘good enough’ to display. Just under half (47%) would only consider a rating of 5 good enough to display, and around four in ten (42%) would be happy to display a rating of 4. Businesses with a rating of 5 were more likely to only be happy to display a rating of 5 (56% compared to 47% overall). This question was not asked in Wales or Northern Ireland, as display is mandatory regardless of rating.
6. Reported display of ratings and reasons for non-display
This chapter covers food businesses’ self-reported display of FHRS stickers from the survey, focussing on comparison with the audit findings covered in Chapter 3 ‘Audit of display of food hygiene rating stickers’. The chapter also reports in detail the reasons some businesses do not display stickers and, amongst those in England where display is not mandatory, any changes that might motivate them to start doing so.
6.1. Reported display of stickers
Businesses that are aware of their FHRS rating were asked if their sticker is displayed somewhere clearly visible to customers. As in previous years, nearly all businesses in Wales (99%) and Northern Ireland (98%) reported it was, but those in England were less likely to report displaying their sticker clearly (86%), as shown in Figure 14. Compared to 2024, the proportion of businesses in Wales reporting their sticker was on display increased from 97% to 99%, although the long term trend remains relatively stable. There were no significant changes amongst businesses in Northern Ireland or England compared to 2024.

Self-reported clear display of FHRS stickers in the telephone survey was higher than observed in the audit across all countries, as shown in Table 10. The discrepancy was highest amongst businesses in England; 86% claimed to display their sticker clearly, but the audit found only 70% did so. These differences were in line with those found in previous waves.[8]
Directly examining any discrepancies amongst the 444 outlets that both completed the telephone survey and were visited in the physical audit, 88% across all three countries reported displaying a rating and were confirmed to be doing so in the audit.[9] In Northern Ireland and Wales, where display is mandatory, the proportion that reported displaying their FHRS rating and the audit confirmed this was notably higher (95%). In contrast, only 76% of businesses in England reported displaying and had this confirmed in the audit.
Exploring the 12% where the survey and audit data conflicted:
-
6% of outlets reported displaying their rating but were found not to be displaying one when audited (this is similar to 8% in 2024, remaining lower than 14% in 2023). This figure rose to 14% among businesses in England, in line with 15% in 2024.
-
4% of outlets reported non-display (rising to 8% in England compared to 1% across Northern Ireland and Wales combined), but two of the 16 businesses were found to be displaying when audited.
-
2% of outlets were unsure of their rating or whether they displayed it during the survey. However, two of these ten outlets were found to be displaying their rating when audited.
More detail on whether businesses report their stickers are clearly visible from outside and at each entrance to premises, and differences by FHRS rating and other factors is available in the data tables (available via the FSA data catalog).
6.2. Reasons for non-display of stickers
Businesses which stated they do not currently display their FHRS rating in a clearly visible location were asked why not and what might encourage them to do so in the future.
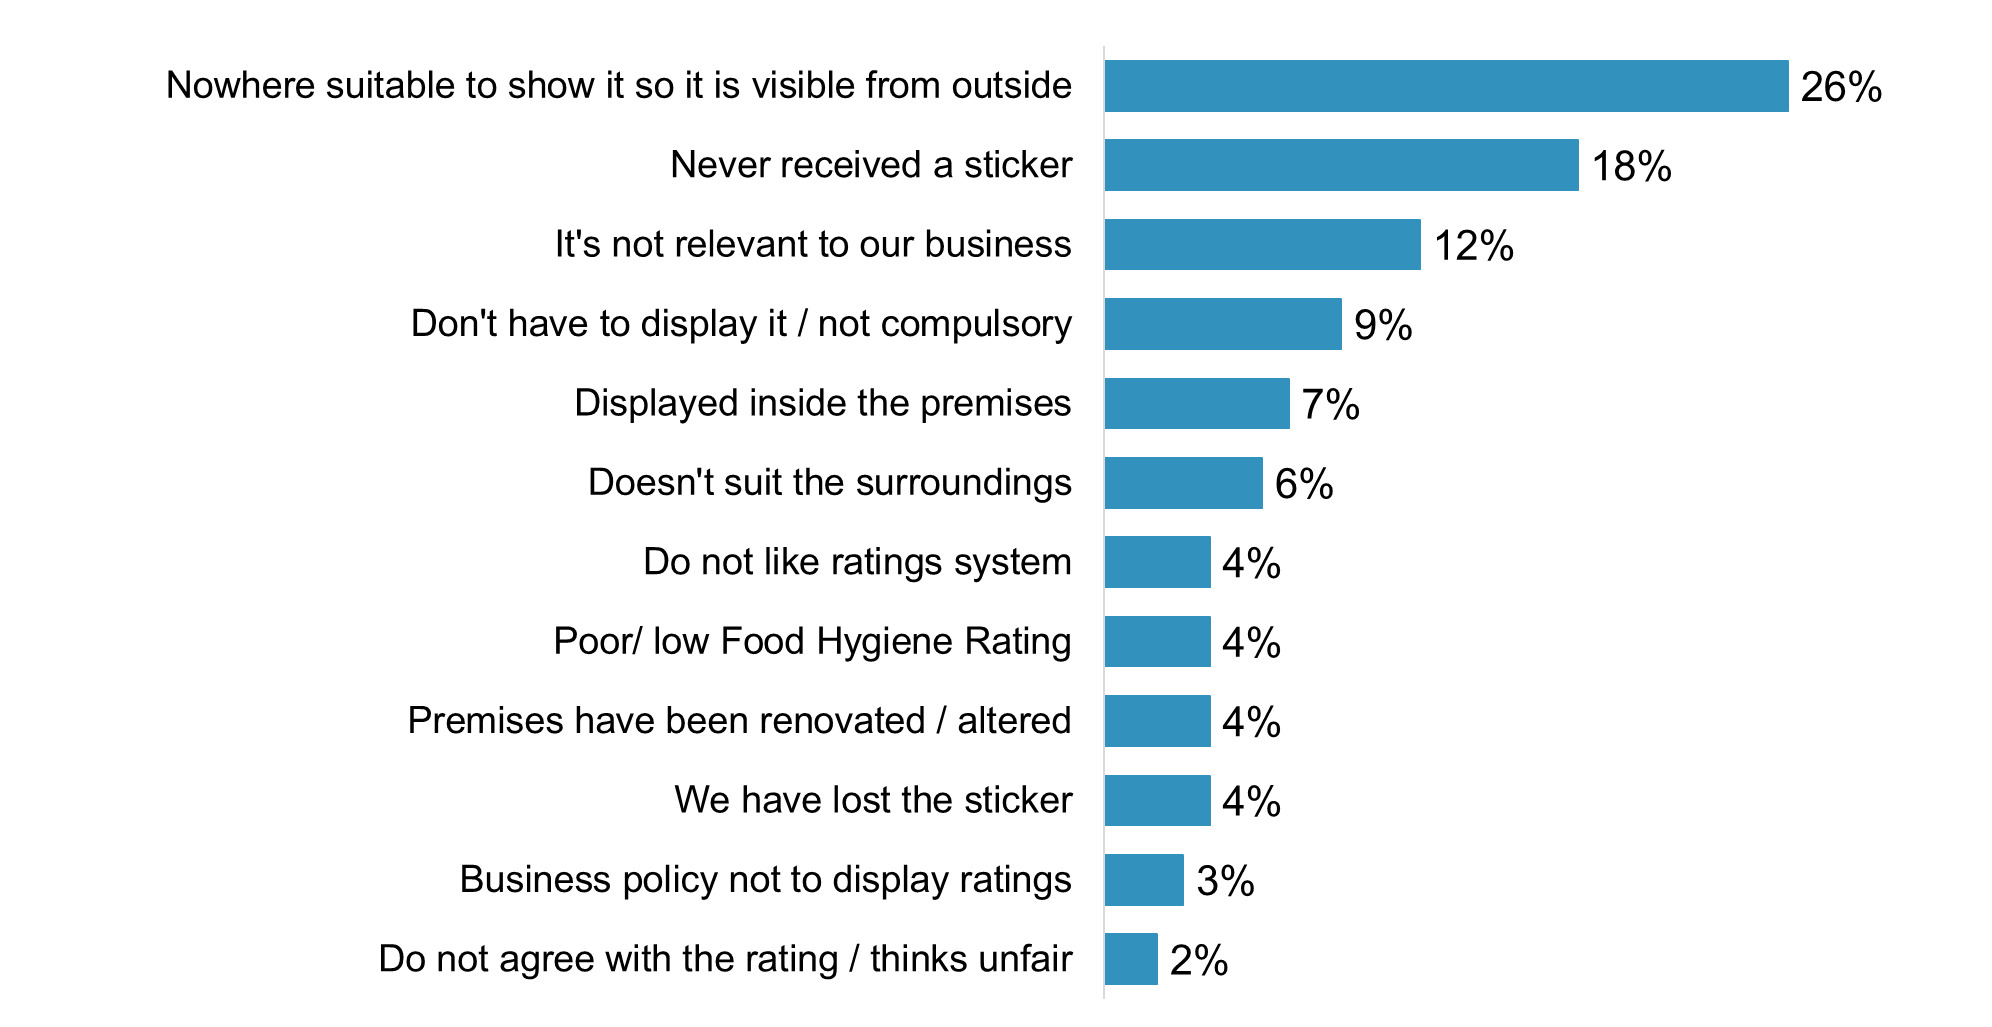
The three most common reasons for non-display among businesses in England were the same as in 2024: having nowhere suitable to show it (26%), never having received a sticker (18%), and thinking it was not relevant to their business (12%), as shown in Figure 15.
.png)
As in previous years, the small proportion of businesses in Wales and Northern Ireland who reported not displaying stickers most commonly explained that this was because there was nowhere suitable to show the sticker; the rating was not relevant to their business or the sticker was only displayed inside the premises.[10]
6.3. Actions to encourage display
Businesses in England not currently displaying their rating were asked what might encourage them to do so. The most common response was they would display it if they had a better FHRS rating (20%), as shown in Figure 16. A small proportion said they would display it if they felt it was relevant to their business (10%), and 8% would do so if it was compulsory. Others reported temporary issues - they had not yet received their sticker (9%) or had lost it and would display a replacement (5%). Small minorities would display it if practicalities could be altered - for 8%, the sticker format could be improved, 7% felt they did not have an appropriate place for it and 3% that the rules of their premises did not allow it.
.svg)
7. Mandatory physical display
This chapter explores awareness and attitudes towards mandatory display of Food Hygiene Rating Scheme (FHRS) stickers. Since 2016 in Northern Ireland and 2013 in Wales, food businesses have been legally required to display their sticker in a prominent place that is visible at every entrance. In England there is currently no legal requirement to display the rating sticker, but businesses are encouraged to do so.
7.1. Awareness of and attitudes towards mandatory sticker display in Northern Ireland and Wales
Awareness of the legal requirement to have a physical FHRS sticker on display remains very high, with 97% of food businesses in Northern Ireland and 98% in Wales who were aware of their rating reporting so, in line with previous years.[11]
At least nine in ten food businesses in Northern Ireland (95%) and Wales (91%) who were aware of their rating felt that the legal requirement to display their FHRS sticker was ‘a good thing’, as shown in Figure 17.
Most believed mandatory display was ‘very good’ (Northern Ireland: 78%; Wales: 75%). The proportion of businesses in Northern Ireland that considered mandatory display to be a good thing was at its highest since the policy was introduced (though not a significant increase from 2024), while the figure in Wales remains in line with previous years’ findings.
Positivity about the legal requirement to display stickers was lower amongst businesses with a rating of less than five in Wales (81% versus 94%) but with almost universal approval in Northern Ireland, this difference was not apparent in 2025.

The main reason for feeling positive about mandatory display in Northern Ireland and Wales was that it helps customers decide where is safe to eat or buy food (27% in Northern Ireland, 34% in Wales). Businesses were significantly more likely to report this than in 2024, as shown in Figure 18. The previous top reason, the importance of transparency with customers about food hygiene shifted to second place (22% in Northern Ireland and 20% in Wales). As in previous years, other common reasons included showing customers that the business has high standards and ensuring trust or confidence among customers.

Amongst the small number of businesses in Northern Ireland and Wales that do not think mandatory display is a good thing, this is most often because they feel there are flaws in the way businesses are scored.[12]
-
In Northern Ireland, 23 businesses did not think mandatory display was a good thing: 20 thought it was neither good nor bad and 3 thought it was bad. This included eight who said there are flaws in the way businesses are scored. No more than four gave any other particular answer.
-
In Wales, 38 businesses did not think mandatory display was a good thing: 34 thought it was neither good nor bad and 4 thought it was bad. This included 14 who said there are flaws in the way businesses are scored, 11 who thought customers do not pay attention to the scores and seven who said it is unfair to some businesses. No more than five gave any other particular answer.
All of those who thought mandatory display was not a good thing as there are flaws in the scoring were smaller businesses (with under 50 staff and not part of a chain) and had a rating of three or above.
7.2. Attitudes towards introducing mandatory sticker display in England
More than eight in ten businesses in England agreed that the introduction of a scheme where they would be required by law to display their FHRS sticker would be a ‘good thing’ (86%), with two thirds (67%) thinking it would be ‘very good’. This level of support has not changed significantly since 2021, as shown in Figure 19.

Businesses in England with the highest rating of 5 were more likely to consider mandatory display to be a good thing (90% compared to 85% with a rating of 4 and 59% with a rating of 3 or less).
As presented in Figure 20, the most common reason for supporting the introduction of mandatory display in England was that it would help customers decide where is safe to eat or buy food (27%), followed by a range of other answers typically centred around the themes of consumer empowerment, transparency and maintaining or improving business standards, with little change from previous years.
.svg)
Among the businesses that were either neutral or had negative perspectives towards mandatory display, the most common reasons were feeling that customers do not pay attention to ratings (21%), there being flaws in the way businesses are scored (21%) and that businesses should not be forced to display (17%), as shown in Figure 21. There were no significant changes since 2024.

8. Awareness and ease of use of safeguards
Once businesses have been inspected by their local authority, they receive a letter or report informing them of their food hygiene rating. If they are rated 0 to 4, the improvements required to achieve the highest rating of 5 are outlined. There are several options for businesses that are dissatisfied with their rating – they have the right to appeal, to reply or to apply for a re-rating inspection.[13] This chapter covers food businesses’ recall of inspection report letters, and amongst businesses rated 0-4, knowledge of and take-up of the available safeguards, including experiences and any barriers.
8.1. Recollection of inspection report letter
Most businesses recalled receiving an inspection report letter, although this varied by country; 87% of businesses in Northern Ireland and 84% in Wales recalled receiving an inspection report letter, whilst recall in England was lower (76%).

Change over time is typically incremental, with no significant change since 2024. However, rates of recall in England have increased back to 76% from a low of 68% in 2023, while across all countries, recall of the letter remains significantly lower in 2025 than the peaks seen in 2018 to 2019.
Combining the three countries, recall of the letter was higher amongst those with a rating of 0 to 4 (82% versus 75% rated 5).[14] Amongst businesses who reported a rating of 0 to 4, nearly all recalled that the inspection report letter told them what improvements they needed to make to achieve a rating of 5. As shown in Figure 23, these figures represented the highest levels since the survey began (95% in England, 97% in Northern Ireland and 92% in Wales).

The results presented in the remainder of this chapter are only from businesses who reported receiving a FHRS rating of 0-4.
8.2. Awareness of safeguards
Awareness of the three safeguards (appeal, the ‘right to reply’ or requesting a re-rating) available to food businesses with a rating between 0 and 4 was relatively high across all three nations as shown in Figure 24. In each country, at least three quarters of businesses who reported ratings of 0 to 4 were aware of each safeguard, although around a fifth were unaware of or unsure about of the right to reply (23% in Northern Ireland, 22% in England and 20% in Wales).

8.3. Use and experience of safeguards
Food businesses that reported being rated 0 to 4 and were aware of the safeguards were asked if they had taken up any of the three options following their most recent inspection.
8.3.1. Appealing ratings
Less than a fifth of those rated below 5 who were aware of the option to appeal reported appealing their rating (England 14%; Northern Ireland 12%; Wales 18%) – see Figure 25. In both Northern Ireland and Wales, the proportion appealing their rating had risen since 2024, whilst in England it remained similar to 2024. The rate of appeal amongst those dissatisfied with their rating was relatively low (9% overall, rising to 27% in Wales).

8.3.2. Exercising a right to reply
The ‘right to reply’ was the safeguard businesses were most likely to have reported using in England (17%), and Northern Ireland (15%), and is equally as likely to have been used as an appeal in Wales (17%) – see Figure 26. There were no significant differences in exercising the right to reply since 2024, nor between the three countries.

Businesses with a rating of 0-3 were more likely to have exercised their ‘right to reply’ (28% compared to 10% with ratings of 4).
Those dissatisfied with their rating were more likely to take-up the right to reply than other safeguard options (14% compared to 8% who applied for a re-rating and 9% who appealed). However, the proportion of dissatisfied businesses who exercised the ‘right to reply’ had fallen compared to 2024 (14% compared to 30% in 2024). Businesses who are part of a chain were more likely to have exercised their ‘right to reply’ (27% compared to 14% which were not chains).
8.3.3. Applying for a re-rating
Applying for a re-rating was the safeguard businesses rated 0 to 4 reported as least likely to be used in England (3%) and Wales (9%), and as unlikely as an appeal in Northern Ireland (12%), as shown in Figure 27. The likelihood of applying for a re-rating in England has decreased significantly since 2024 (3% down from 13%) and is less likely to have been utilised in England than in Northern Ireland and Wales.

Compared to 2024, a smaller proportion of those dissatisfied with their rating applied for a re-rating (8% versus 19% in 2024). This is likely to be driven by an overall reduction of England businesses applying for a re-rating.
The interviewee’s role and the business structure may have influenced knowledge of safeguard use. Managers, owners and proprietors were more likely to report use of appeals and the right to reply (17% and 21% respectively versus 4% and 3% of head chefs, cooks and others), with managers also more likely to request a re-rating (6% compared to less than 1% of others). Amongst chain businesses, a notable proportion were unsure whether each safeguard had been used (between 17%-19%).
8.4. Non-use of safeguards
Businesses that did not use safeguards despite being dissatisfied with their rating of 0 to 4 and being aware of them were asked why. Sample sizes by each individual country are low so the following results are presented for all three countries combined.[15]
8.4.1. Reasons for not appealing ratings
The most common reasons given for not appealing their ratings of 0 to 4 despite reporting dissatisfaction in the survey were because they were making the required changes (24%), had accepted the rating given[16] (18%), or were waiting until their next inspection (17%). Fees (12%) were also mentioned as a barrier for a minority of businesses; this indicates a lack of understanding around the appeals process as there are no fees related to appealing ratings.
.svg)
8.4.2. Reasons for not exercising right to reply
Feeling that their rating did not matter enough (17%) was the most common reason given for not exercising the right to reply. A similar proportion (16%) of businesses accepted the rating given, despite not being satisfied with it (in line with the 18% who also did not appeal for the same reason). 9% mentioned cost as a barrier to use (despite there being no cost associated with exercising this safeguard), and similar proportions (6%) of businesses cited a lack of time, other priorities, not thinking it was necessary to do, and using a different safeguard.

8.4.3. Reasons for not applying for a re-rating
Being in the process of making the necessary changes was the most common reason for not applying for a re-rating (35%) among businesses rated 0 to 4, dissatisfied with their rating, and aware of the safeguard. However, a quarter (24%) were happy to wait until the next inspection and 18% reported the associated fees as a barrier. 11% felt it did not matter enough to apply for an earlier re-inspection (see Figure 30).

9. Impacts of the scheme
This chapter covers businesses’ attitudes towards the Food Hygiene Rating Scheme (FHRS) and how important it is to them, as well as their perceptions of its impact on the business and its customers.
9.1. Perceptions of FHRS ratings
Nearly all businesses with FHRS ratings felt they were important to their business: 96% in England, 94% in Northern Ireland and 93% in Wales. In all three countries, over four-fifths felt it was ‘very’ important (between 82% and 83%). These findings are in line with 2024, and the difference by country was not statistically significant.
The display of FHRS ratings was widely perceived as having a positive impact on food businesses. Across all three countries, at least two-thirds of businesses who display their sticker agreed with the statements shown in Figure 31 to 33.


Nearly all businesses in each country with their FHRS on display agreed they work hard to maintain/ improve their FHRS rating (99% in England, 98% in Northern Ireland, 97% in Wales), and were proud of their rating (95% in England, 94% in Northern Ireland, 88% in Wales). Over 90% in each country also agreed that having a good rating is attractive to customers, it shows them that the business takes food hygiene seriously and helps inform them about the business’s hygiene standards.
Businesses in each country were a little less likely to agree that a higher rating gives them a competitive advantage over those with lower ratings, although still at least three quarters did agree (83% in England, 82% in Northern Ireland and 77% in Wales). Closer to two-thirds agreed that displaying ratings attracted more customers (69% in England and Northern Ireland; 66% in Wales).
Businesses in England were more likely than those in Wales to agree with six of the nine statements, most notably that they were proud of their rating (95% England, 88% Wales) and that it reflected the actual standard of the business (94% England, 84% Wales).
9.2. Changes made as a result of ratings
Across all three nations, most food businesses that reported receiving a FHRS rating of 4 or less were making changes to try to improve their rating (England 82%; Northern Ireland 80%; Wales 83%). These figures are broadly in line with 2024 (89%, 78% and 80% respectively).
Table 11 shows the most common changes made by country. The top two changes in each country were improving documentation and undertaking repairs or improvement works. Cleaning of the workplace/premises was also relatively common, followed by purchasing additional equipment. The variations in implementation rates for specific changes between countries in 2025 are not statistically significant.
10. Low-rated audit (FBOs rated 0-2 in England only)
The main audit of Food Business Operators provides a robust and representative estimate of Food Hygiene Rating Scheme rating display rates among certain businesses across England, Northern Ireland and Wales. FBOs with an FHRS rating of between 0 and 2 constitute only 3% of the underlying population. This results in only a small number of ‘lower-rated’ businesses being included in the main audit, meaning the main audit cannot provide detailed or reliable analysis for this group. To strengthen understanding of display behaviours among lower-rated businesses in England, the FSA commissioned a targeted audit focused specifically on this group in England only. This chapter presents the findings from this work.
10.1. Rates of display among low rated outlets
Only 18% of businesses in England with an FHRS rating of between 0 and 2 were displaying a sticker at the time of the audit. As display of rating stickers at premises is not mandatory in England, this low level of display is not unexpected. However, comparison with the FHRS database shows that of the 18% displaying a rating sticker, almost all of those were displaying an invalid rating at time of audit: of the 71 businesses displaying an FHRS sticker, only one was found to be displaying a valid rating – a business rated 2, displaying a ‘2 – Improvement Necessary’ sticker.[17]
Figure 34 presents the ratings that were actually on display among outlets displaying a sticker. Just over two fifths (42%) were displaying a rating of 5, while a similar proportion (37%) were displaying a 4. Just over one in ten (11%) displayed a 3, seven percent displayed an ‘Awaiting Inspection’ sticker, and a small minority (3%) were displaying a rating of 2.

Evidently, given all outlets in this sample were rated between 0 and 2, comparison with the FHRS database shows that the majority of businesses in the low rated audit with a sticker on display (93%) were displaying a rating higher than their current valid rating. A further 7% were displaying an “awaiting inspection” sticker.
To understand why such a large proportion low rated outlets with a sticker on display were displaying invalid ratings at the time of audit, the FSA reviewed historic FHRS records to determine whether these outlets had previously held higher ratings. This review suggested that for most of the 70 businesses displaying an invalid rating, the sticker displayed appeared to relate to an inspection at some earlier point in time, rather than the most recent inspection.
Looking at the profile of businesses displaying a sticker, there was limited variation by outlet type. However, display did vary by rating: only 9% of outlets rated 0 were displaying a sticker, compared with 16% of those rated 1 and 22% of those rated 2. It is important to note that this should be interpreted in the context of the wider finding that almost all outlets displaying a sticker were displaying an invalid rating at the time of the audit.
Where stickers were displayed, their placement was typically in locations that were readily accessible to customers. Nearly all displayed stickers in a clearly visible location (96%) and positioned so that it was visible from outside the premises (92%). Again, these placement patterns should be considered alongside the accuracy issues noted above: visibility was high, but the information being displayed was often incorrect.
10.2. Fieldwork challenges
The greater variability in ratings among lower-rated businesses also presented additional challenges from a fieldwork perspective. Fifty-two businesses had to be excluded from the sample at the analysis stage because they had received a higher rating (3+) in the period between initial sampling and the audit visit and were therefore out of scope. Further details of the sampling approach used to minimise this time-lag are provided in the accompanying technical report.
Alongside this rating changeover, auditors encountered a higher-than-expected proportion of outlets that were closed or otherwise inaccessible, which reduced the achieved sample size below the original target. In total, 77 cases were removed because the business was closed or inaccessible at the time of the audit visit.
Among cases where auditors were unable to complete an assessment, the most common reason was that the business was closed despite advertised online opening hours indicating it should have been open. This was followed by instances where the business was no longer operating at the listed address. A smaller number of cases involved businesses that had ceased trading altogether and appeared to be permanently closed. A breakdown of these outcomes is presented in Table 12.
11. Limitations
The 2025 wave of the FHRS telephone survey and audit achieved the research objectives as set out in the introduction of this report. However, some challenges were encountered during the project fieldwork and analysis stages:
-
Efforts have been made to compare findings from both the main audit and the telephone survey. However, these comparisons should be treated with caution as both data sources could be subject to potential bias and inaccuracies (self-reports and observations from auditors).
-
Several types of food businesses were excluded from this research (e.g. home caterers, dark kitchens[18], university canteens etc.) if they did not meet eligibility criteria (operating from premises not accessible to consumers or not operating from a fixed premises at all). This means the data is not fully representative of all food businesses who are supplied with a FHRS rating.
-
For the telephone survey, a telephone match rate of 47% was achieved. The match rate showed some variation across FBO characteristics such as sector and rating (full details on this variation can be found in the accompanying technical report). It is possible that the achieved telephone sample differs in slightly from the full population in unobserved ways that are not corrected through weighting. This may introduce some bias, the extent of which cannot be determined and should be considered when interpreting the telephone survey results.
-
Quality assurance checks carried out both during and following completion of main audits resulted in a total of 11 businesses being removed from the main audit data. This was due to auditor input error or discrepancies between the information logged during the audit and pictures taken by the auditor. Although the achieved sample size was slightly reduced, this has not affected the statistical reliability of the findings. Additionally, the correction of these errors should enhance confidence in the robustness of the findings.
-
During low-rated audit fieldwork, a high rate of unexpected closures of businesses meant that less than the original target of 500 audits were conducted (the final number achieved was 413 low-rated audits). As with the mainstage audit findings, this slightly reduced achieved sample has not impacted the statistical reliability of the data.
-
The main audit was conducted slightly later compared to previous years, to allow auditors to initially focus on the low-rated audit. This resulted in less overlap of the telephone survey and main audit fieldwork periods this year and limited the ability to maximise overlap between records featured in both the survey and the main audit (444 compared to 575 in 2024). This also contributed to the increased possibility of some businesses’ ratings being updated between sampling and the audit taking place. However, as these higher rated businesses are inspected less frequently, we would expect the impact due to a difference in timeframe on findings to be limited.
-
The online audit was only conducted across three key platforms (businesses own website, their Facebook business page and Instagram profile) commonly used by food businesses. Business presence or rating display on other platforms was not captured, meaning online audit figures cannot be directly compared to self-reported online display from the telephone survey, or generalised to all online rating display.
-
There are other limitations to be considered with telephone surveys. There is the potential to exclude those with accessibility needs which limit their telephone use (i.e. those who are hearing impaired); and as already mentioned, social desirability bias means respondents may provide responses that present their businesses more favourably. This means the telephone survey results give a useful indication of the views and behaviours among those who were reachable and participated and should not be treated as perfectly accurate measures of FBO behaviour or compliance.
12. Conclusions
The 2025 FHRS Survey and Audit confirms that engagement with the Scheme remains strong across England, Northern Ireland and Wales. Awareness of the Scheme and understanding of individual ratings continue to be high, and most businesses recognise the FHRS as important for maintaining standards, building customer trust and playing a role in motivating improvement.
Mandatory display continues to have a clear and sustained impact on transparency. In Wales and Northern Ireland, where display is legally required, high levels of display were observed (95% and 92% respectively). In contrast, display rates in England - where display remains voluntary - were substantially lower (70%). However, display rates in England are still markedly higher than in earlier years, and have increased steadily from 55% in 2017. Support for introducing mandatory display in England is also high at 86%. The evidence continues to suggest that mandatory display reduces the extent to which display behaviour varies by rating, thus increasing transparency for customers, and helping ensure they can make informed choices regardless of business rating.
The targeted audit of low-rated businesses in England revealed that few displayed a sticker (18%). This is unsurprising given that businesses receiving low ratings are not compelled to display under the voluntary scheme. This is shown in the business survey where the majority of businesses in England considered only a rating of 5 (47%) or 4 (42%) good enough to display, with 9% considering a rating of 3 and less than 2% a rating of 2 or below. Of the 18% of lower rated businesses (n=71) displaying a rating, almost all were displaying an invalid rating at the time of audit. Checks against the FHRS database indicated that the majority of these were likely displaying a rating from the previous or an earlier inspection.
There continued to be widespread use of social media and food business websites as seen in previous waves, but only a small proportion of businesses facilitated online orders through these platforms, and even fewer displayed an FHRS rating on them. It was most common across all three countries for businesses to facilitate food orders through their own websites, compared to Facebook business pages and Instagram profiles. Despite this, businesses continued to show strong support for mandatory online display across the three nations, indicating readiness for clearer and more consistent expectations in digital environments.
Awareness of FHRS safeguards (appeal, the ‘right to reply’ or requesting a re-rating) was high, but reported use remained limited. Limited use was largely driven by acceptance of ratings or a focus on improvement, suggesting safeguards are understood but not viewed as necessary to use by most businesses.
Comparisons to the FHRS database were made at a single point in time and are based on the data provided by local authorities to the FSA. Temporary mismatches between displayed and FHRS database ratings may occur for valid reasons, although these are expected to represent only a small minority of cases.
Comparisons to the FHRS database were made at a single point in time and are based on the data provided by local authorities to the FSA. Temporary mismatches between displayed and FHRS database ratings may occur for valid reasons, although these are expected to represent only a small minority of cases.
Small base sizes reduce the stability and reliability of the data and therefore are subject to wider margins of error and greater variability. Results may not reflect true differences within the population and differences seen may be due to chance. Results with low bases sizes should not be used for detailed comparisons and should be considered directional only.
Due to the time elapsed between sampling and fieldwork, where ratings observed at the time of audit did not match the data on the FHRS database, the FSA conducted an internal review to verify the valid rating at the time of the audit. These comparisons to the FHRS database were made at a single point in time, based on the data provided by local authorities to the FHRS database. Temporary mismatches between displayed and database ratings may occur for valid reasons, although these are expected to represent only a small minority of cases.
Here, online presence refers to having a Facebook business page, an Instagram page, or the business having its own website.
Ratings for FBOs who have undergone an inspection can be found at the FSA’s website: Search for ratings | Food Hygiene Ratings.
77% of surveyed FBOs from England and 81% of surveyed FBOs from Northern Ireland were rated 5.
This discrepancy between stated and observed display rates can likely be attributed to social desirability bias. Businesses may report displaying their FHRS sticker even if they do not to align with perceived norms or avoid potential scrutiny. Some businesses may believe their sticker is on display, unaware that it is no longer visible.
It should be noted that these proportions are based on unweighted data. This is because the weights applied to survey and audit data are to make results representative of the target population within each country, rather than the full population of England, Northern Ireland and Wales.
As there are high rates of public display in Northern Ireland and Wales the number of businesses asked about non-display was low (n=31 Northern Ireland, n=24 Wales), and therefore findings should be treated indicatively.
As nearly all businesses knew their rating (see Chapter 5.1 ‘Awareness of FHRS’ above), this equates to 96% of all food businesses in Northern Ireland and 98% in Wales being aware of the requirement.
Integer figures are presented unweighted due to the very low base sizes.
A ‘right to reply’ allows businesses to tell customers how their business has improved its hygiene standards or if there were unusual circumstances at the time of inspection. This response is published online, alongside the rating, by the local authority. Businesses can ‘appeal’ an FHRS rating if they think that the rating does not reflect the hygiene standards observed at the time of inspection or if the rating criteria were applied incorrectly. If a business makes the improvements to hygiene standards that food safety officers raised at their last inspection, businesses can request a ‘re-rating’ visit.
At individual country level, these differences are not significant (81% rated 0 to 4 versus 74% rated 5 in England, 89% versus 84% in Northern Ireland and 88% versus 86% in Wales).
Non-use of appeals (England n= 27; Northern Ireland n= 21; Wales n= 37), right to reply (England n= 19; Northern Ireland n= 17; Wales n= 31) and re-ratings (England n= 25; Northern Ireland n= 22; Wales n= 46).
Examples of verbatims included under the code ‘Accepted the rating’ mentioned it not being worth appealing to move from rating of 4 to 5, understanding why they received the rating awarded and thinking the points in the inspection report were fair.
Due to the time elapsed between sampling and fieldwork, where ratings observed at the time of audit did not match the data on the FHRS database, the FSA conducted an internal review to verify the valid rating at the time of the audit. These comparisons to the FHRS database were made at a single point in time, based on the data provided by local authorities to the FHRS database. Temporary mismatches between displayed and database ratings may still have occurred for valid reasons, although these are expected to represent only a small minority of cases.
A dark kitchen is defined as a tech-enabled commercial kitchen operating primarily for delivery, to fulfil remote, on-demand, consumer online orders of food for immediate consumption.