

Consumer Insights Tracker - July to September 2026 Report
1. Key findings
Key findings for July to September 2026:
-
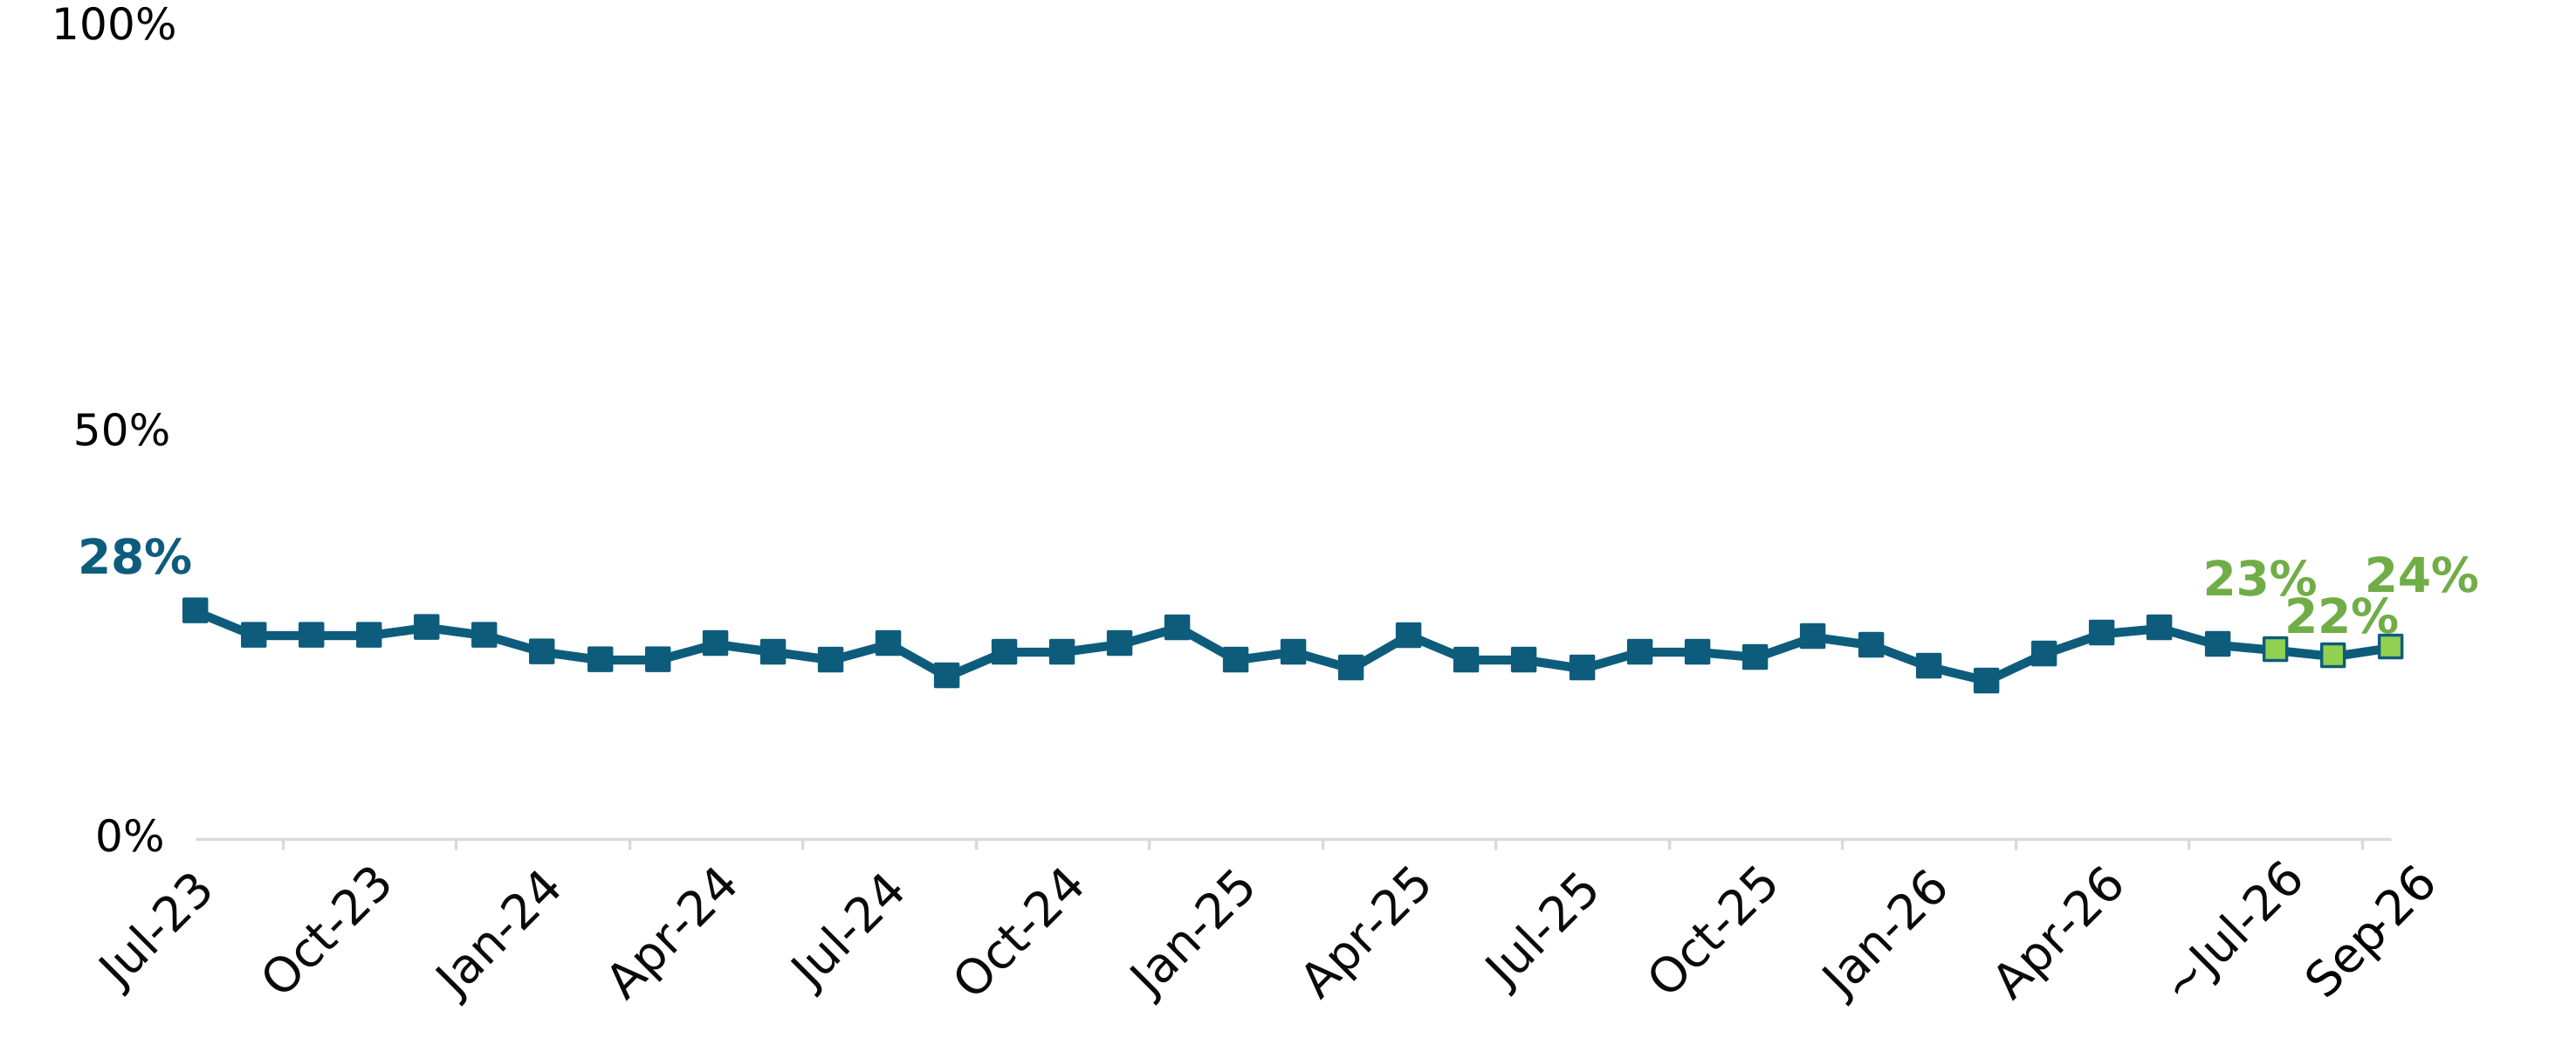
Food affordability: The proportion of respondents who reported worrying about their household not being able to afford food remained stable between July and September 26 (22%-24%), broadly in line with the previous quarter (24%-26%).
-
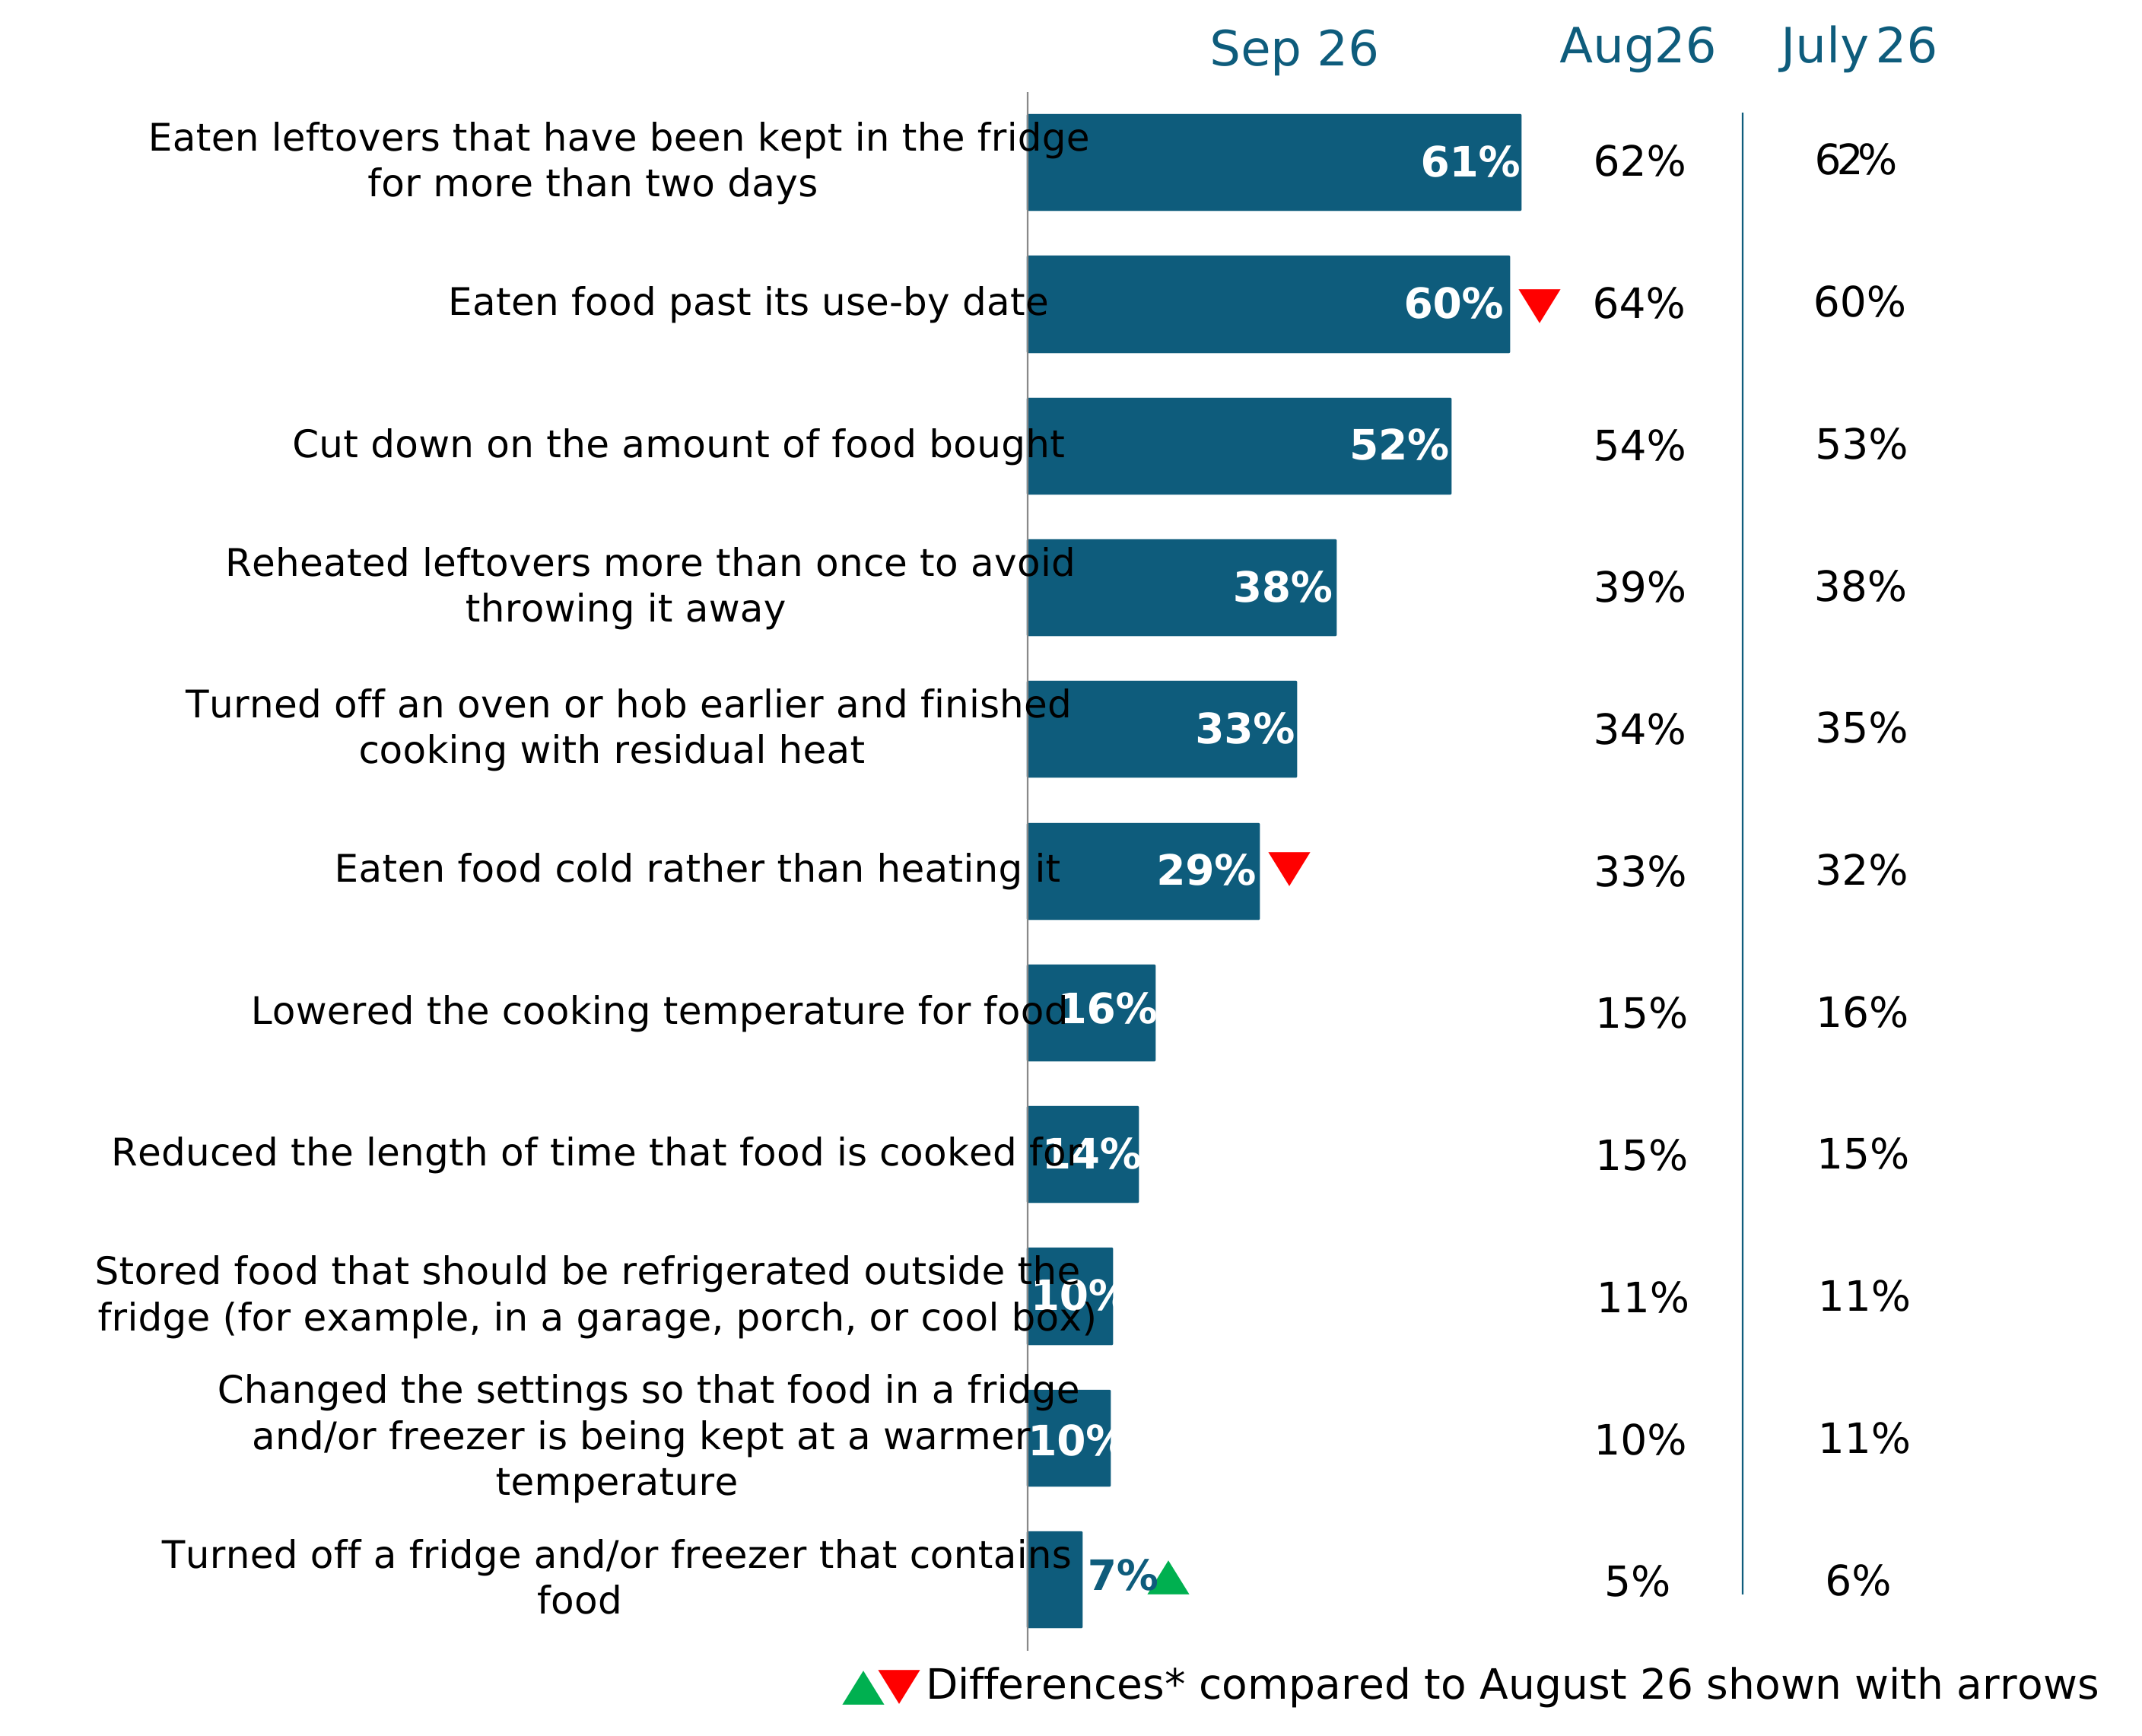
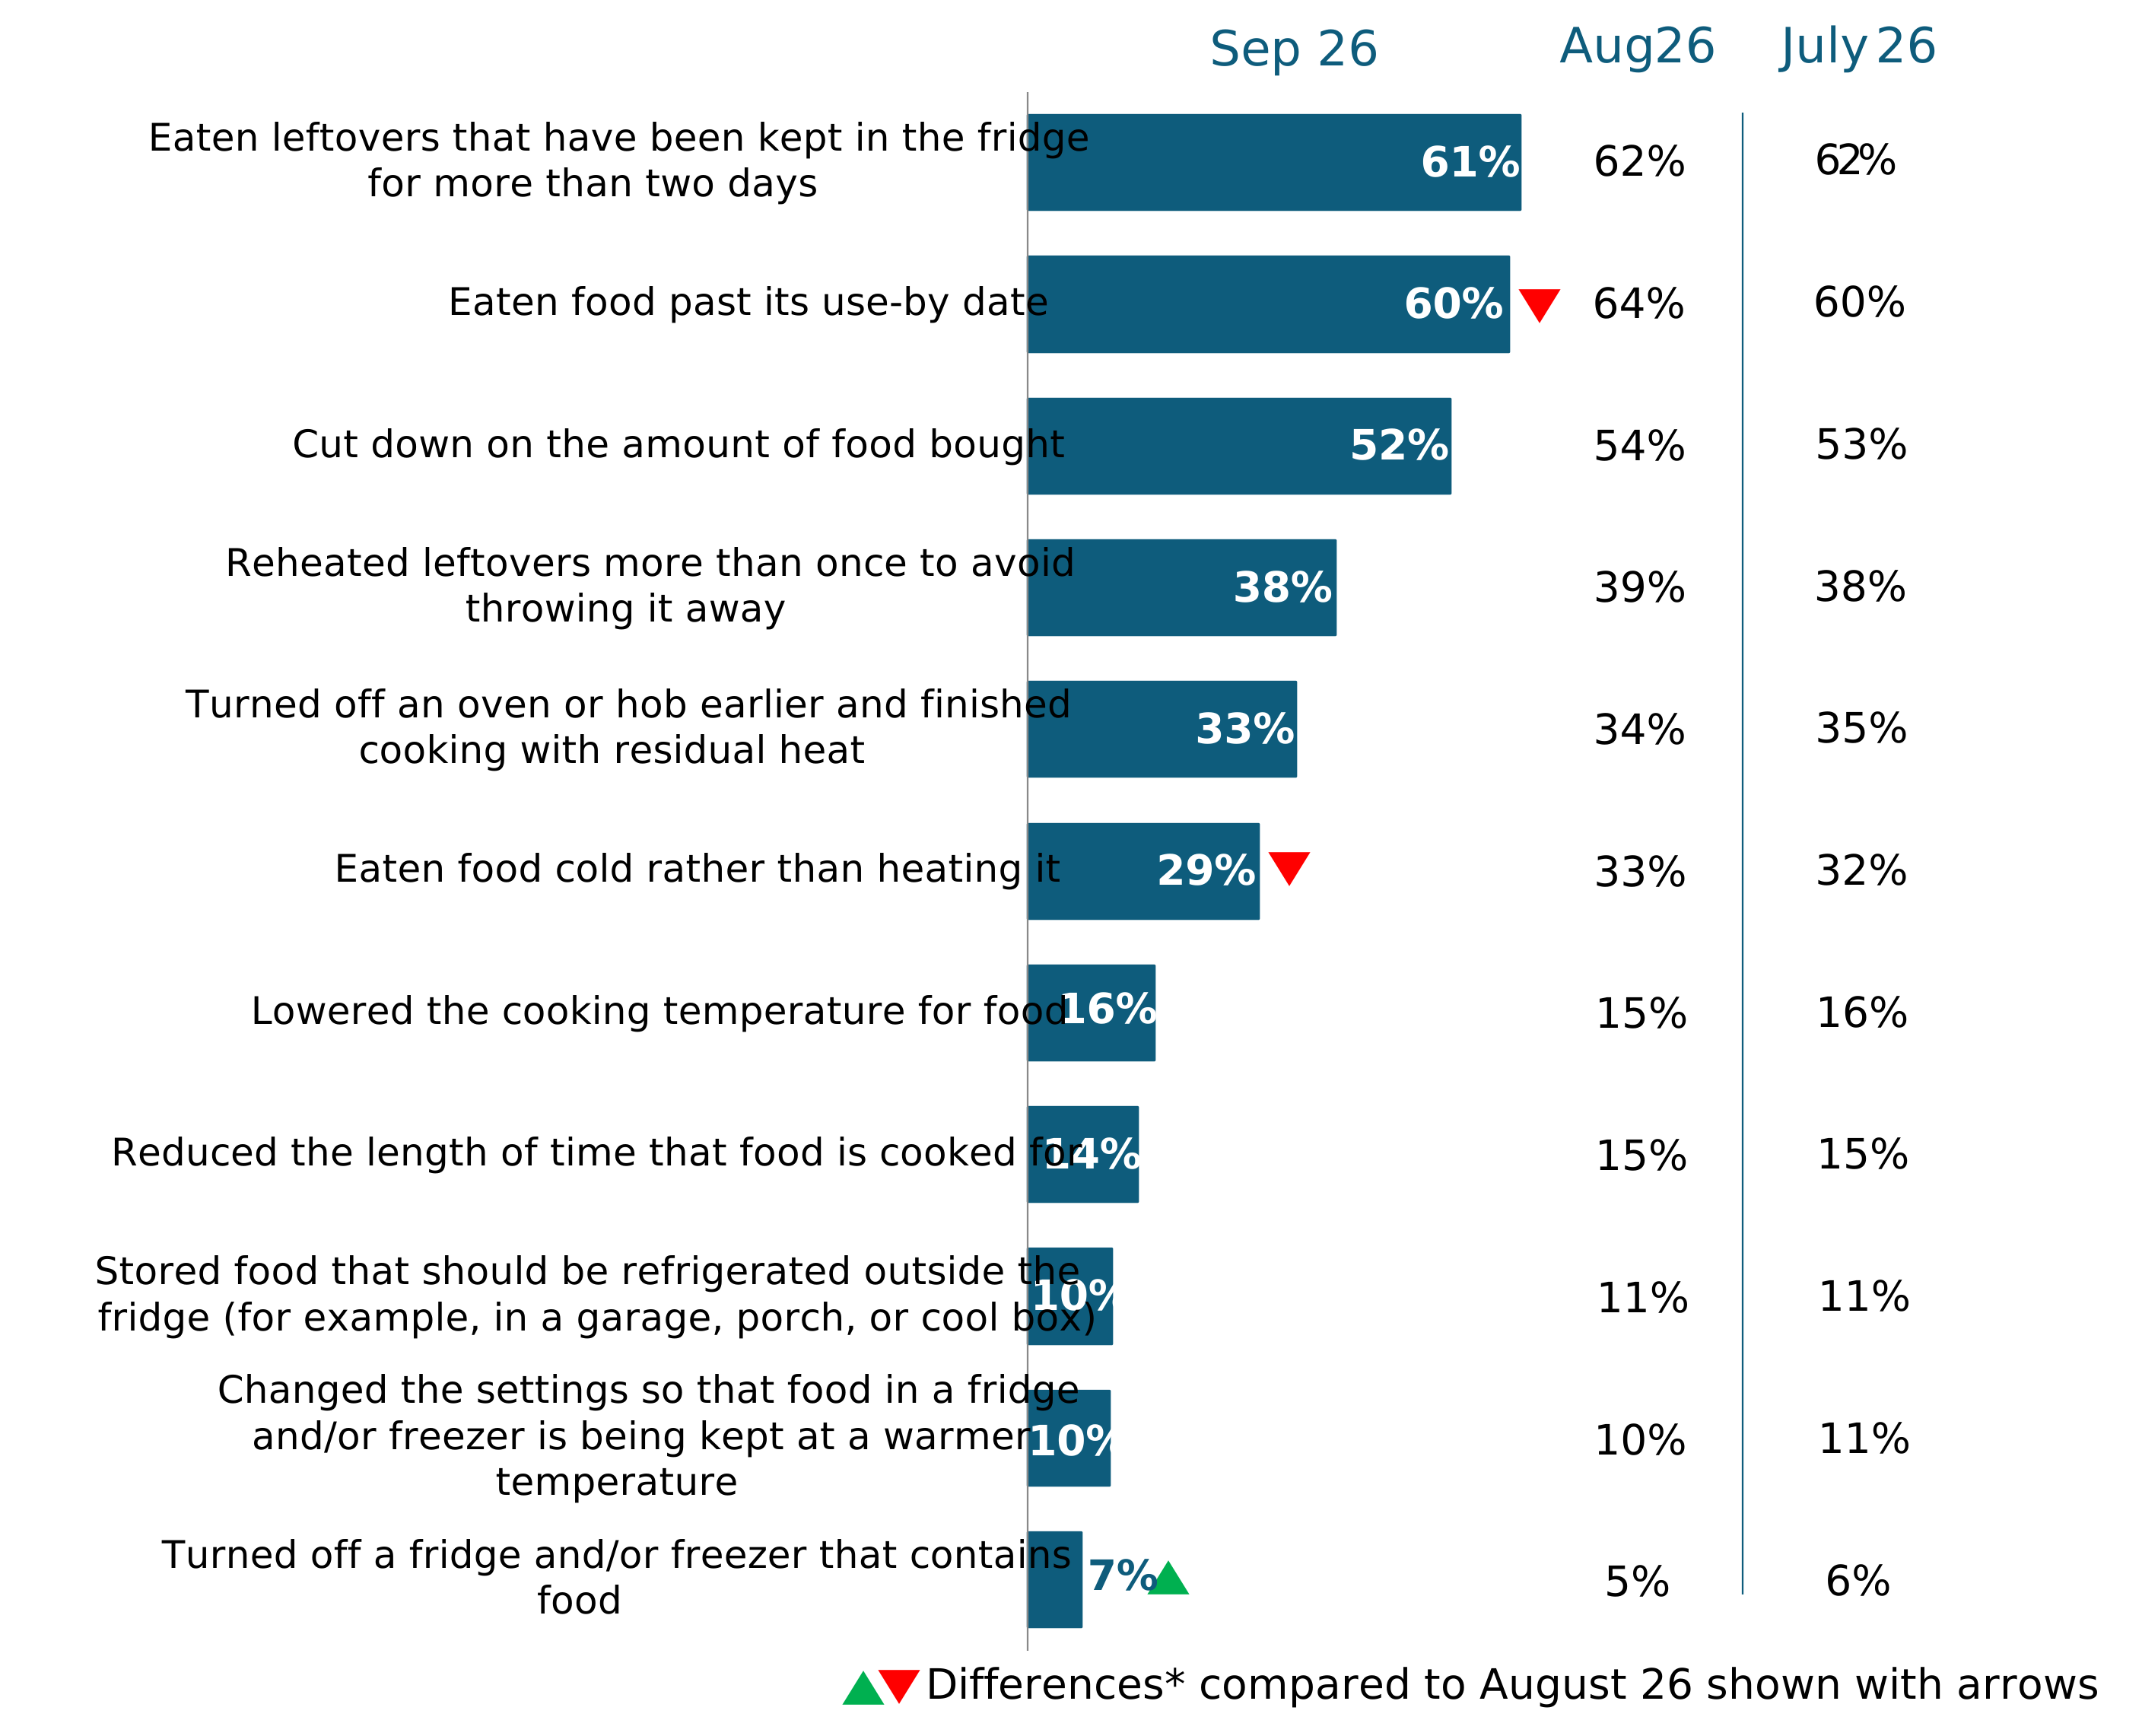
Money saving behaviours: Consistent with the previous quarter, eating leftovers kept in the fridge for more than two days (61% in September 26) and eating food past its use-by date (60%) remained the most commonly reported money-saving behaviours.
-
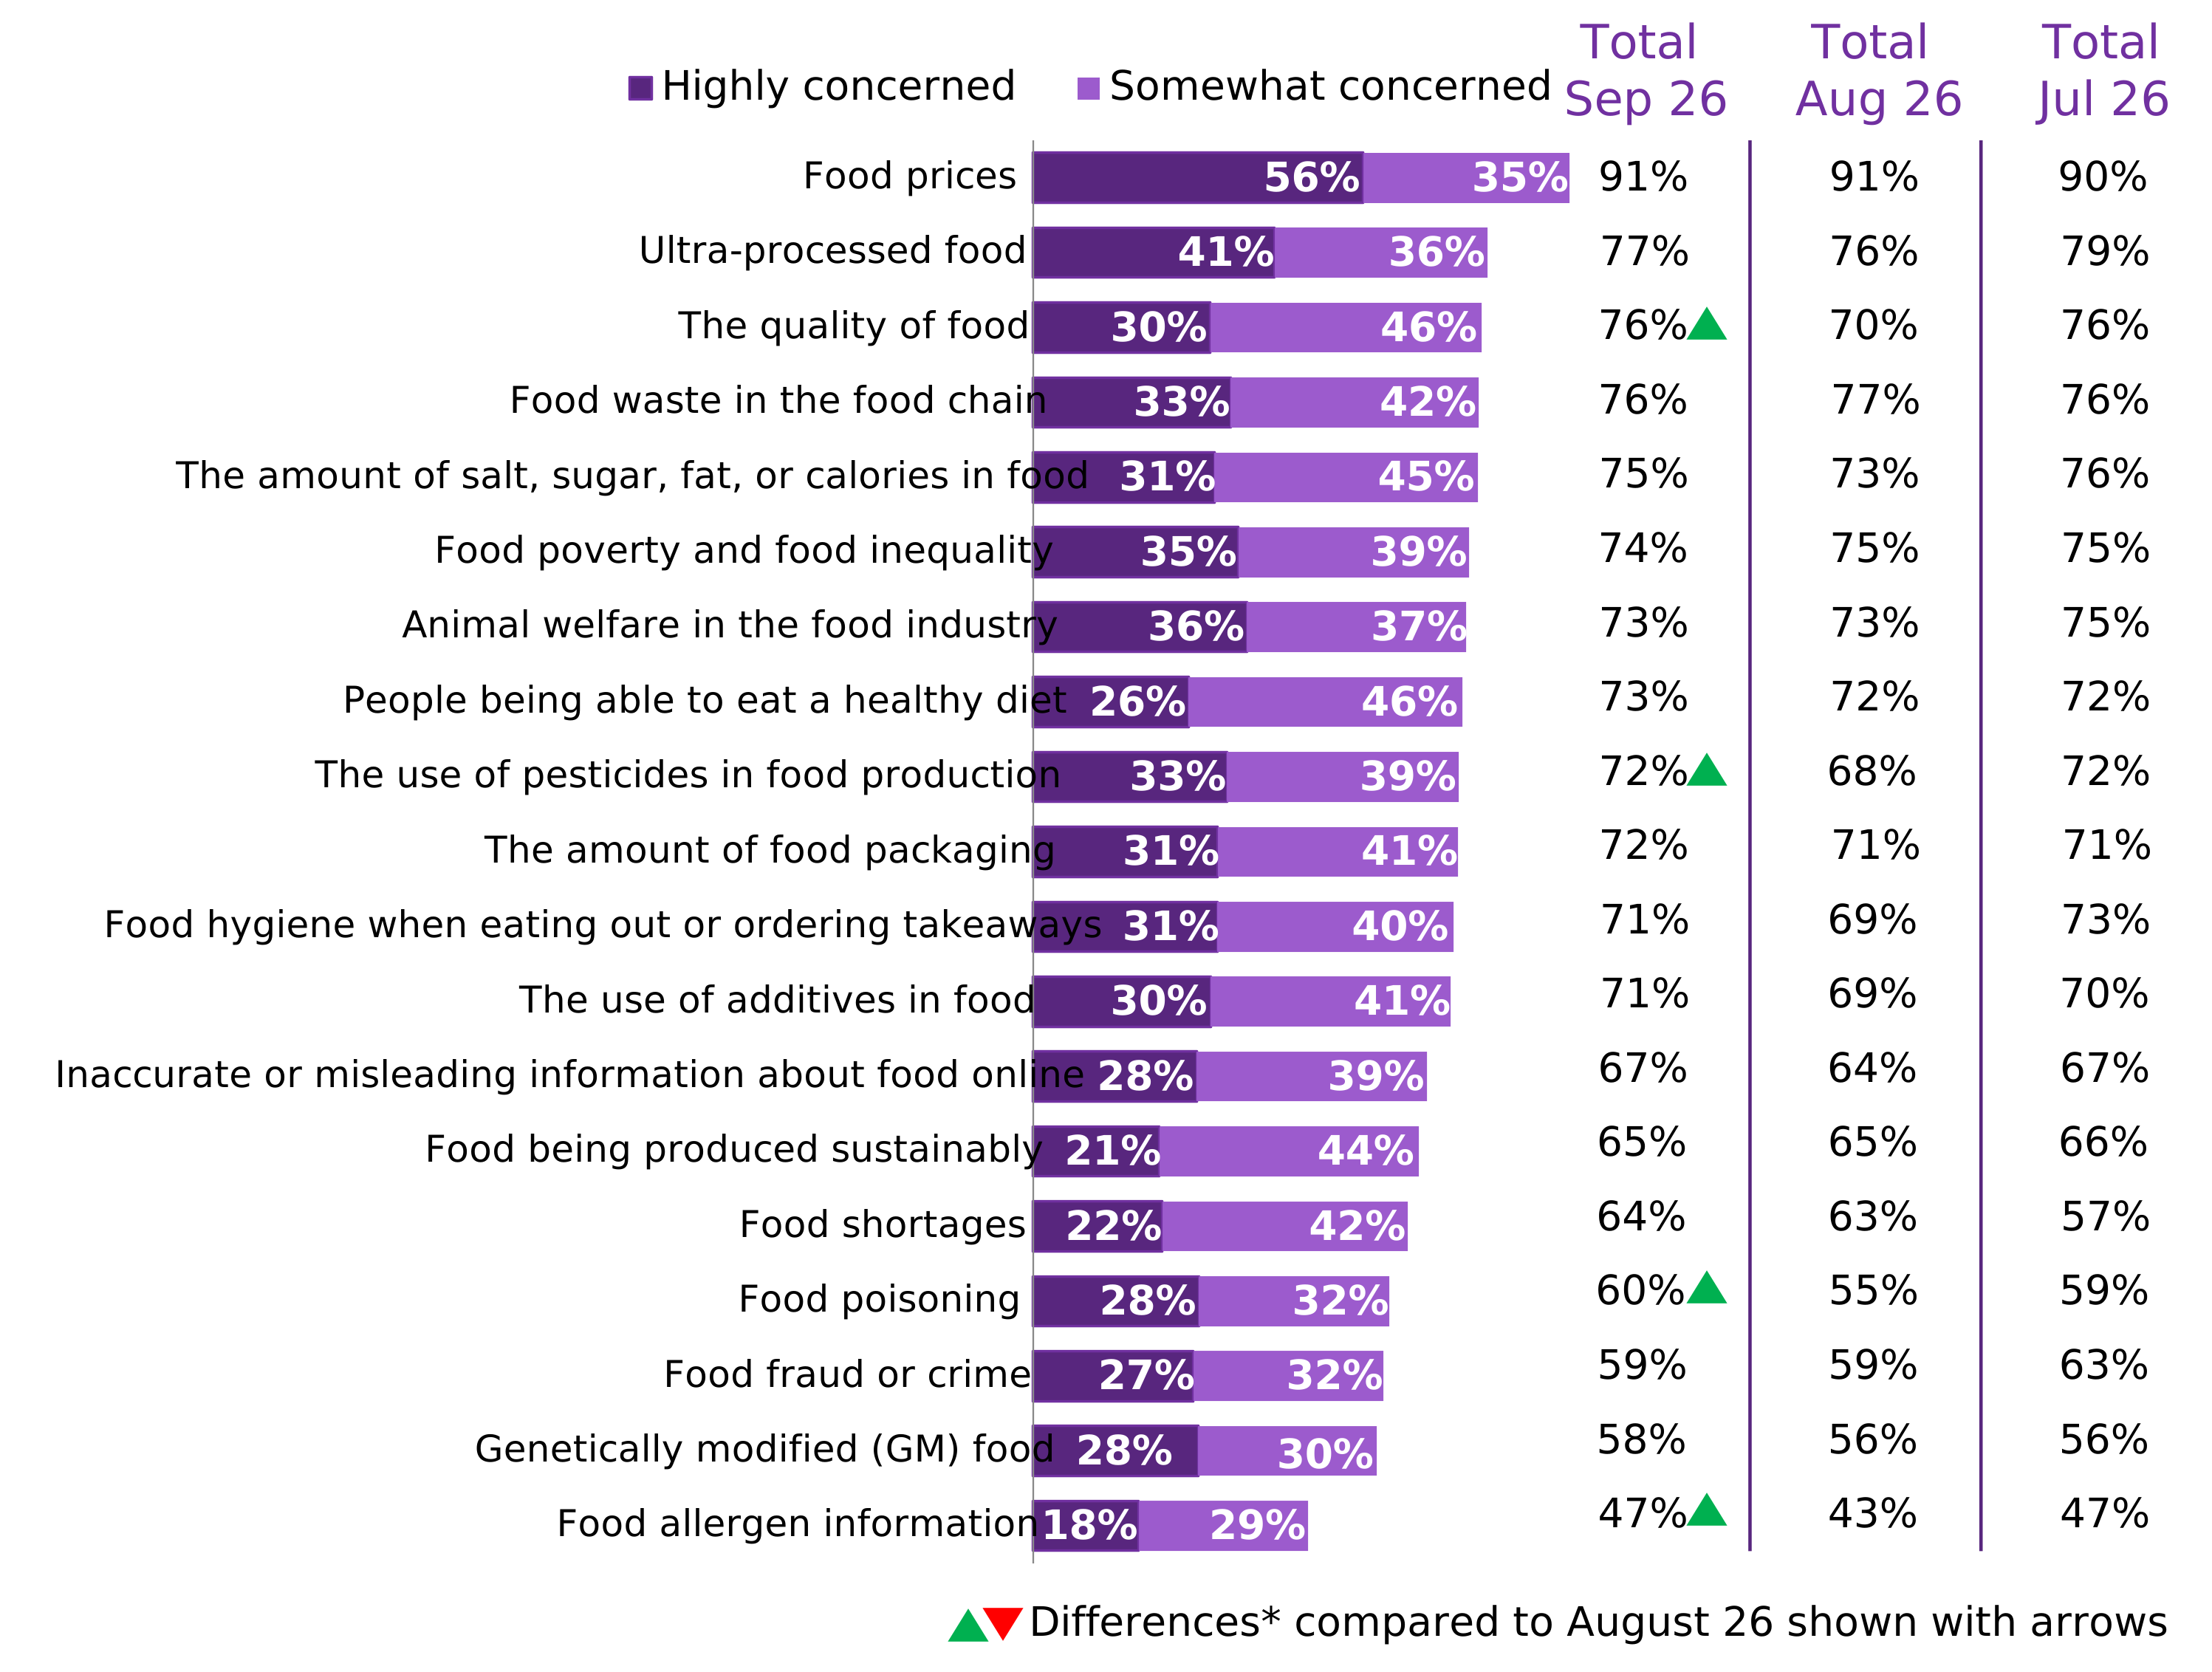
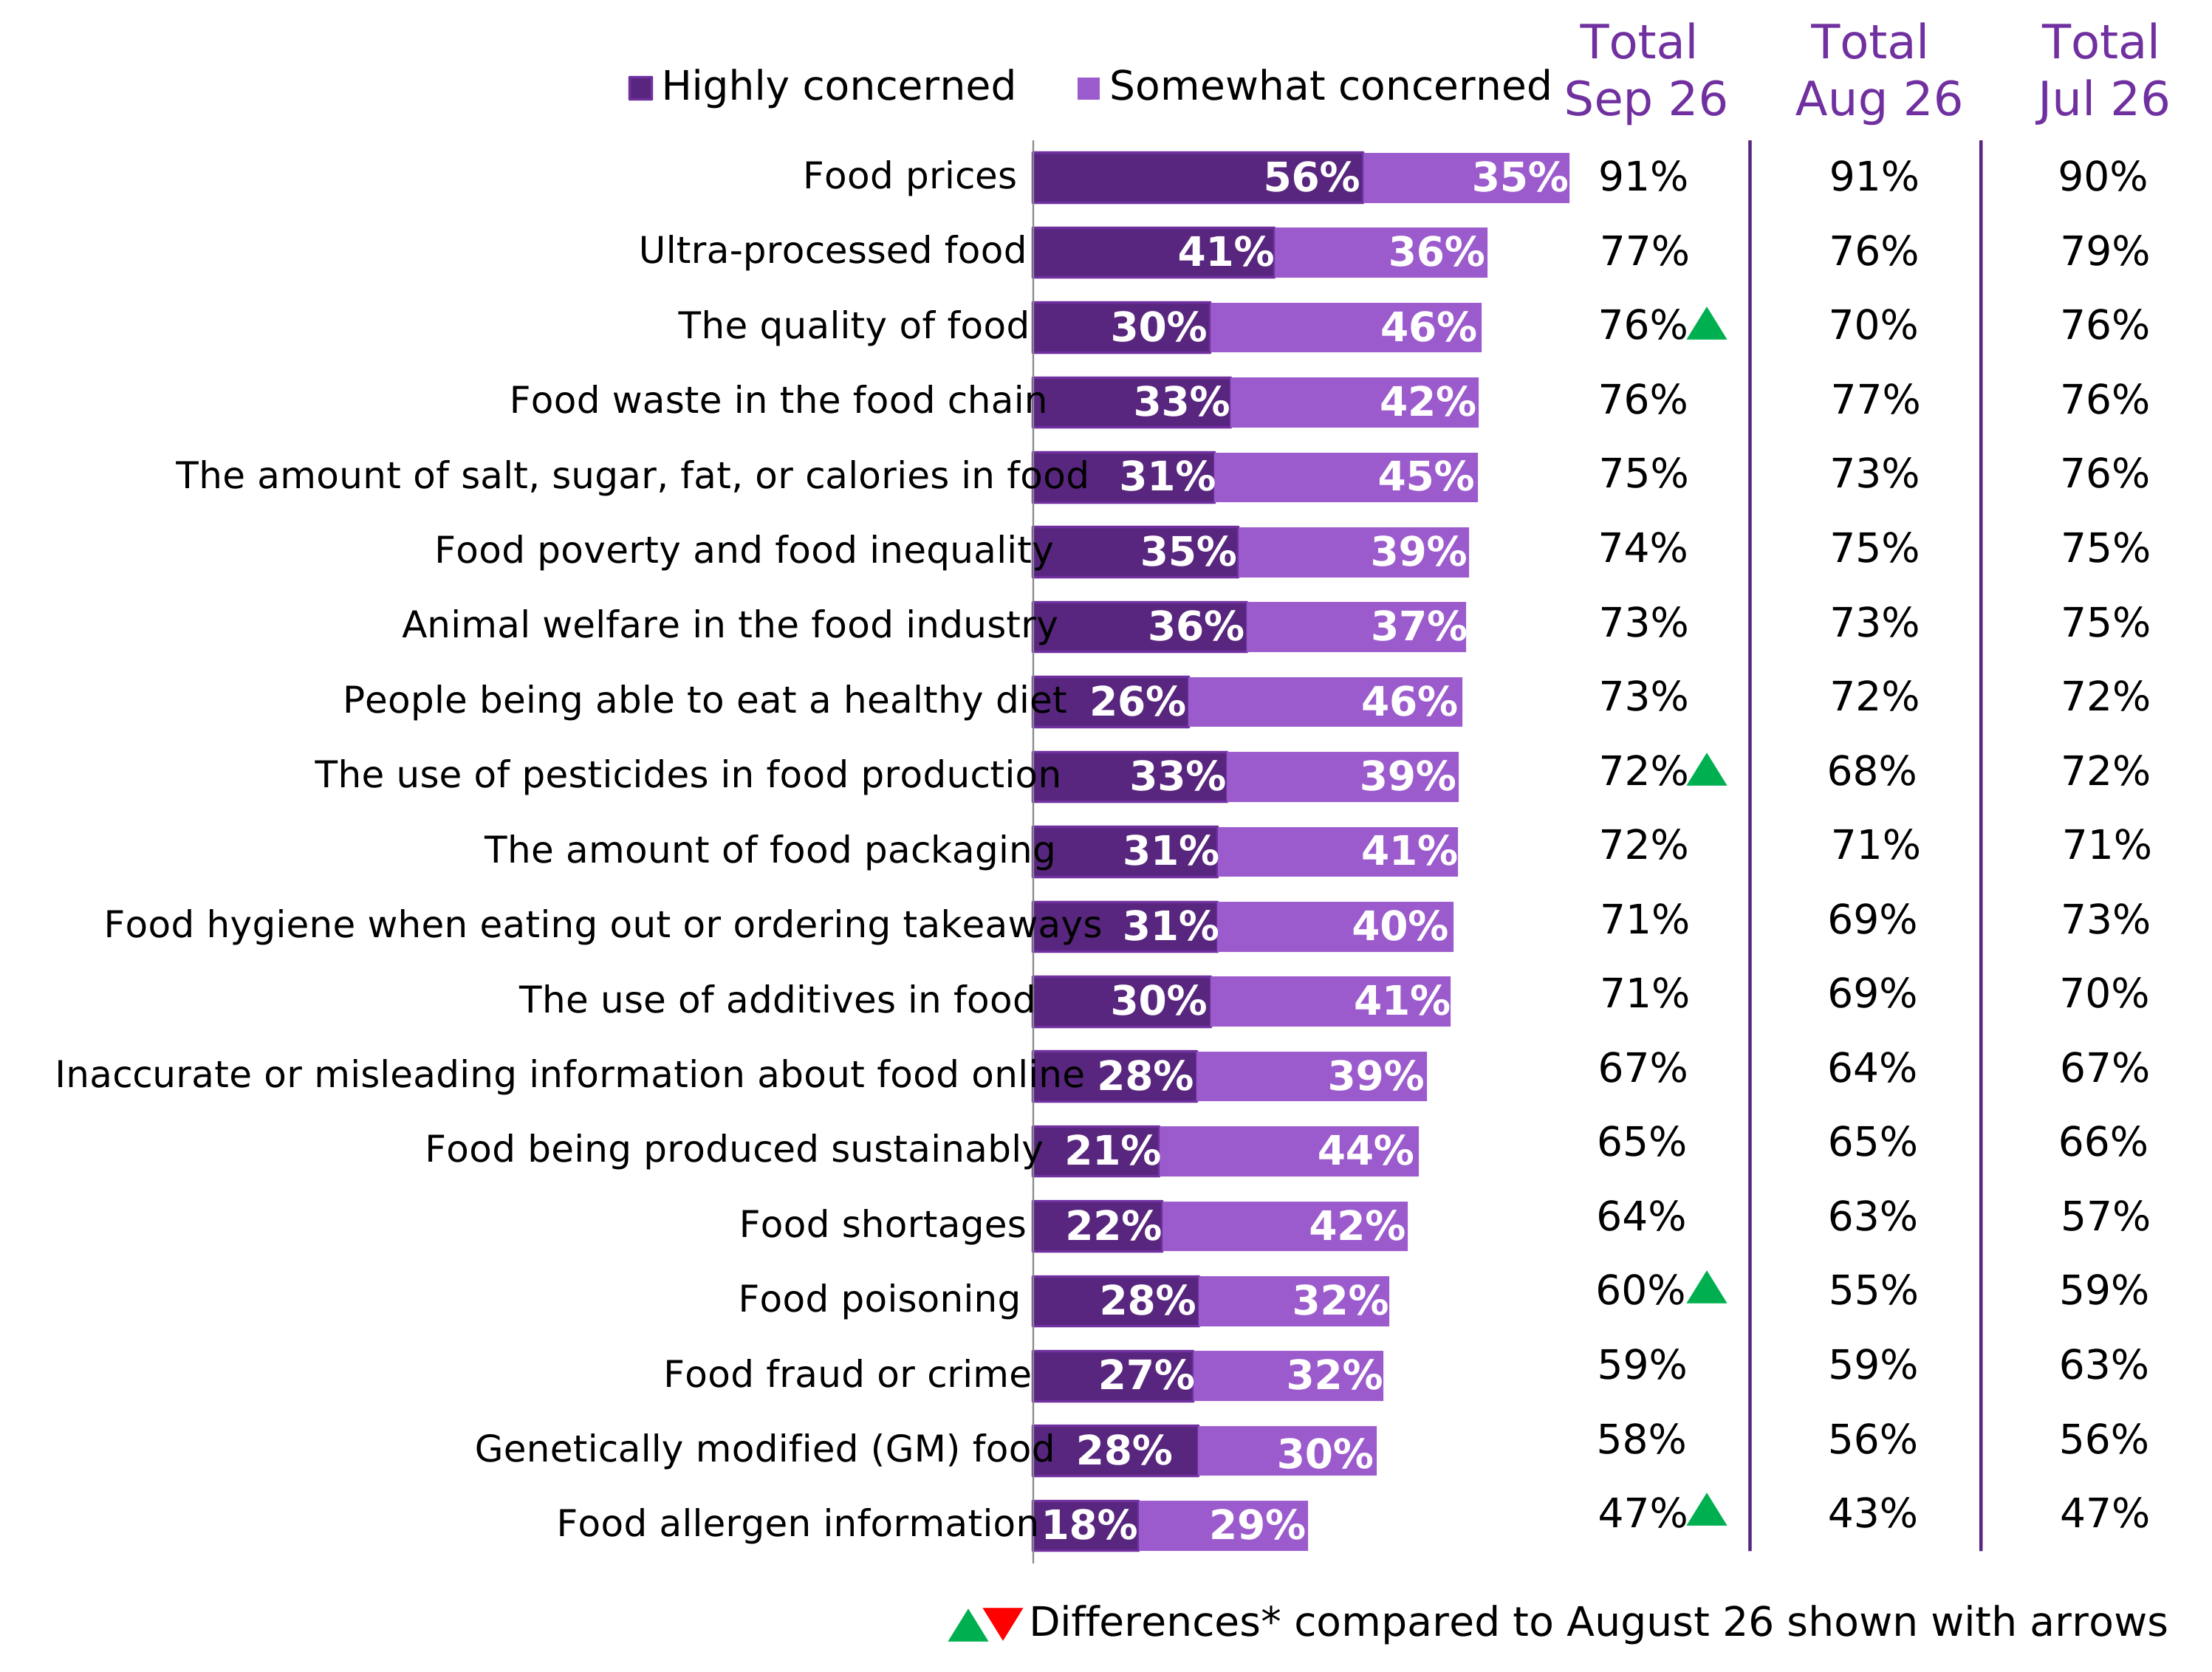
Food concerns: In September 26, when prompted with a list of food related topics, food prices (91%) remained the most commonly reported concern, followed by ultra-processed food (77%). Concern about food shortages increased slightly over the quarter (from 57% in July 26 to 64% in September 26), while concern about food poisoning in July (59%) and September (60%) was higher than in most other waves since tracking began in April 25.
-
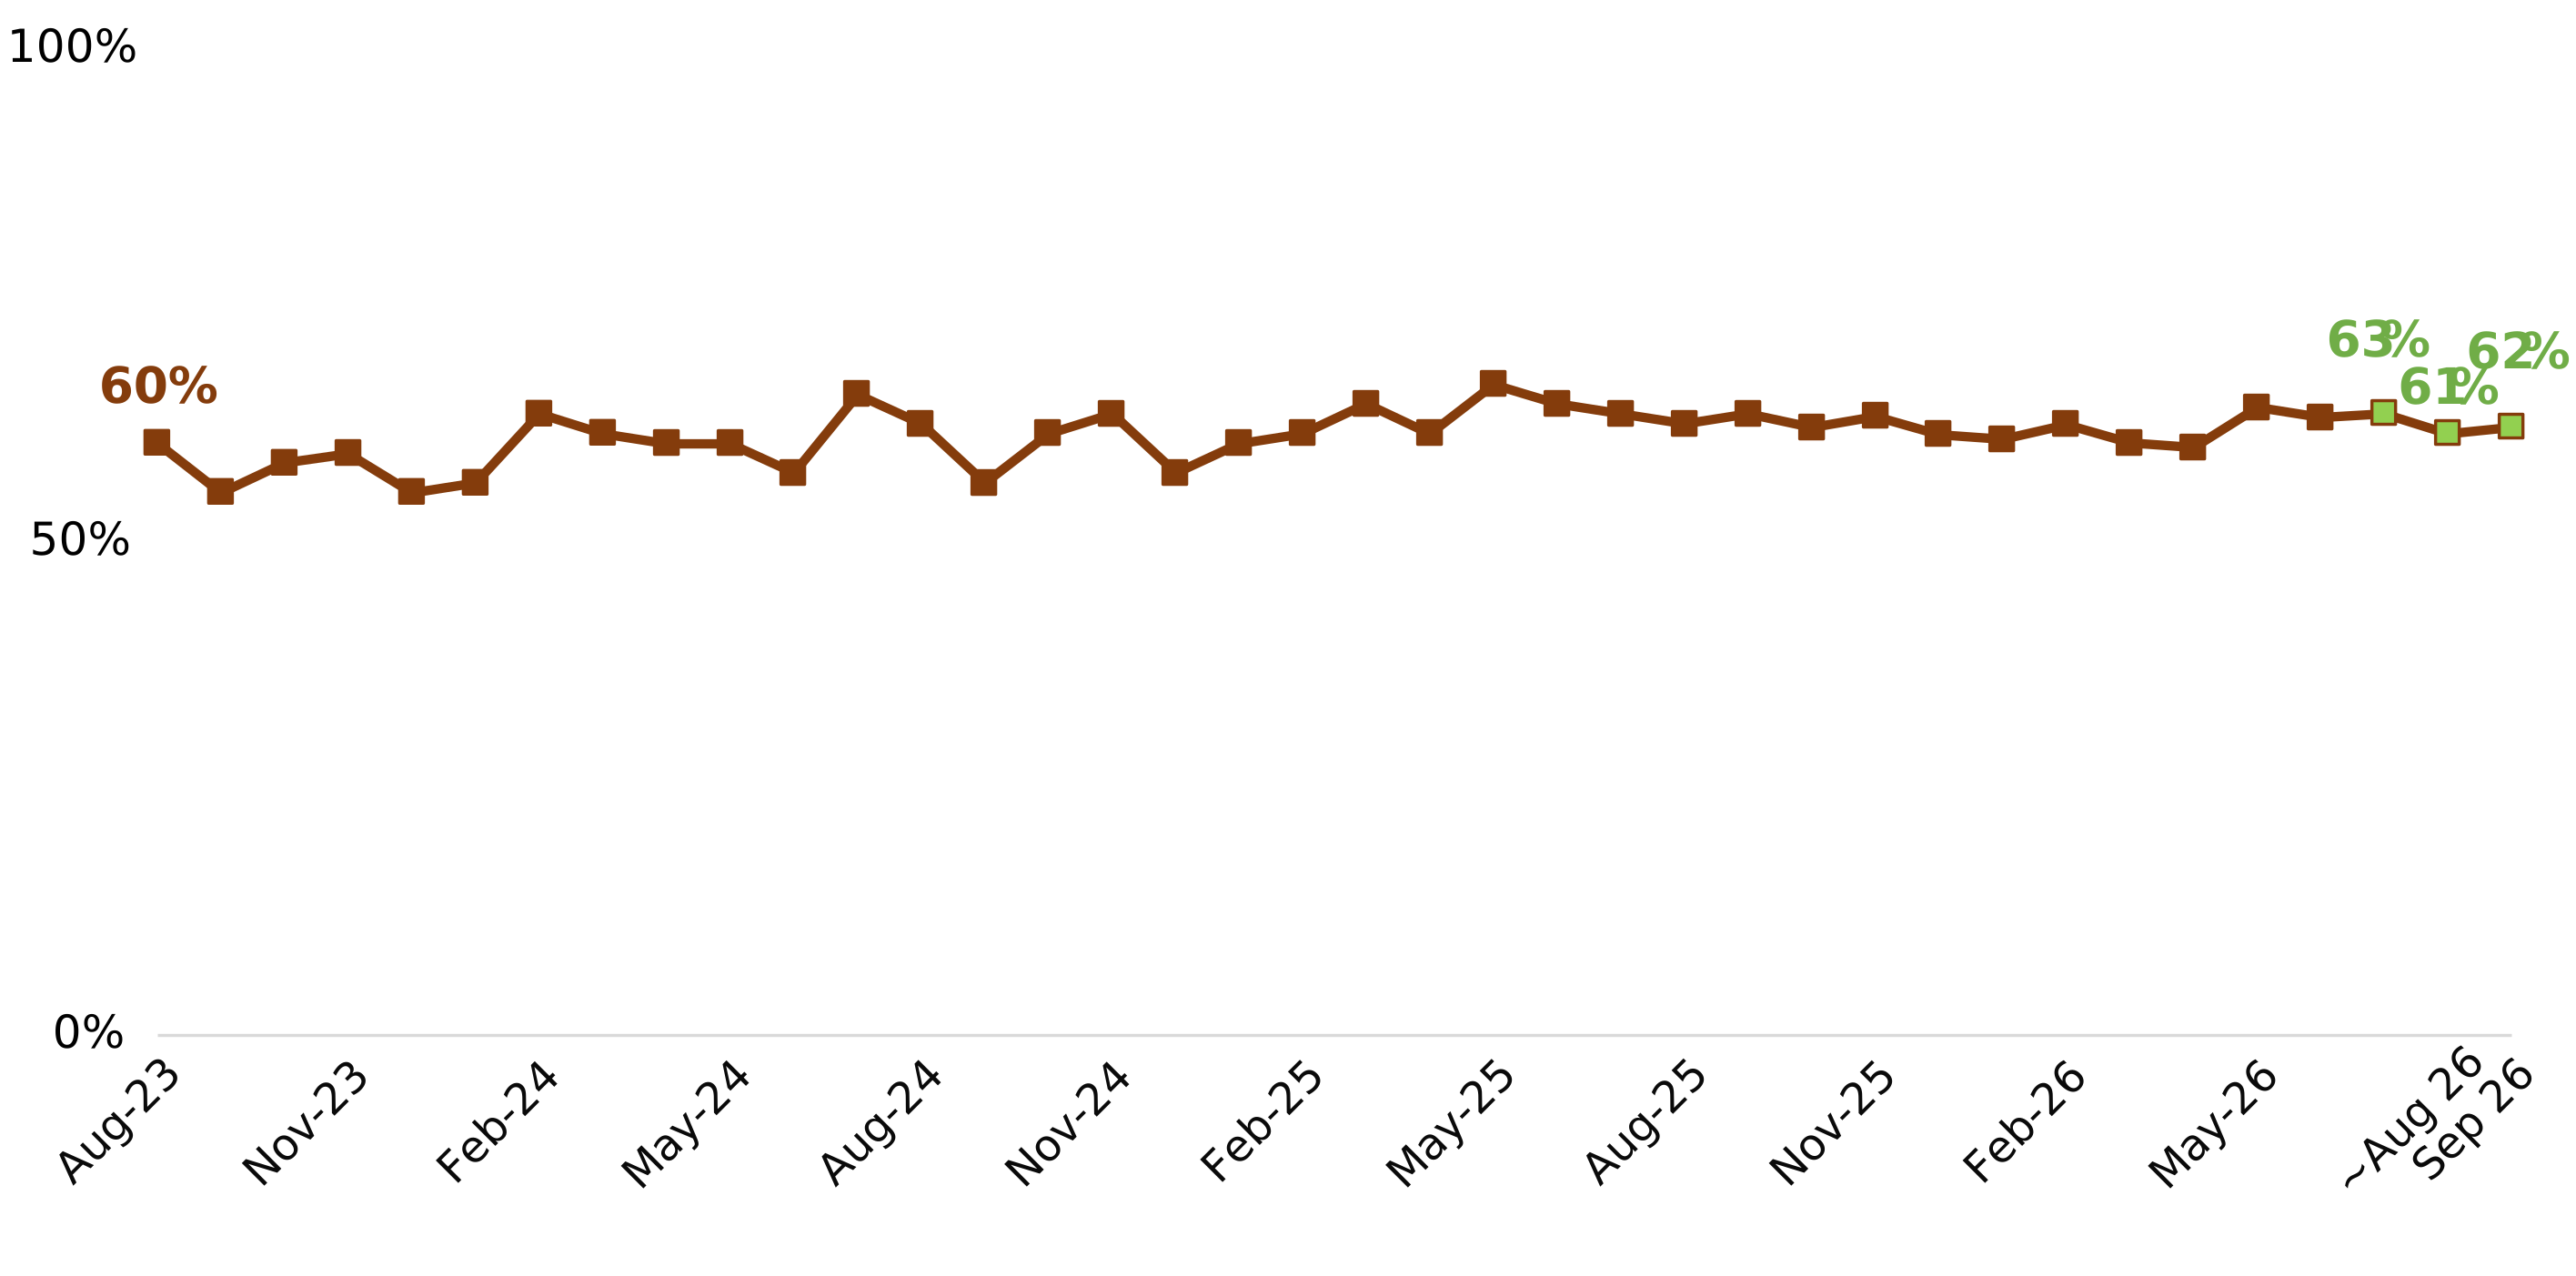
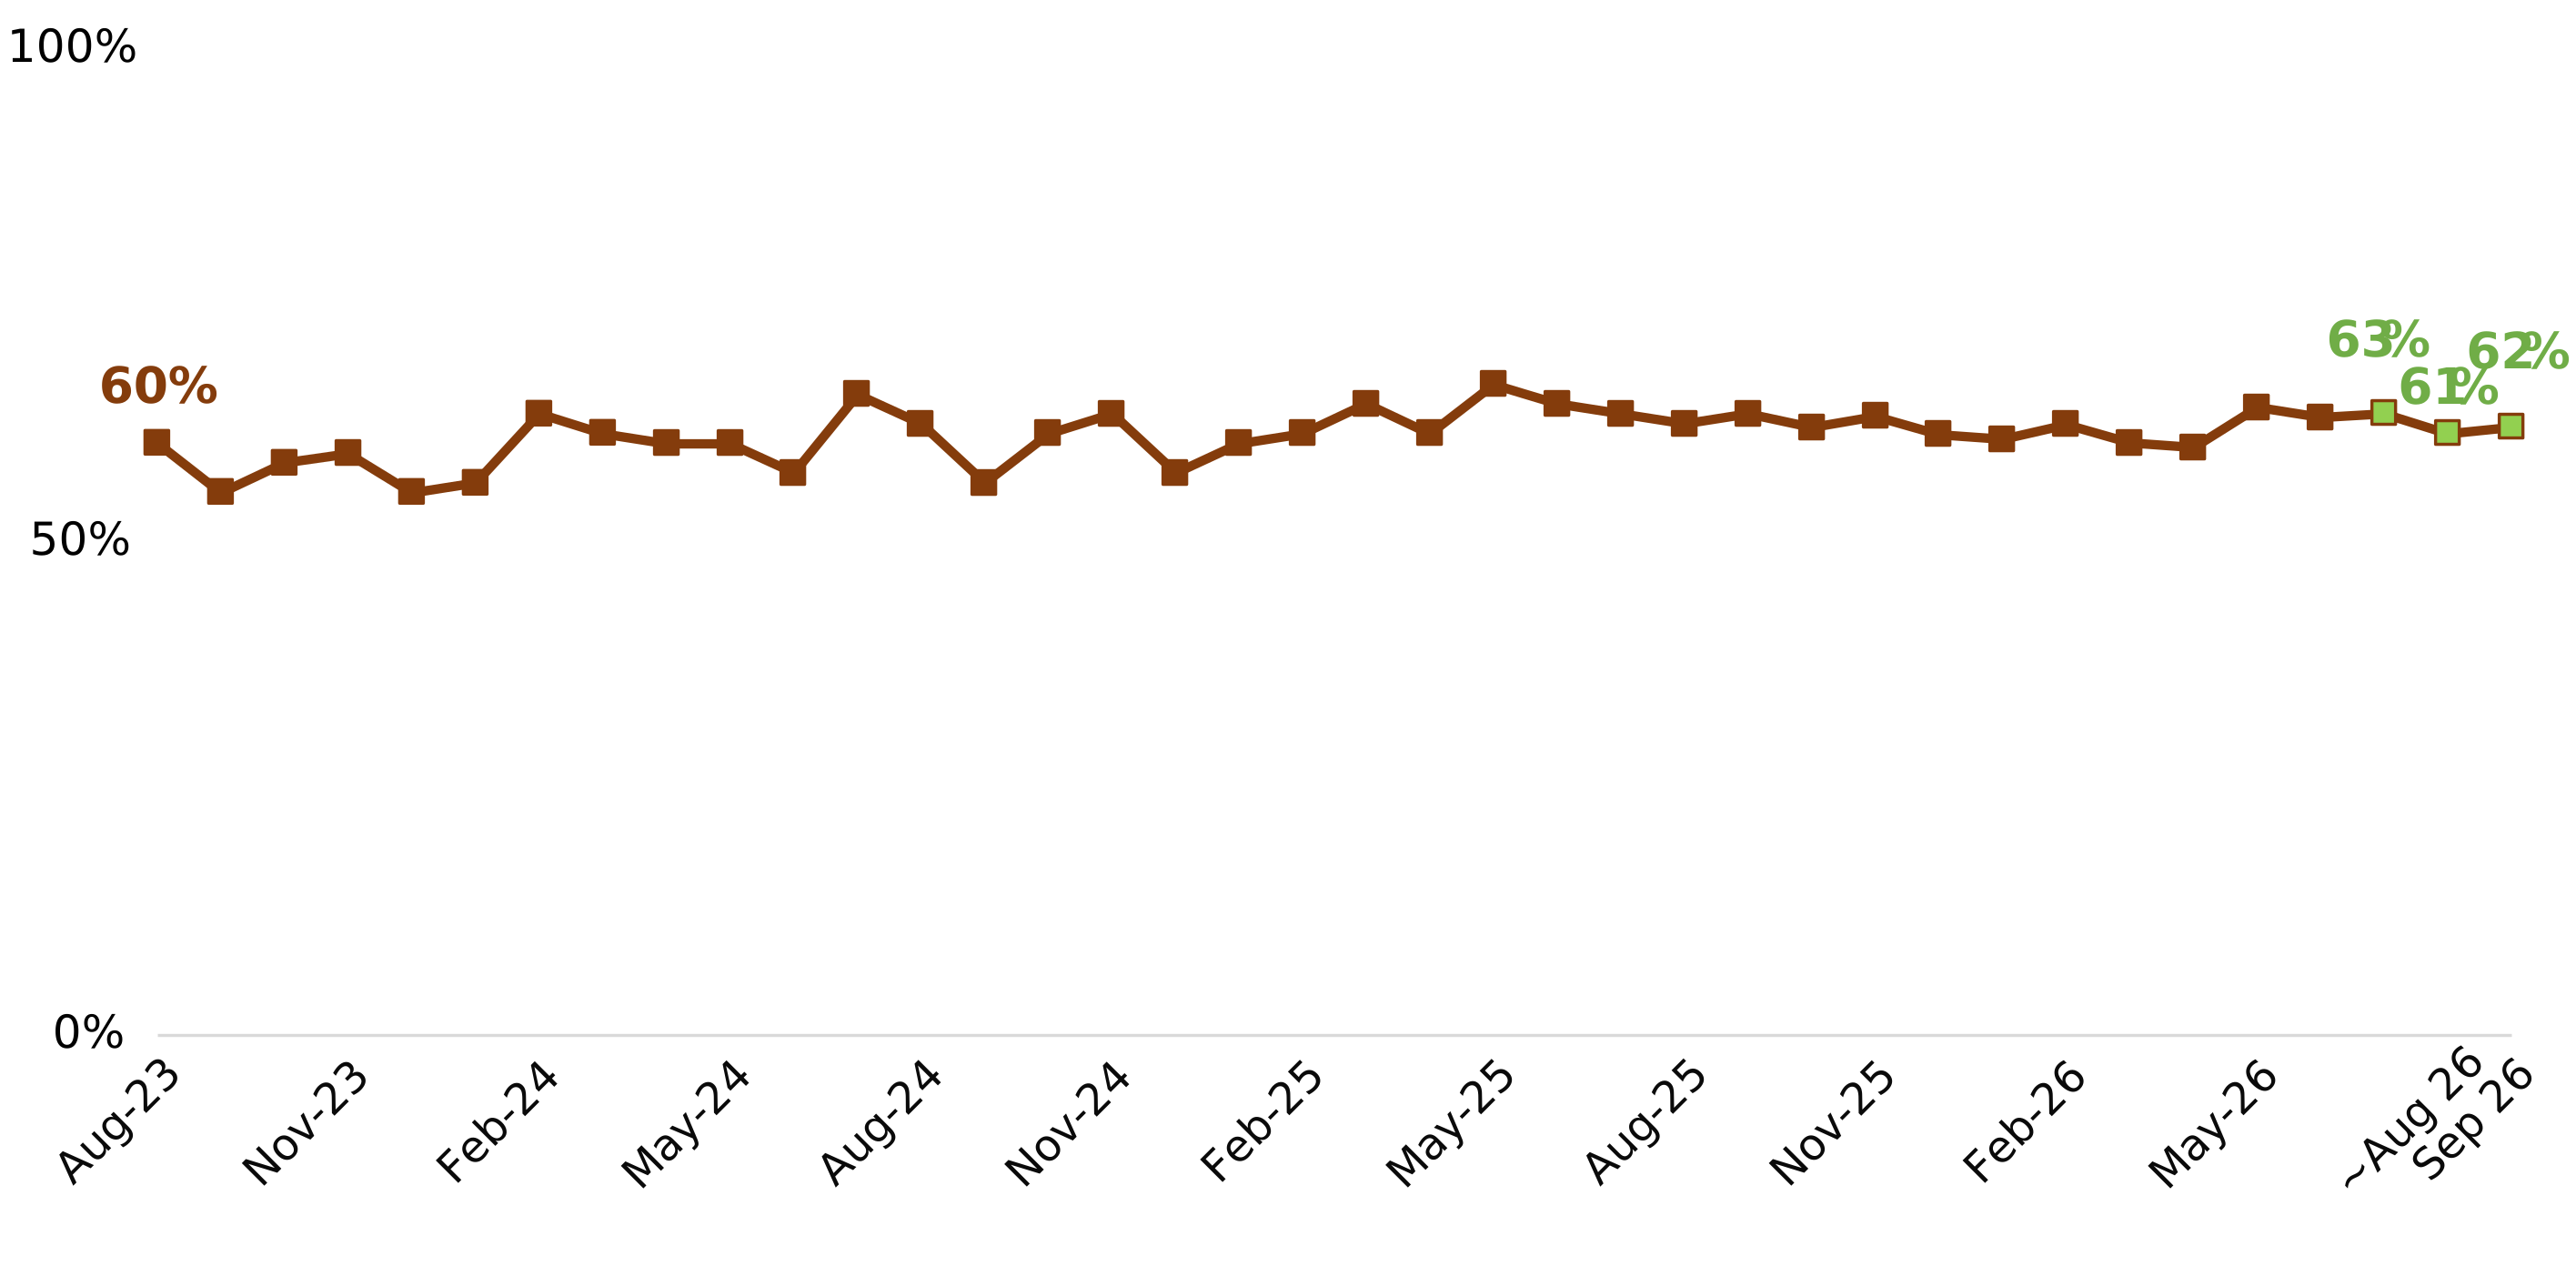
Food Standards Agency (FSA): Among respondents with some knowledge of the FSA, trust in the FSA remained broadly stable between July and September 26, ranging from 61% to 63%. This was comparable with levels reported in the previous quarter (60%-64%).
-
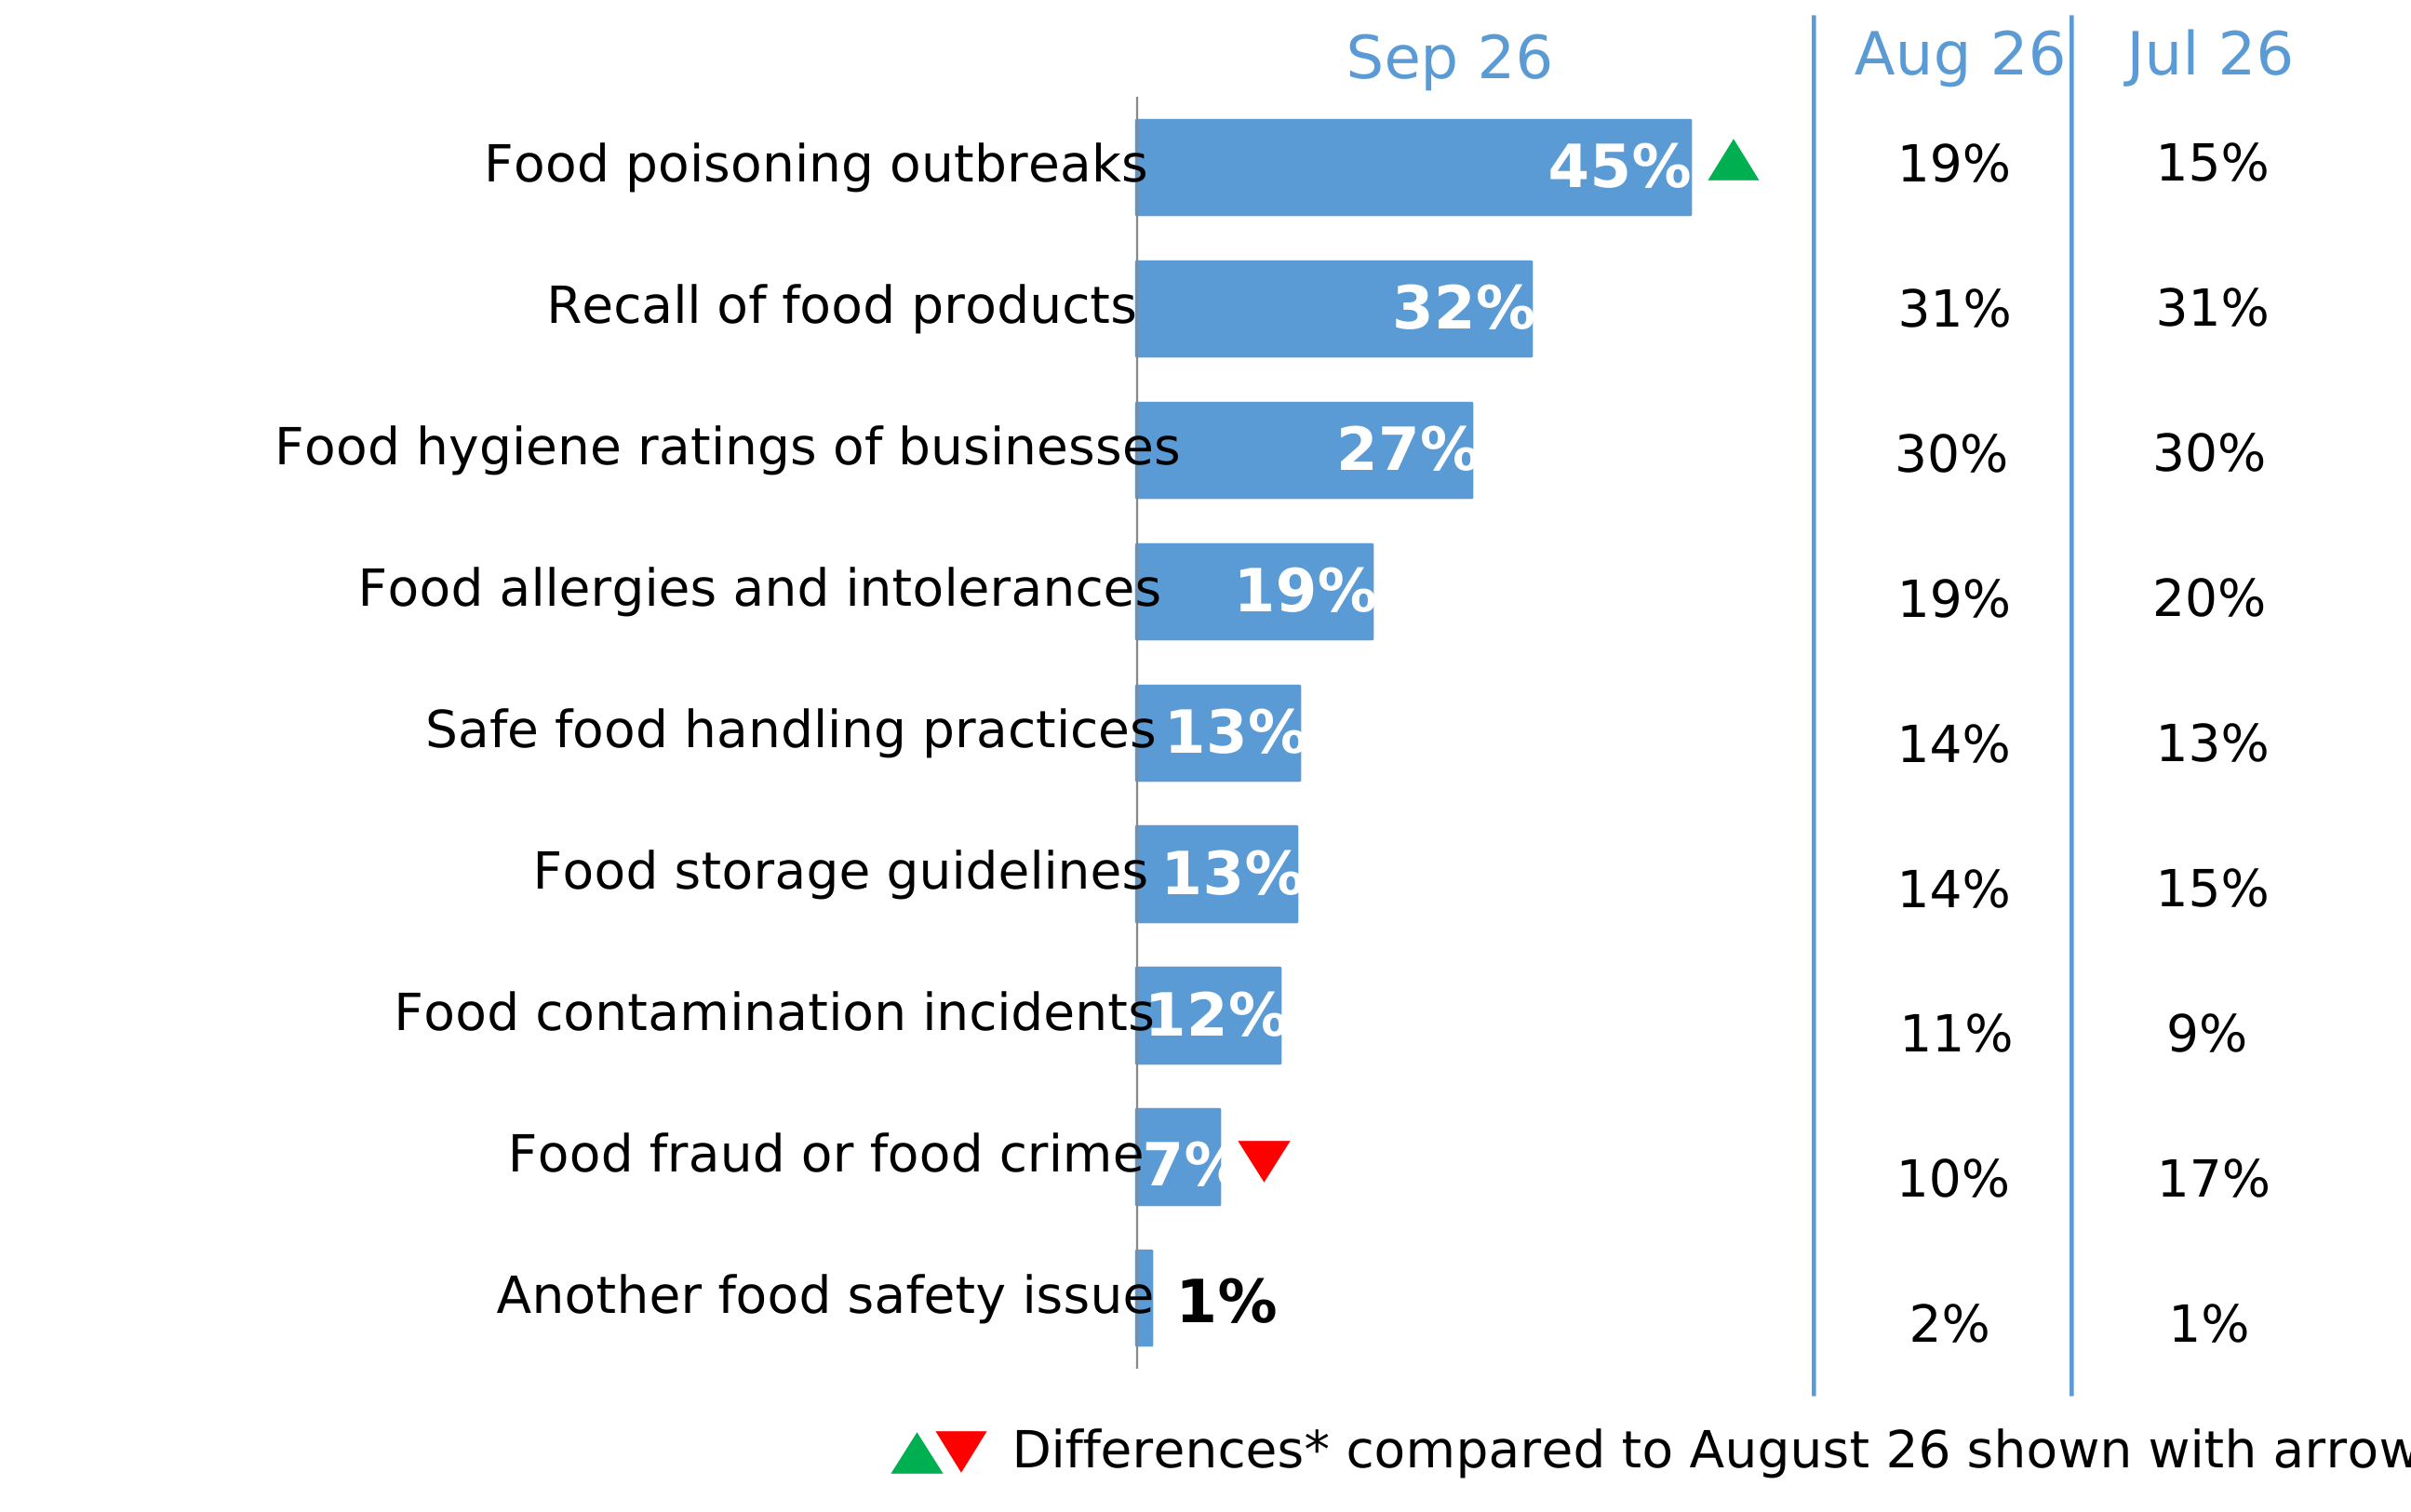
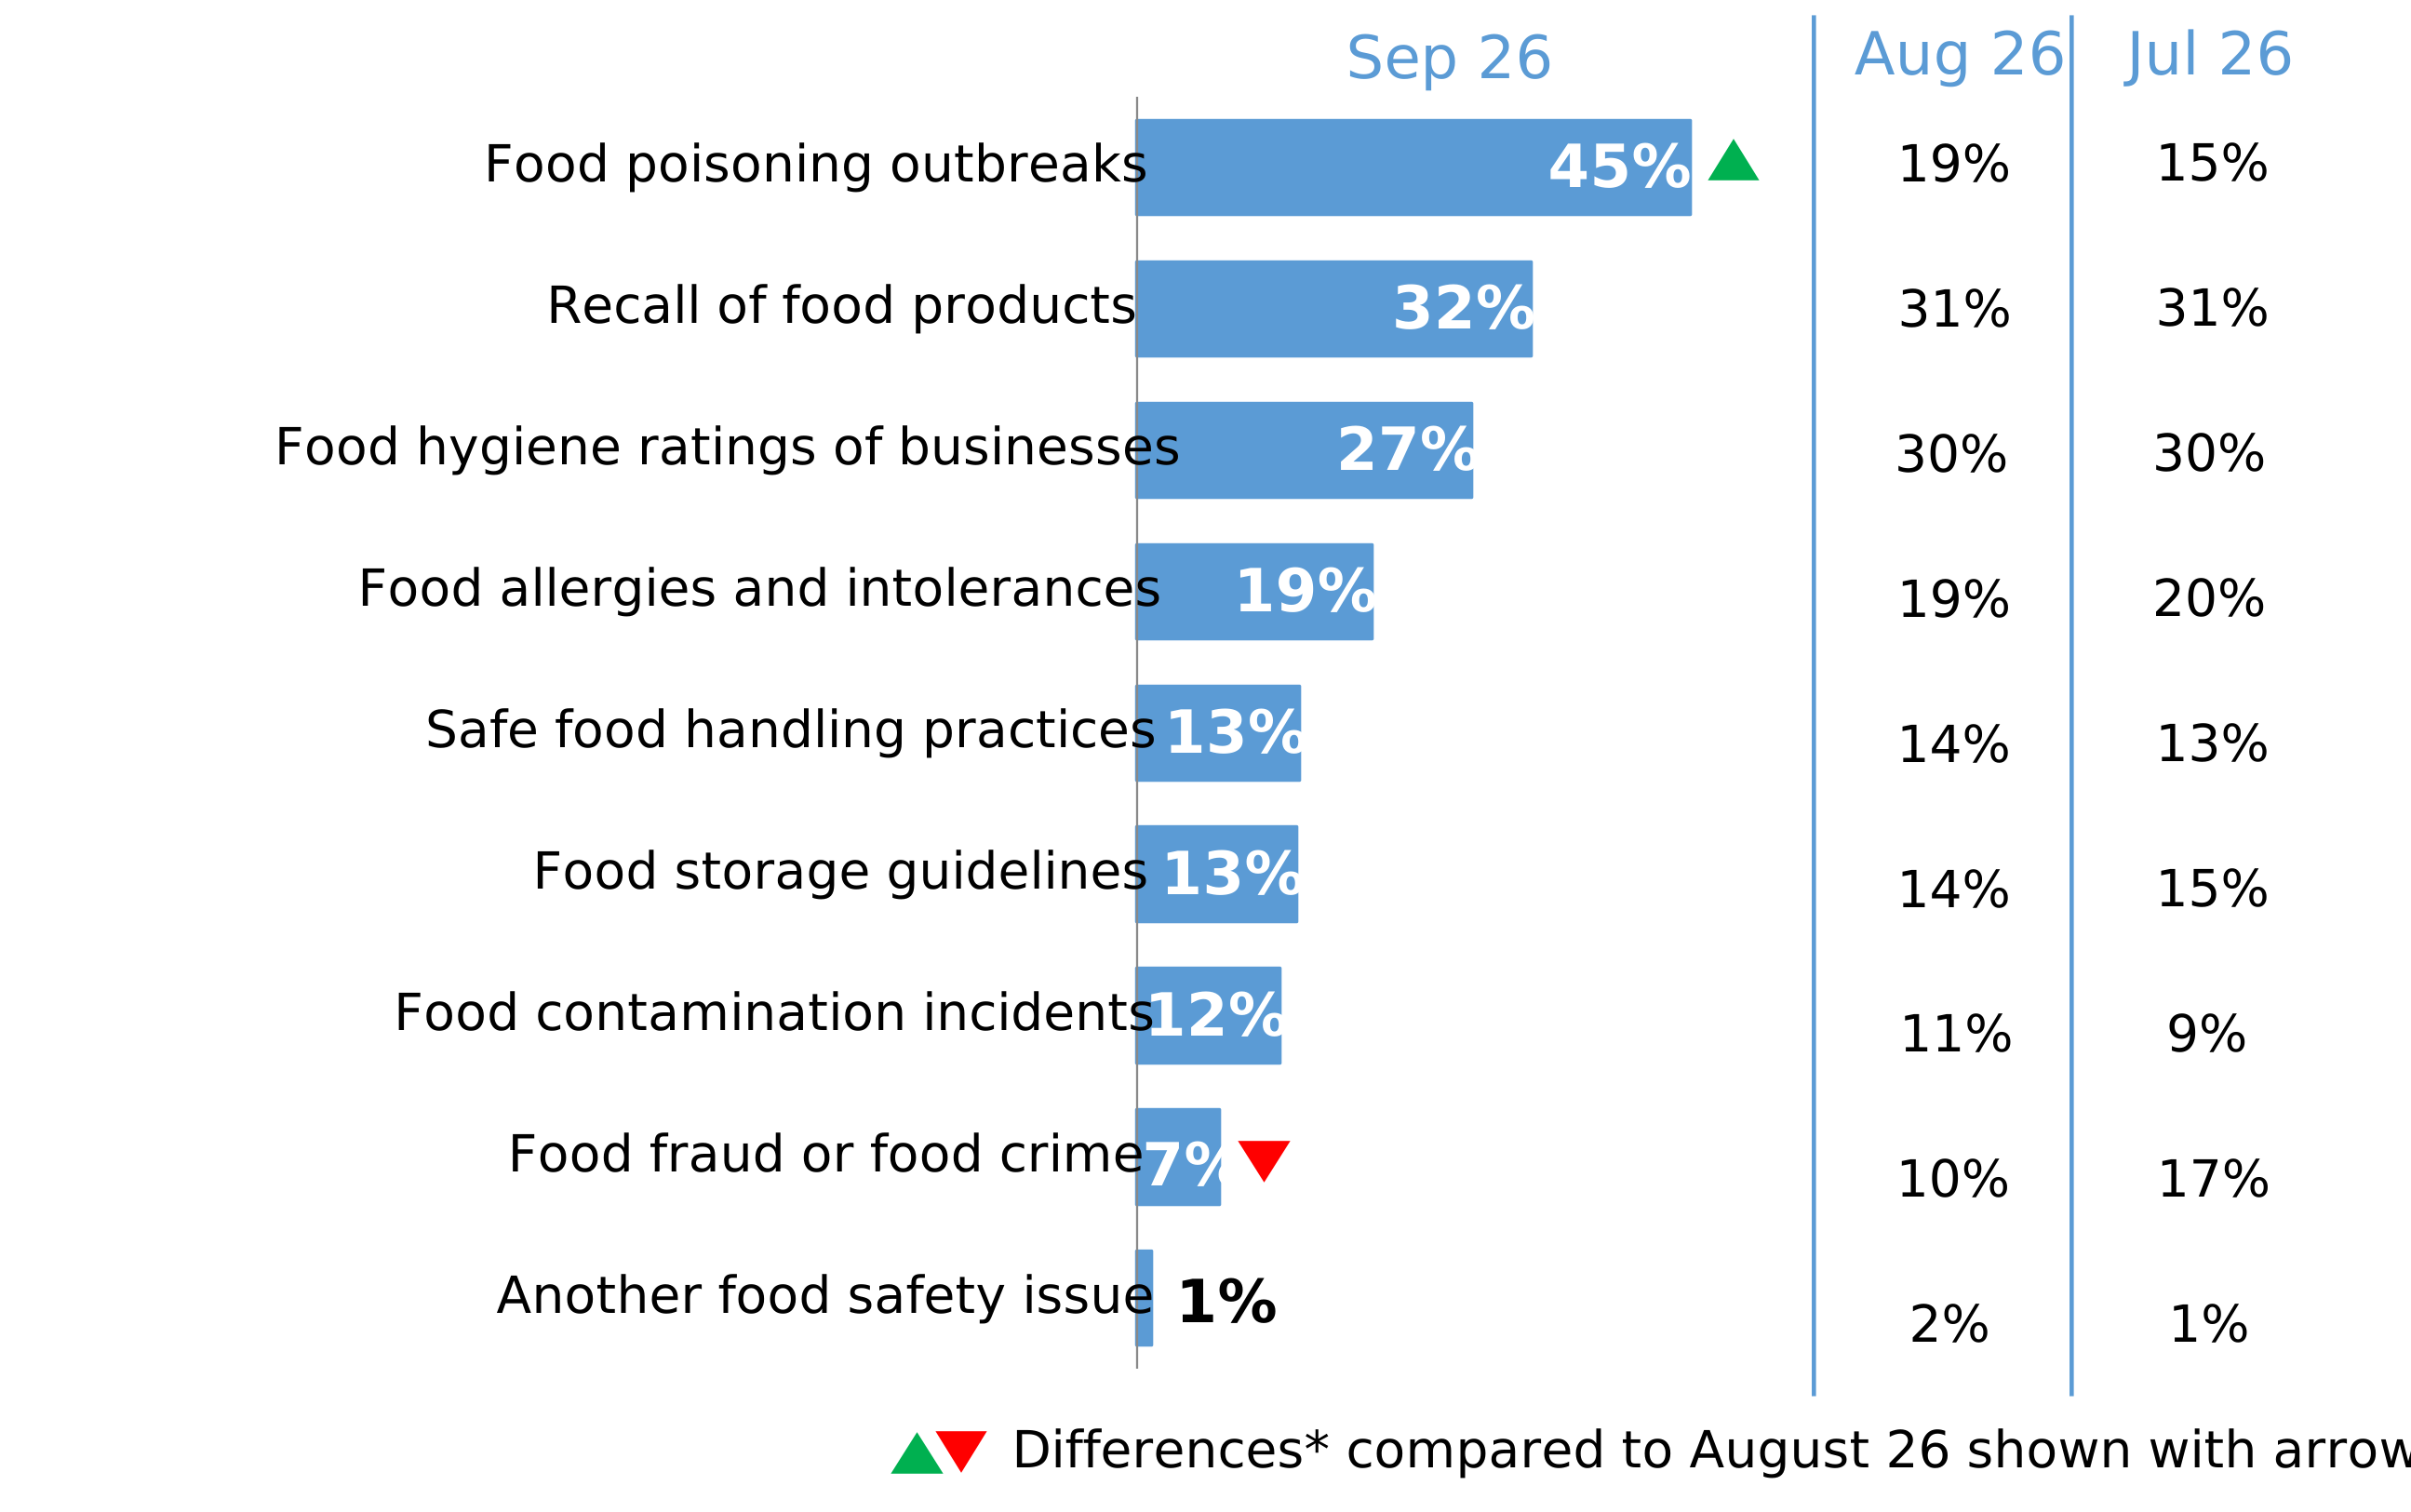
Food safety information: In September 26, food poisoning outbreaks became the most commonly recalled food safety topic, with 45% of respondents reporting they had seen, heard or read something about this in the past month, a notable increase from 19% in August 26. The lead up to September 26 fieldwork coincided with an outbreak of Salmonella in the UK. Recall of food products was the next most commonly reported topic (32%).
-
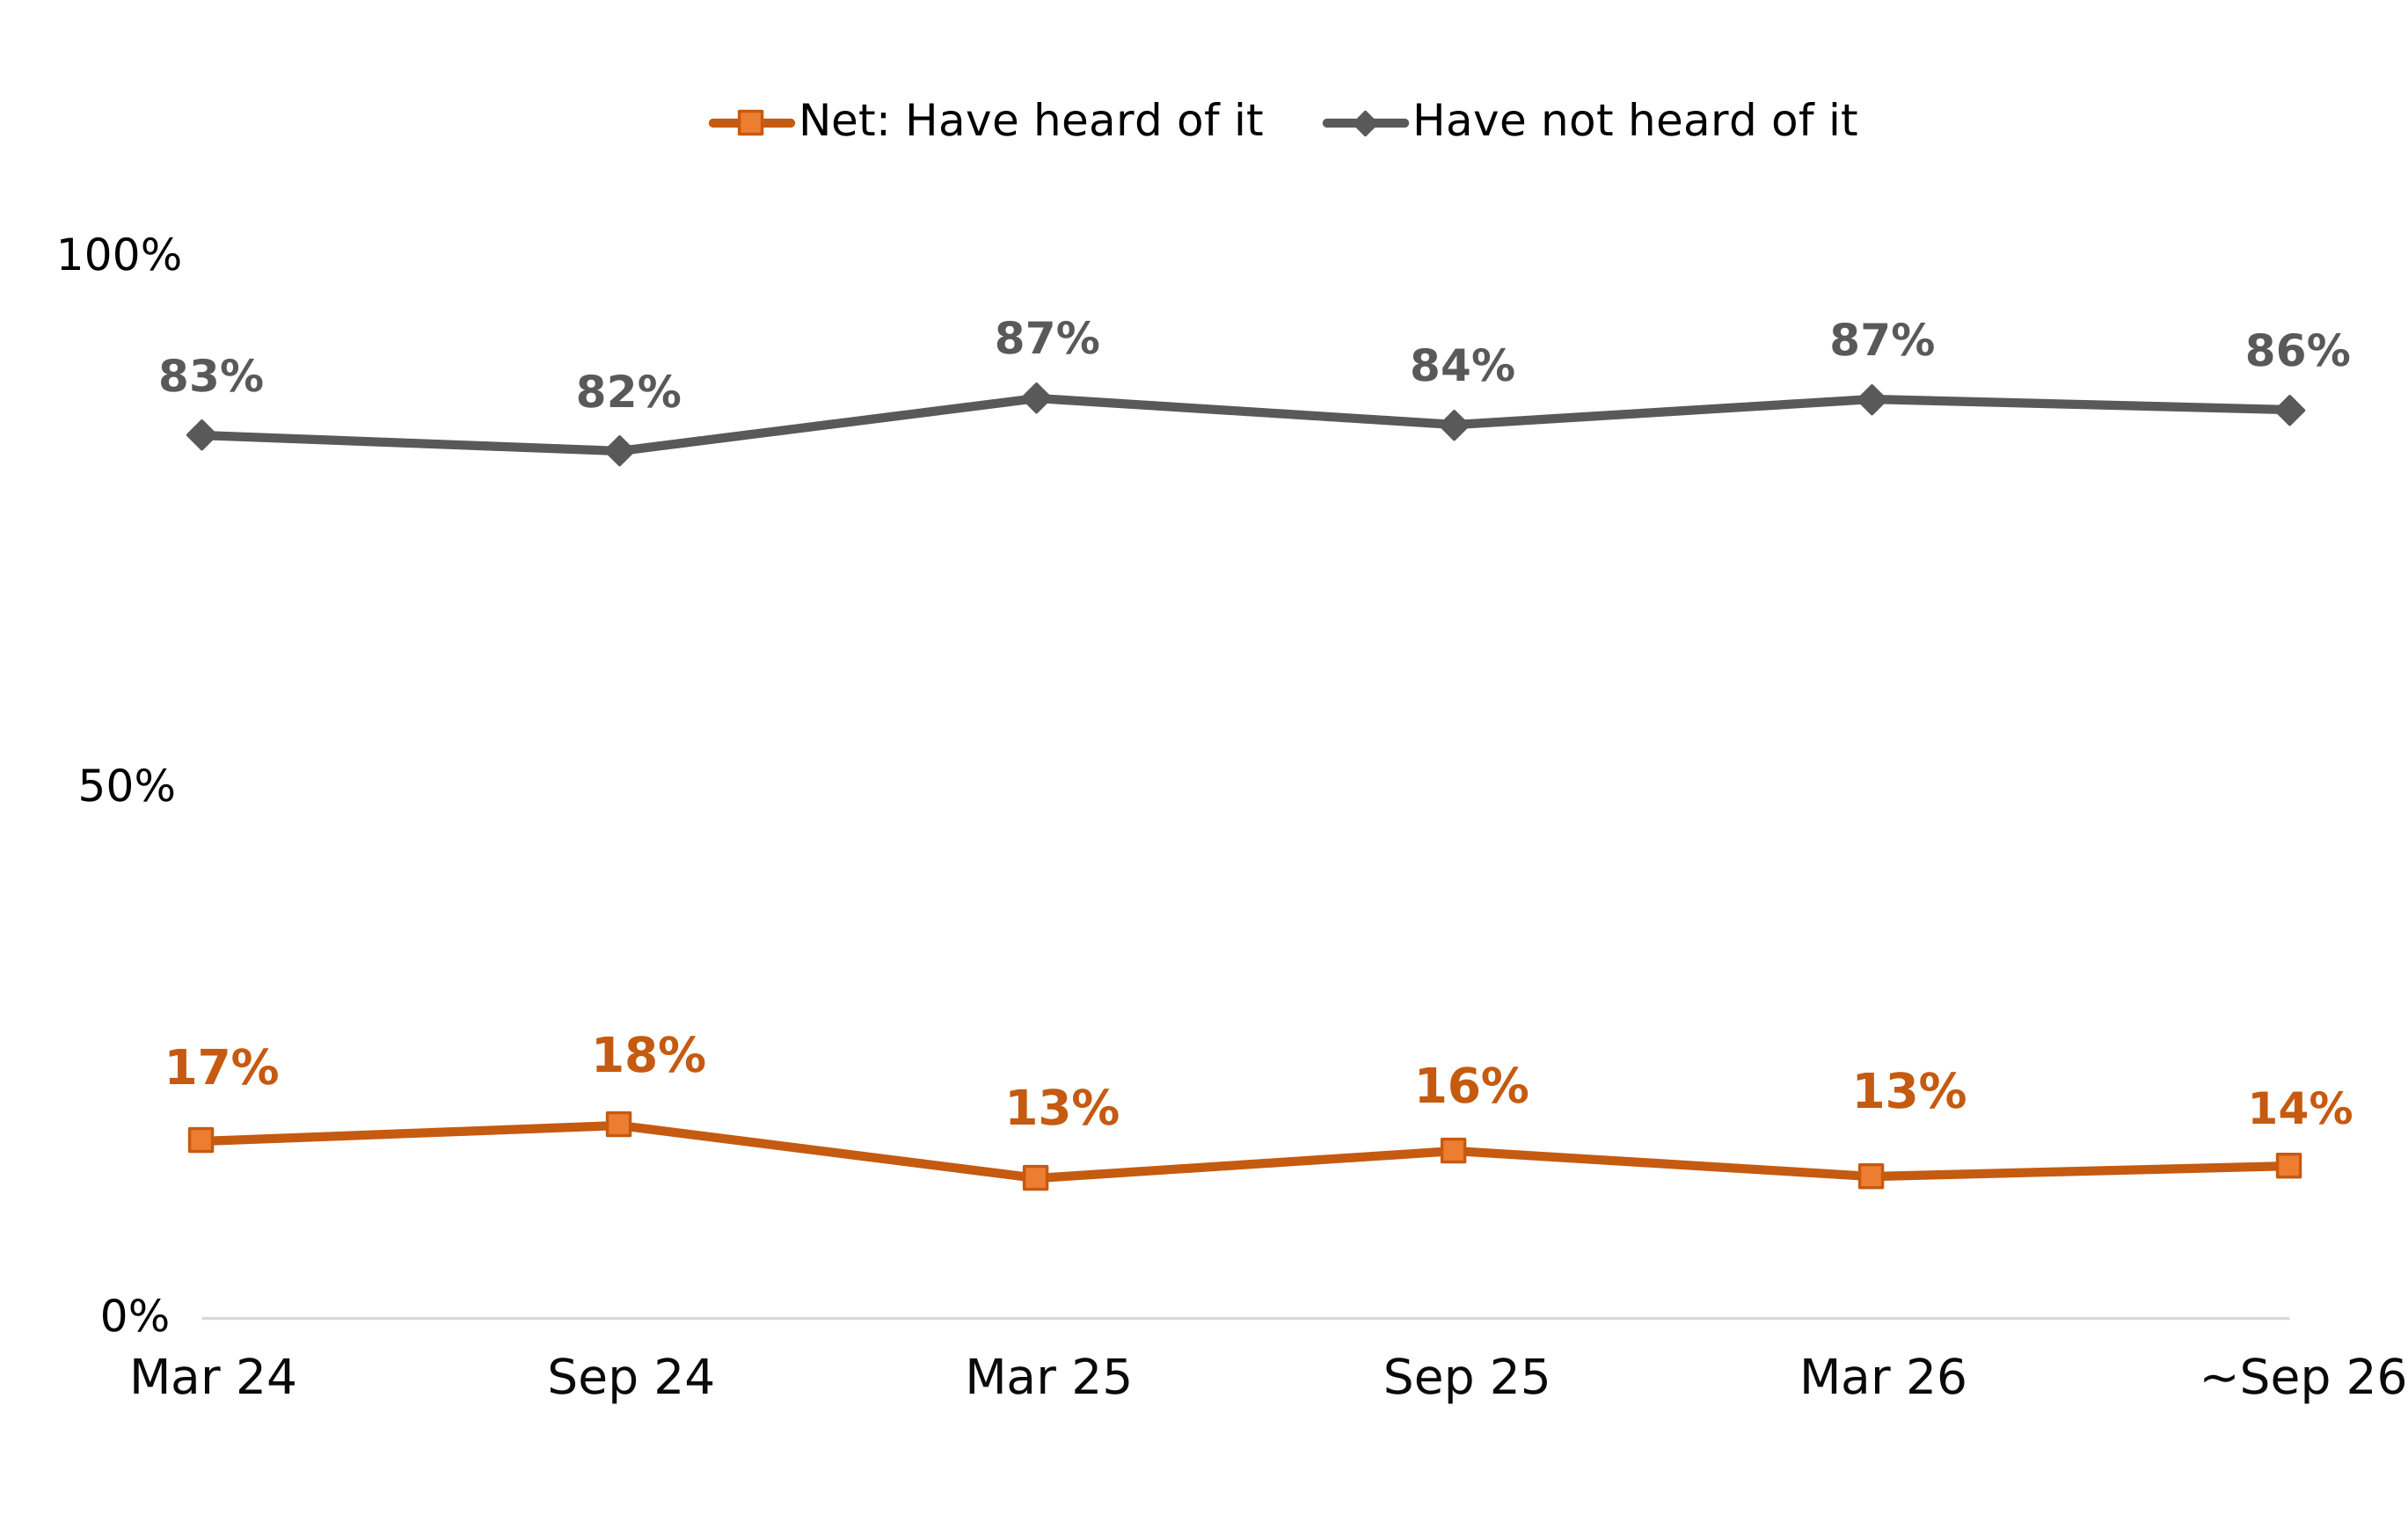
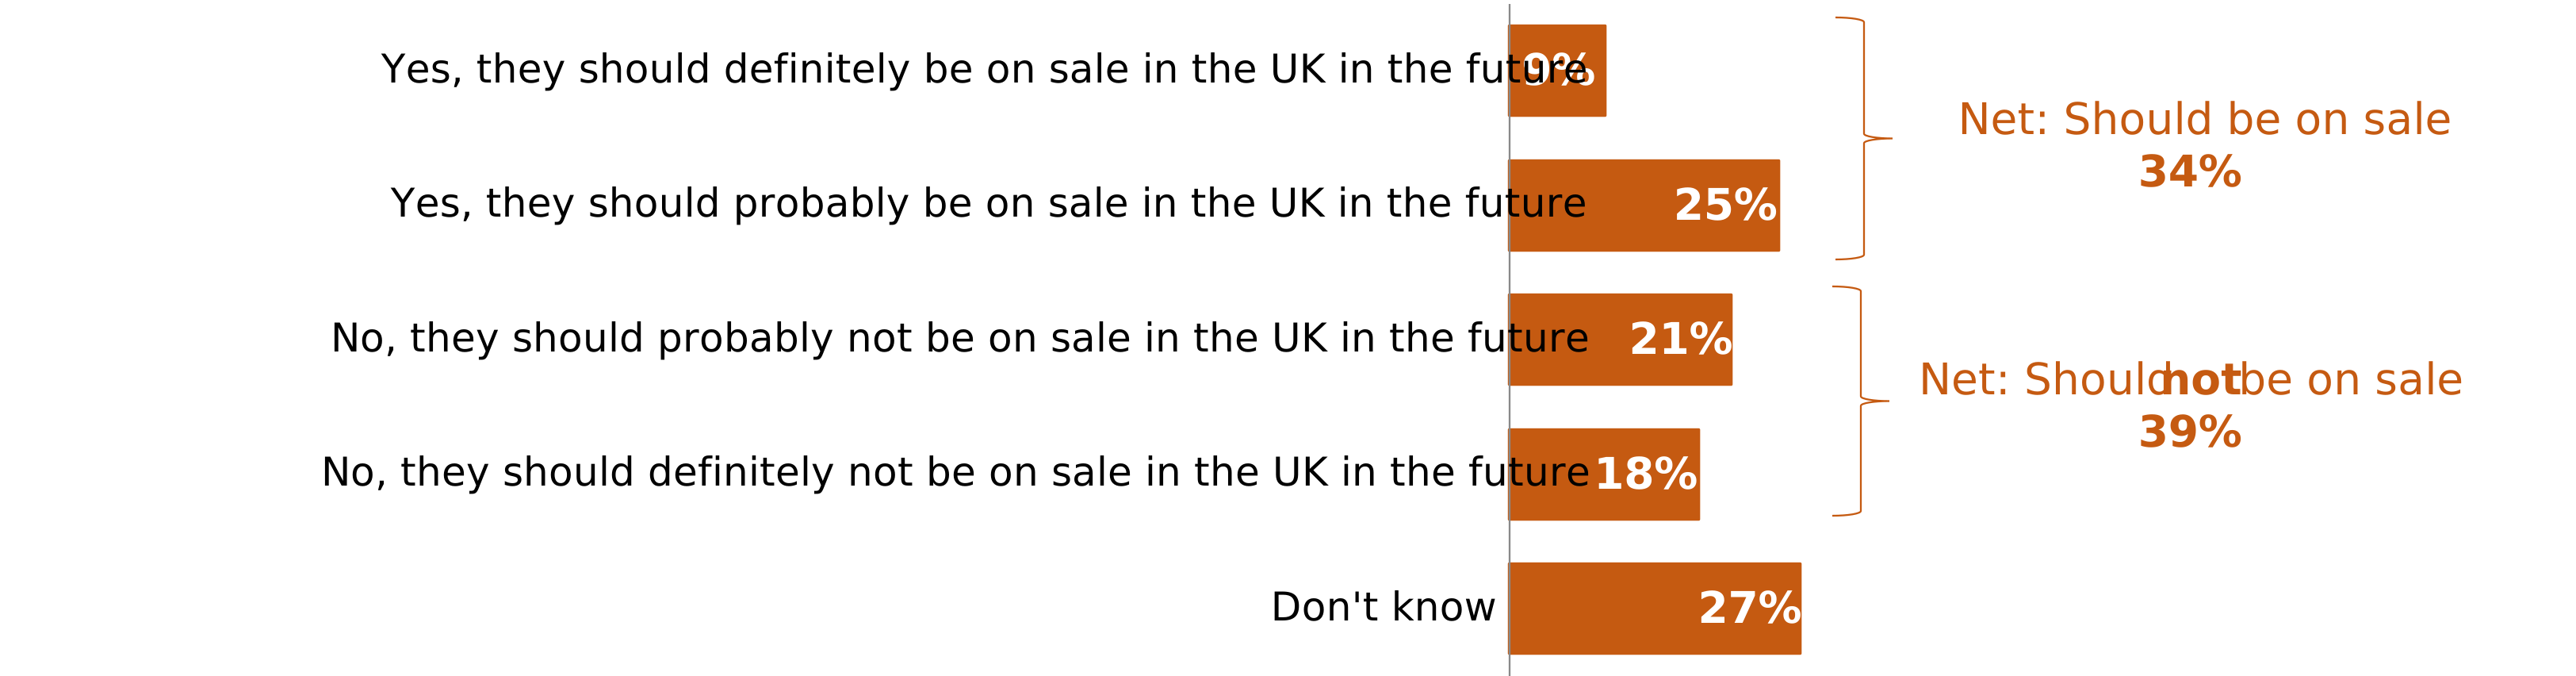
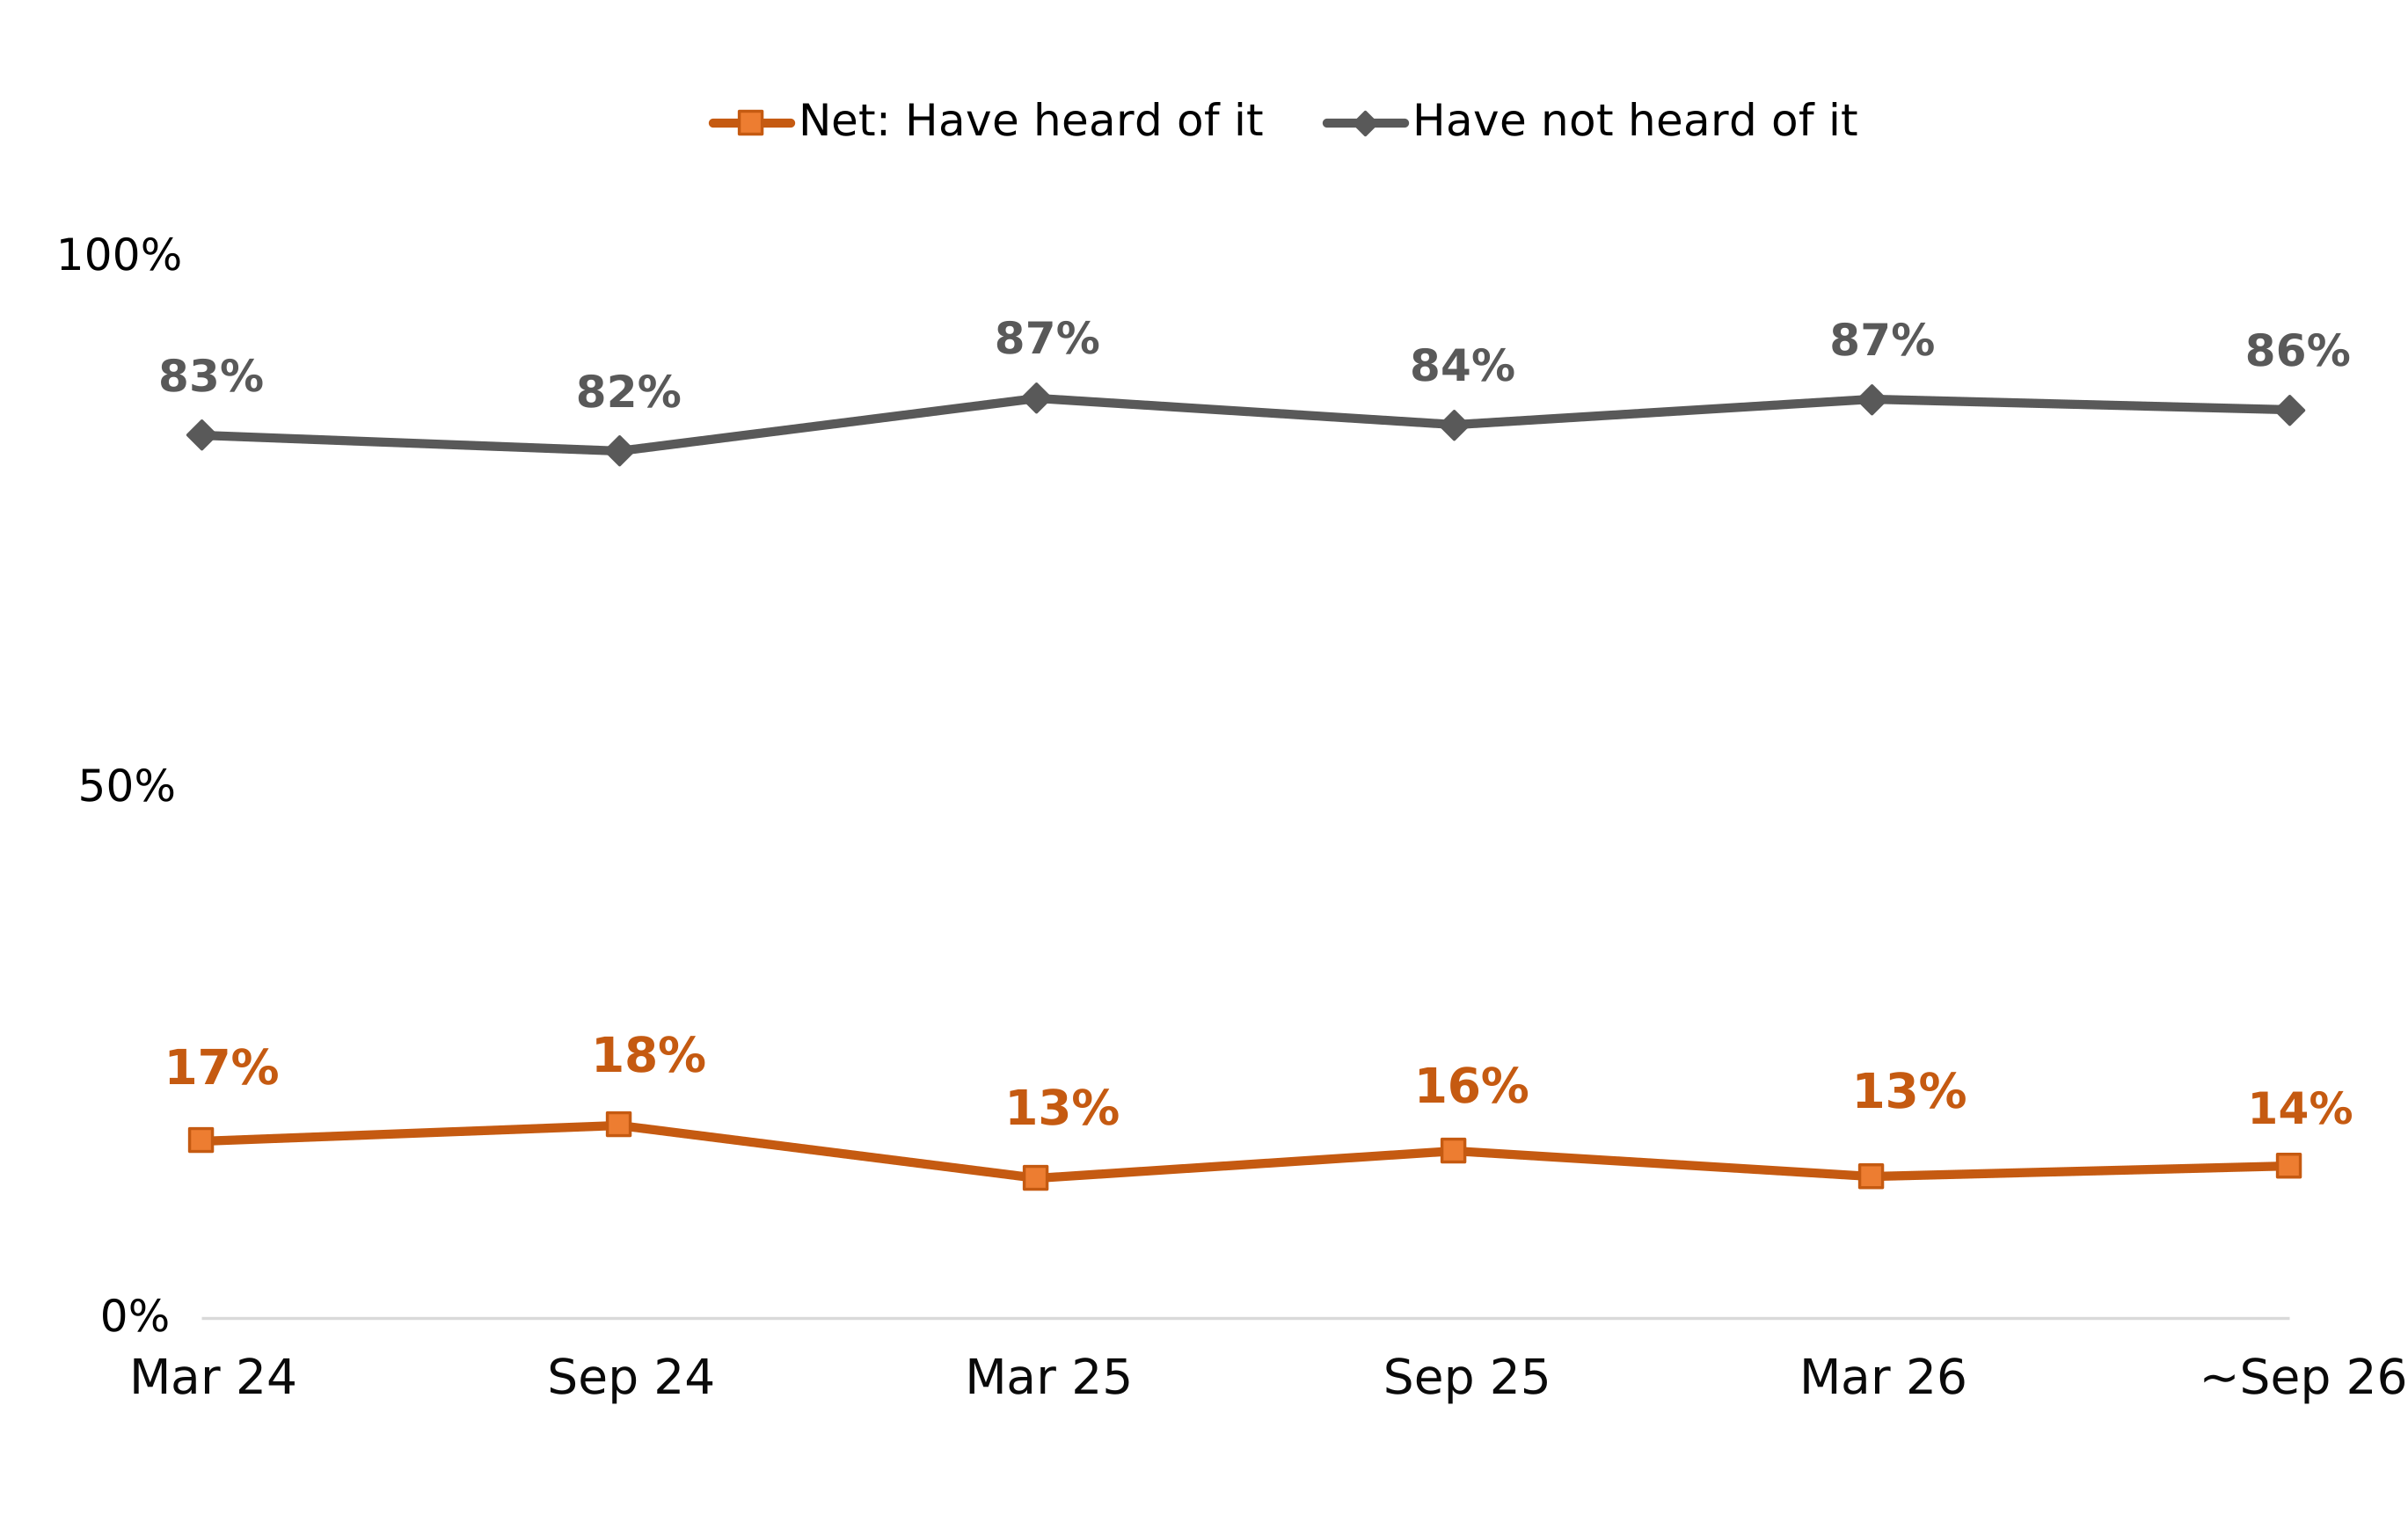
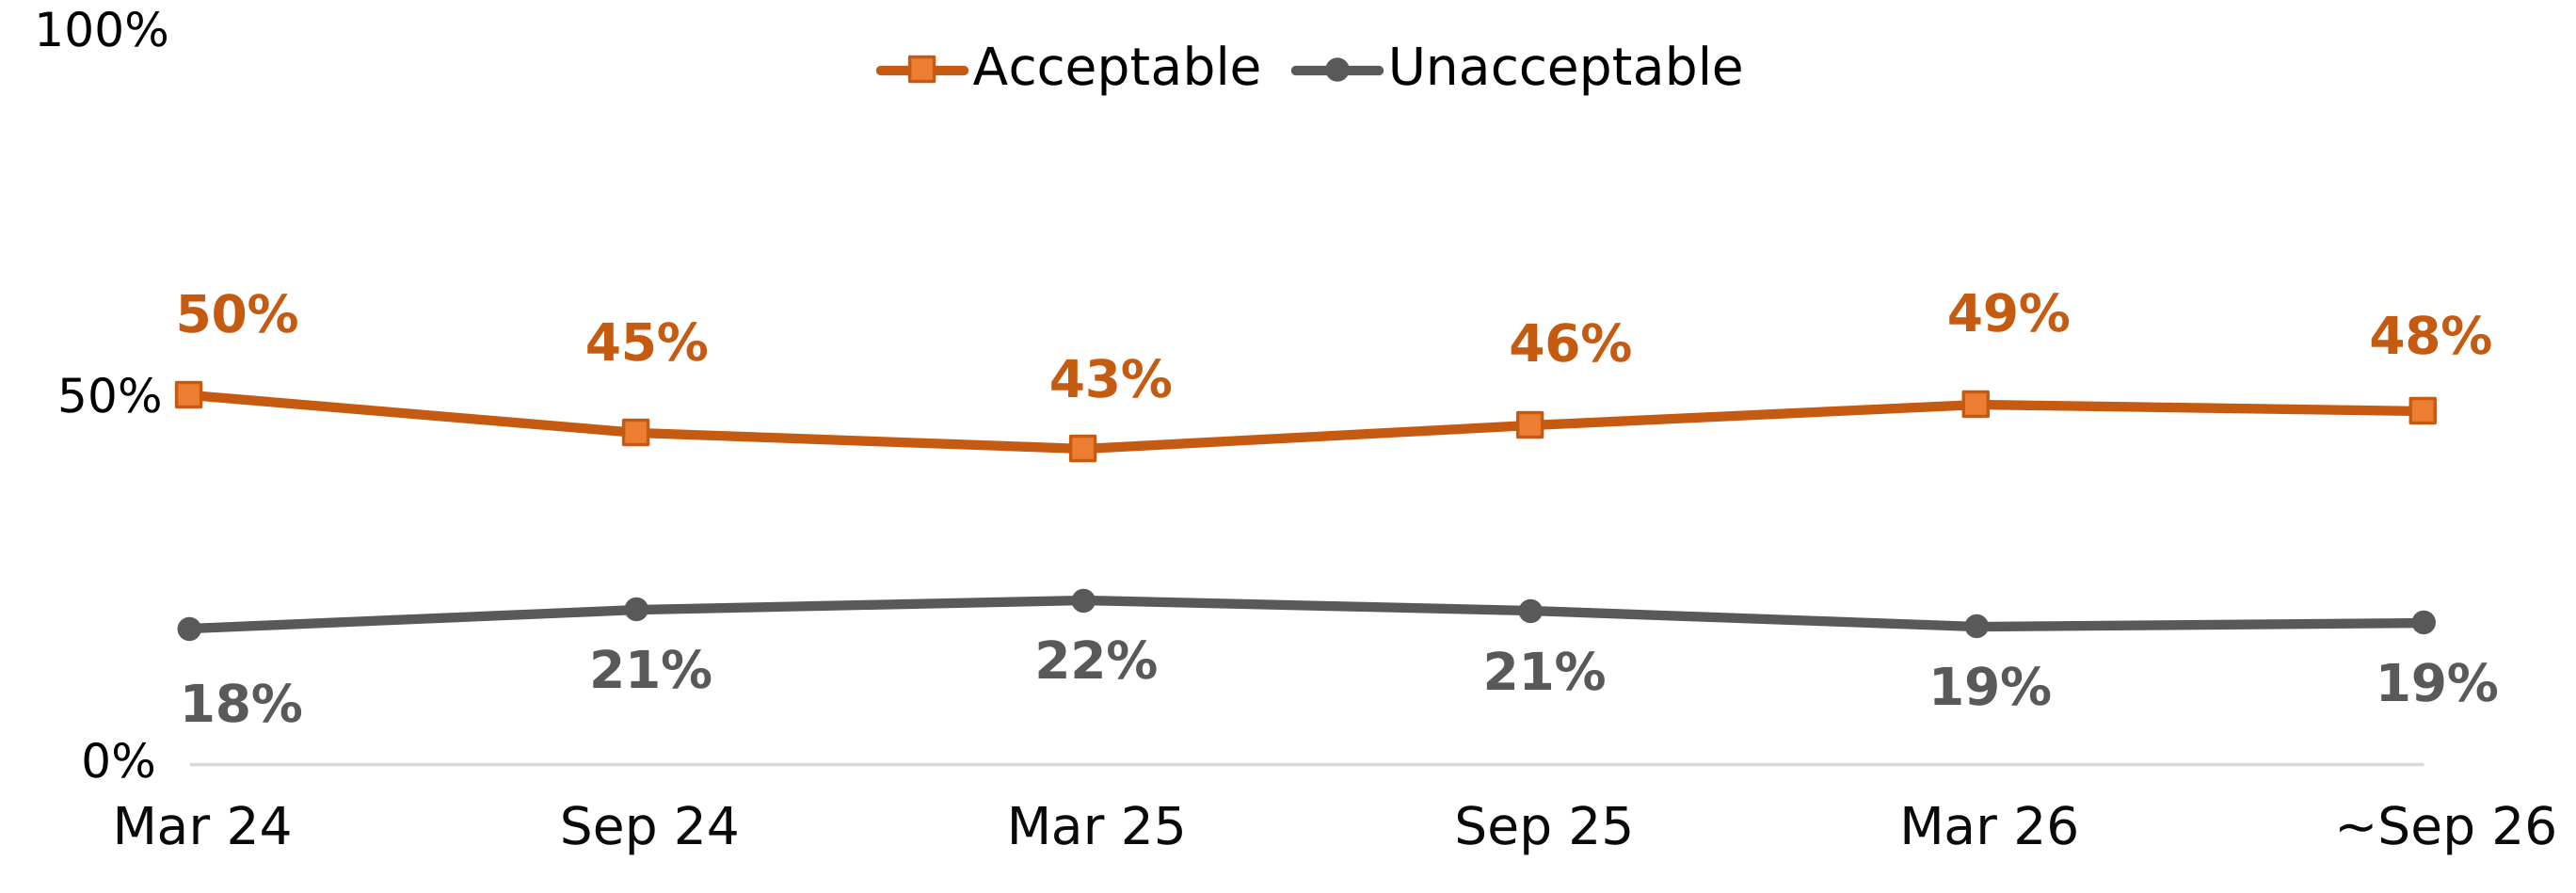
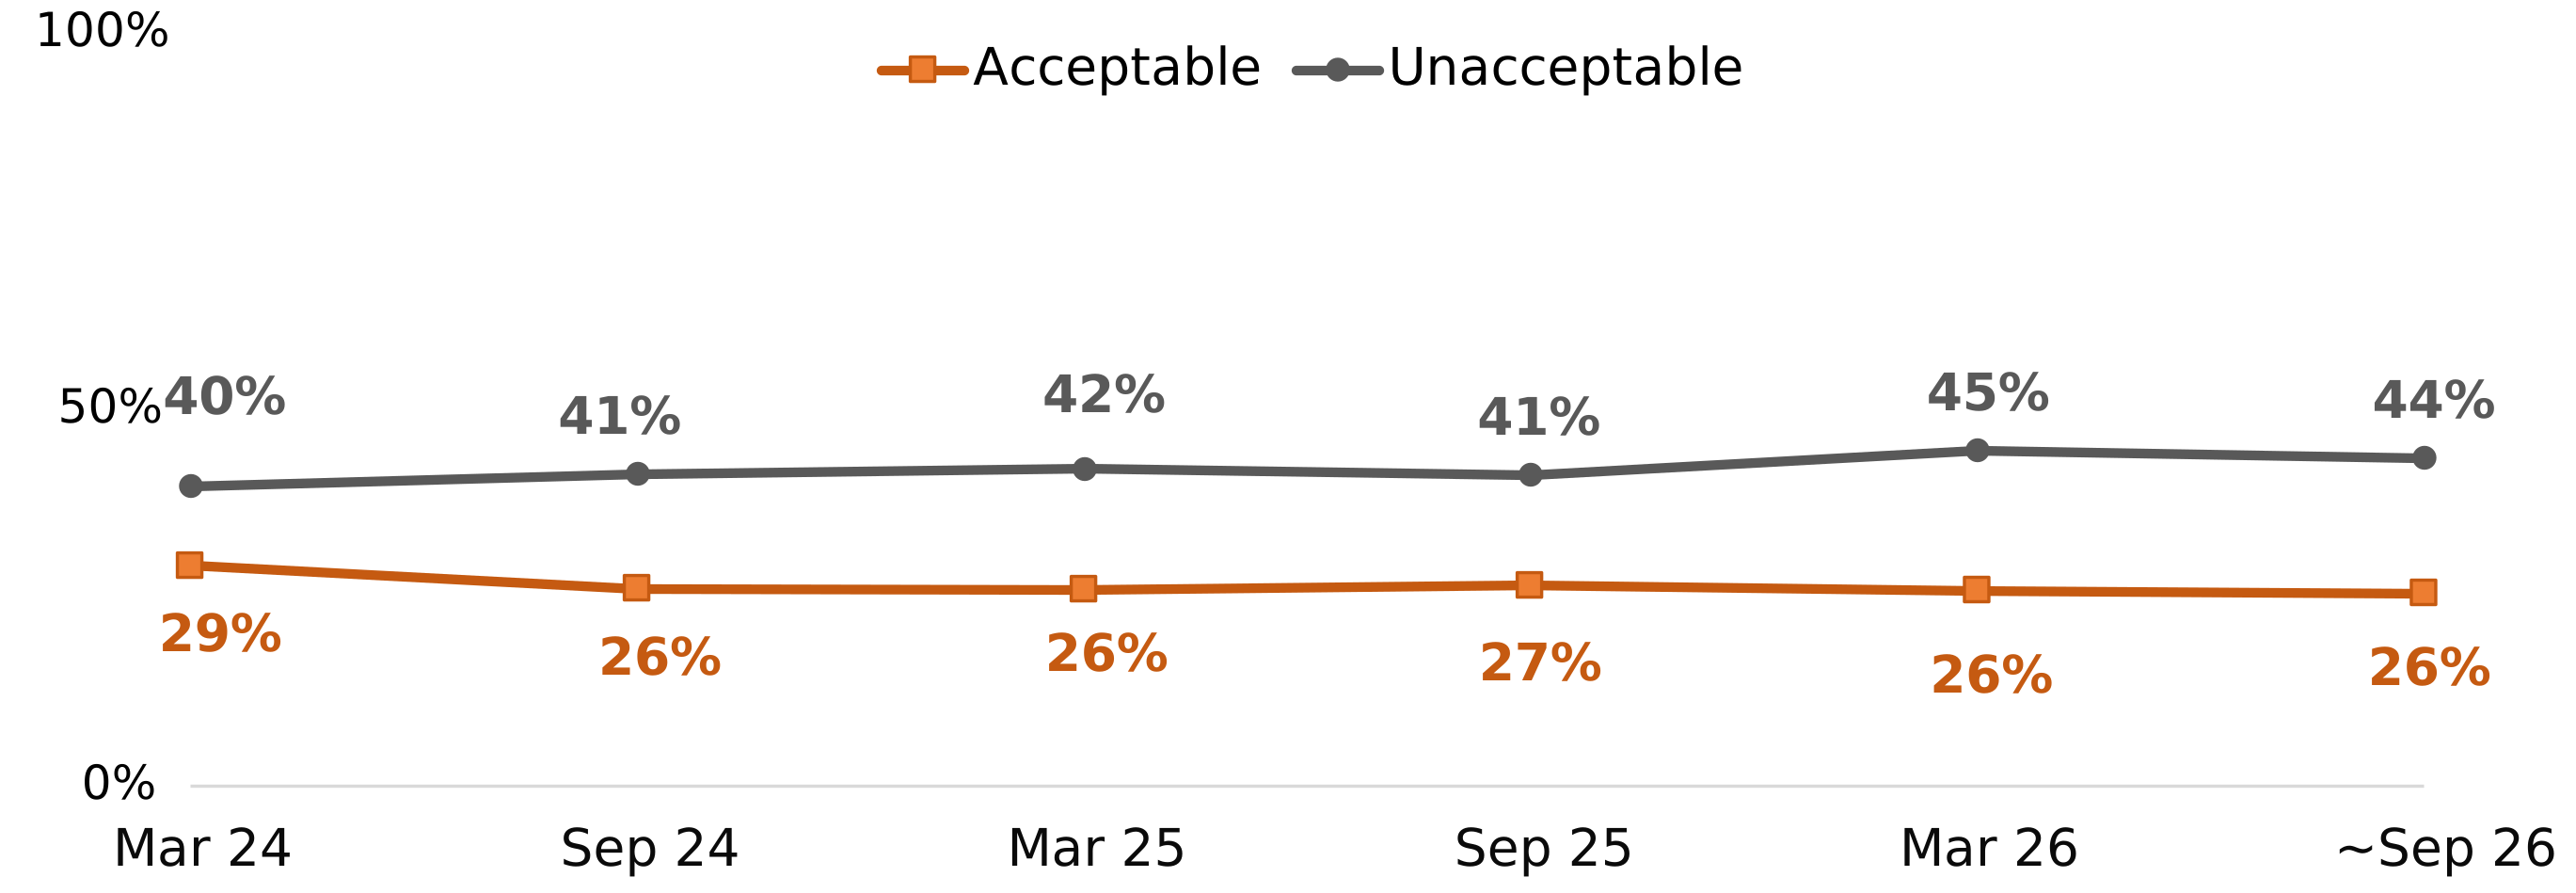
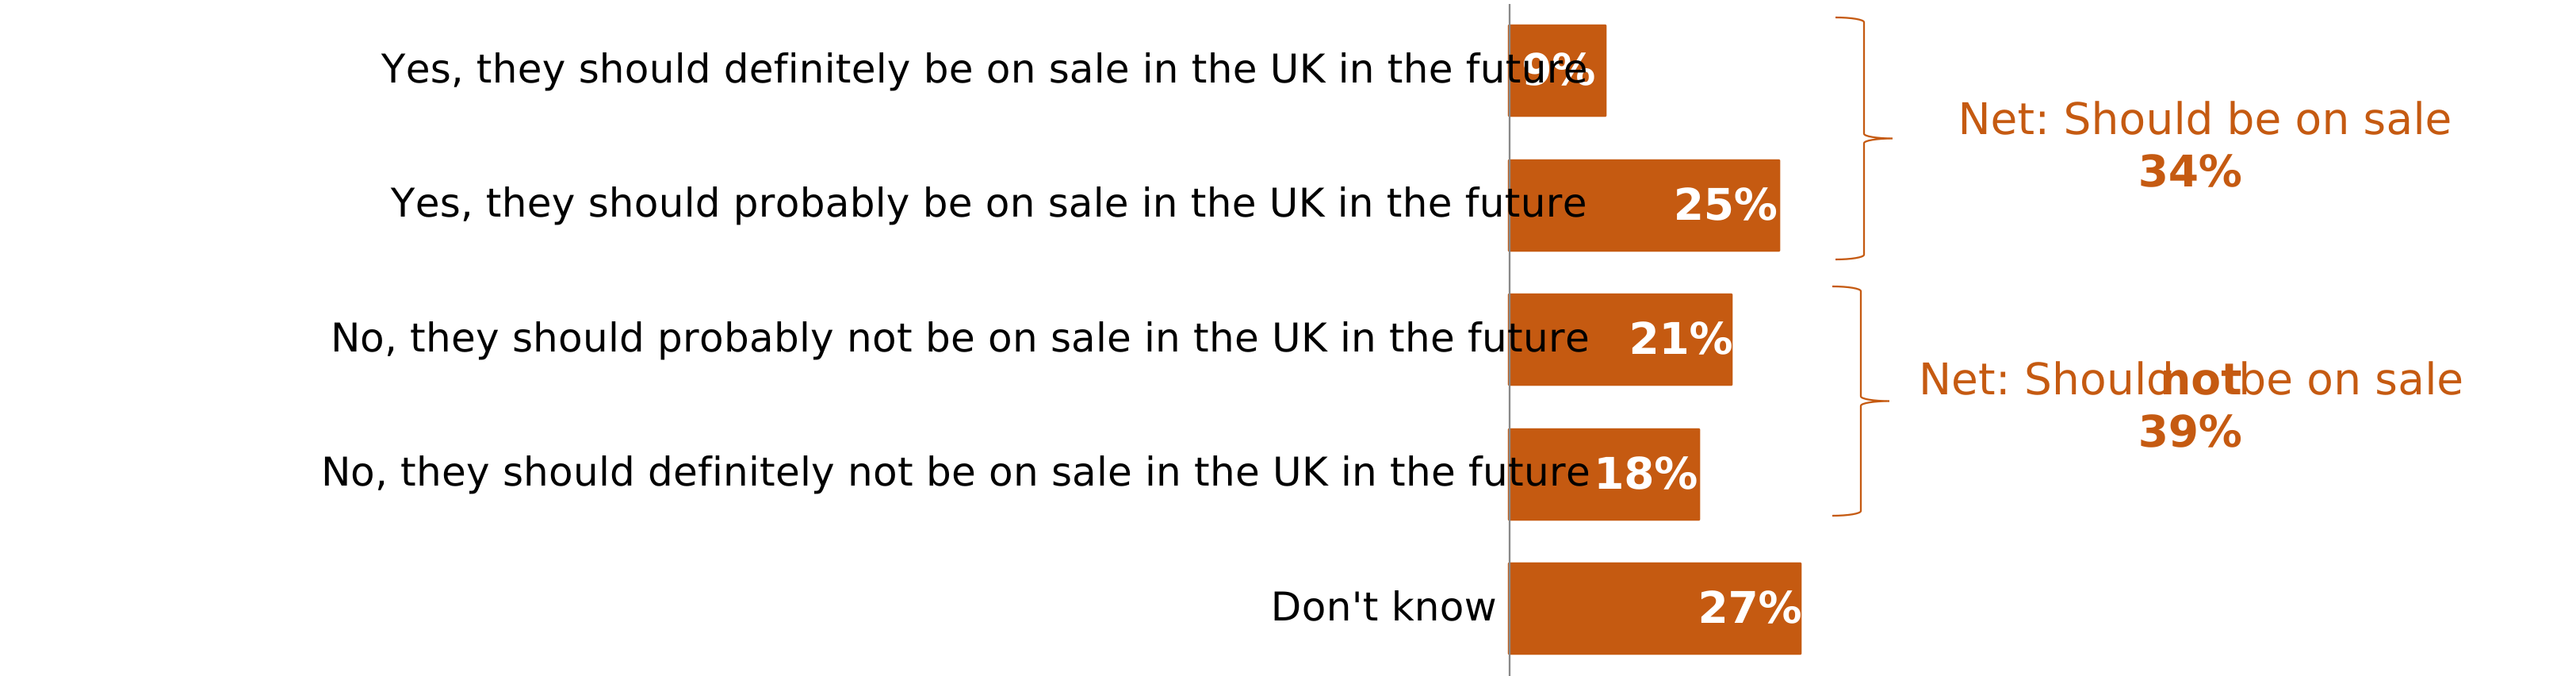
Precision breeding: In September 26, 14% of respondents said they had heard of precision breeding, consistent with when this was last asked in March 26 (13%). Respondents were slightly more likely to think precision bred food products should not be on sale in the future (39%) than should (34%). They were also slightly more likely to say they would not include them in their diet (42%), than would (36%).
-
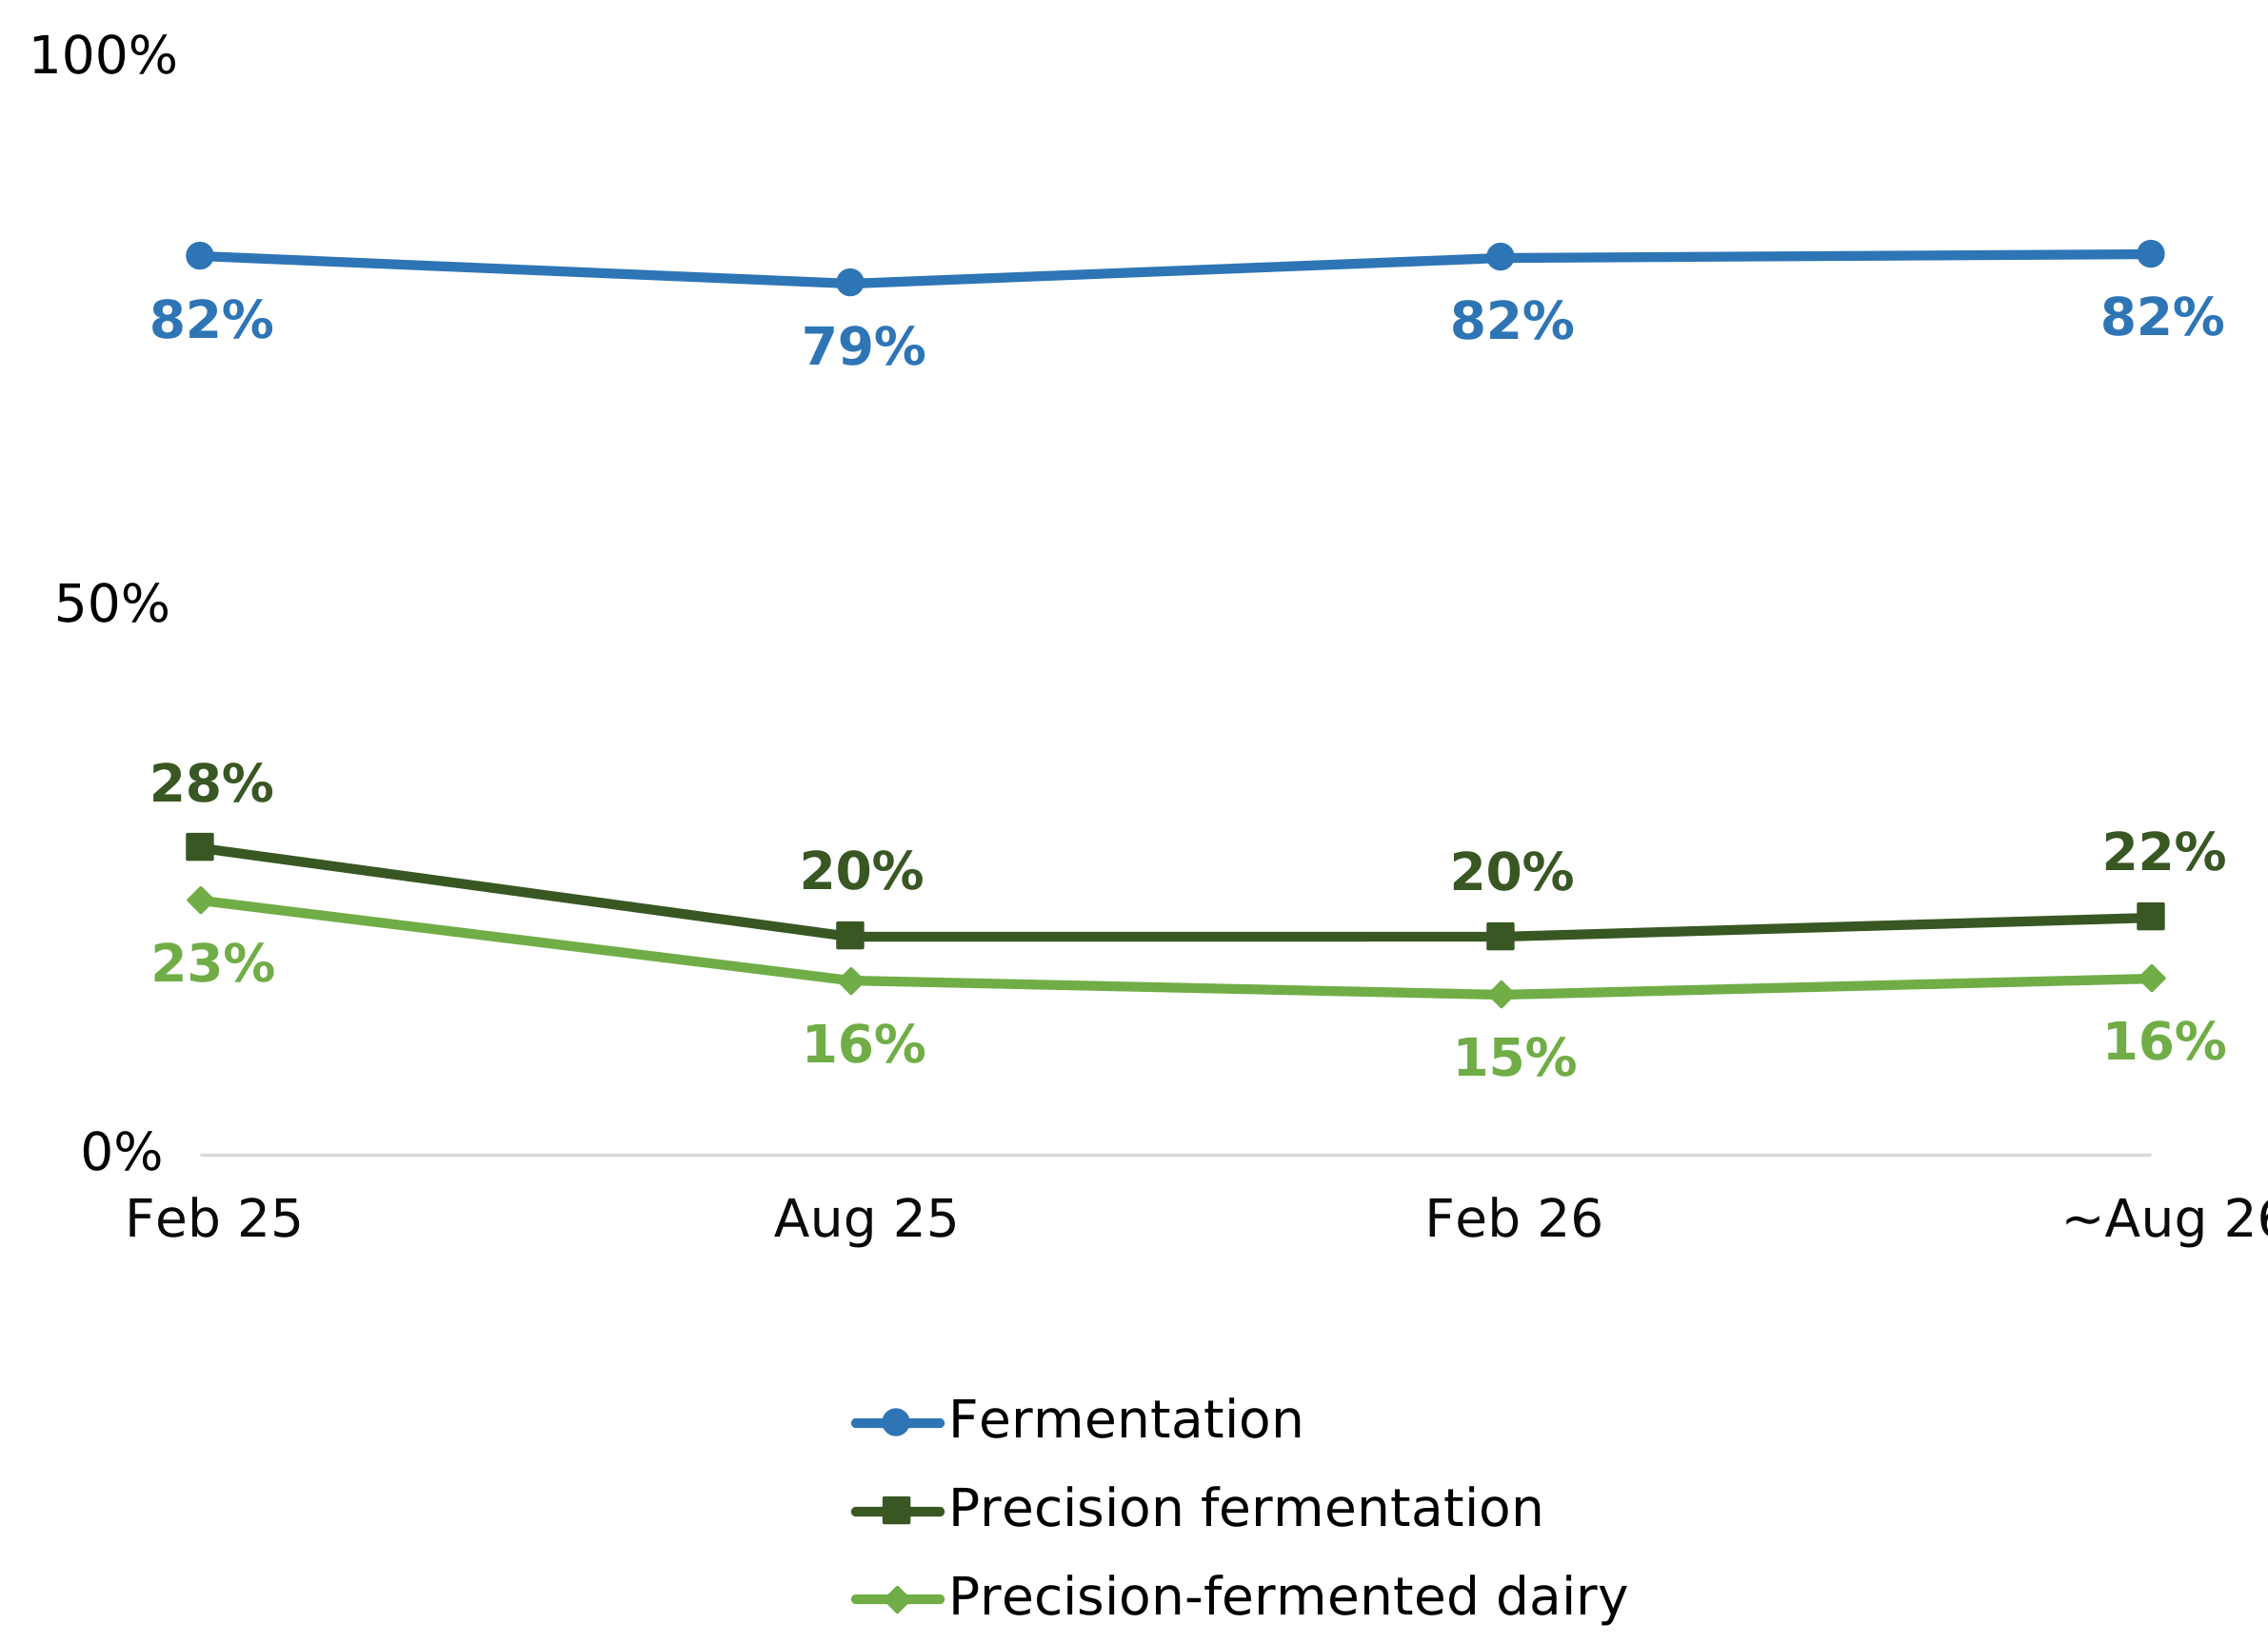
Precision fermentation: In August 26, 22% of respondents had heard of precision fermentation when prompted with a definition, consistent with when this was last asked in February 26 (20%). Most commonly, respondents said they ‘don’t know’ if precision fermented dairy should be on sale in the future (45%), with a similar proportion saying they would not be willing to include it in their diet (43%). This is consistent with when last asked in February 26 (both 44%).
2. Background and methodological information
2.1. Survey topics
This report presents findings for topics we track regularly including consumer concerns in relation to food, food affordability, and trust in the FSA as a regulator.
The core questions in this survey underwent review before the launch of the April 2025 survey. Some new questions and/or statements were introduced, resulting in a new time series for some questions/statements. Please see the notes on each slide for further information.
Between July and September 2026, questions were also asked about consumer views on misleading information (July), communications from the FSA (July and August), glycerol (July and August), precision fermentation (August), precision breeding (September), and the Sanitary and Phytosanitary (SPS) agreement (September).
Findings on precision fermentation and precision breeding can be found in this report.
Data for all questions can be found in the accompanying data tables.
2.2. Method
-
This research was conducted online using the YouGov panel which gives access to 400,000 active panel members in the UK.
-
This report presents findings from July–September 2026. Where appropriate, comparisons are made to previous waves since July 2023.
-
Across England, Wales and Northern Ireland 2,143 people took part in the survey in July (3rd-6th), 2,283 in August (7th-10th) and 2,117 in September (4th-7th).
-
Quotas were set by age, gender, social grade, education, region, and (from June 2026) ethnicity. The data is also weighted to be representative of the population by these demographic variables. All results are based on final weighted data.
-
In June 2026, the sampling and weighting approach was updated to include ethnicity. Comparability tests were conducted and the impact on tracking was determined to be minimal. However, this methodological change should be considered when comparing June 2026 onwards with previous waves.
-
Further details on the methodology including strengths and limitations can be found in our technical report.
2.3. Notes for interpretation
-
Reporting convention (↑ / ↓ on graphs): The Consumer Insights Tracker uses t-tests to assess differences over time and between groups, and highlights those where the p value is <0.05. Due to the quota sampling methodology used this is not an exact test of whether differences are statistically significant and indicative of real changes in wider population. However, they may highlight where there could be shifts in behaviour or attitudes and further research would be required to assess if these changes are real.
-
Online panel survey: As respondents are selected from an online panel, people without internet access are not represented.
-
Percentages: Figures may not add up to 100% on graphs due to figures being rounded to the nearest whole number, or because in some questions, respondents were able to select multiple answers. In some cases, rounding may make changes appear smaller or larger than they are in the underlying data. Statistical tests have been conducted using the unrounded figures.
3. Results
3.1. Food affordability
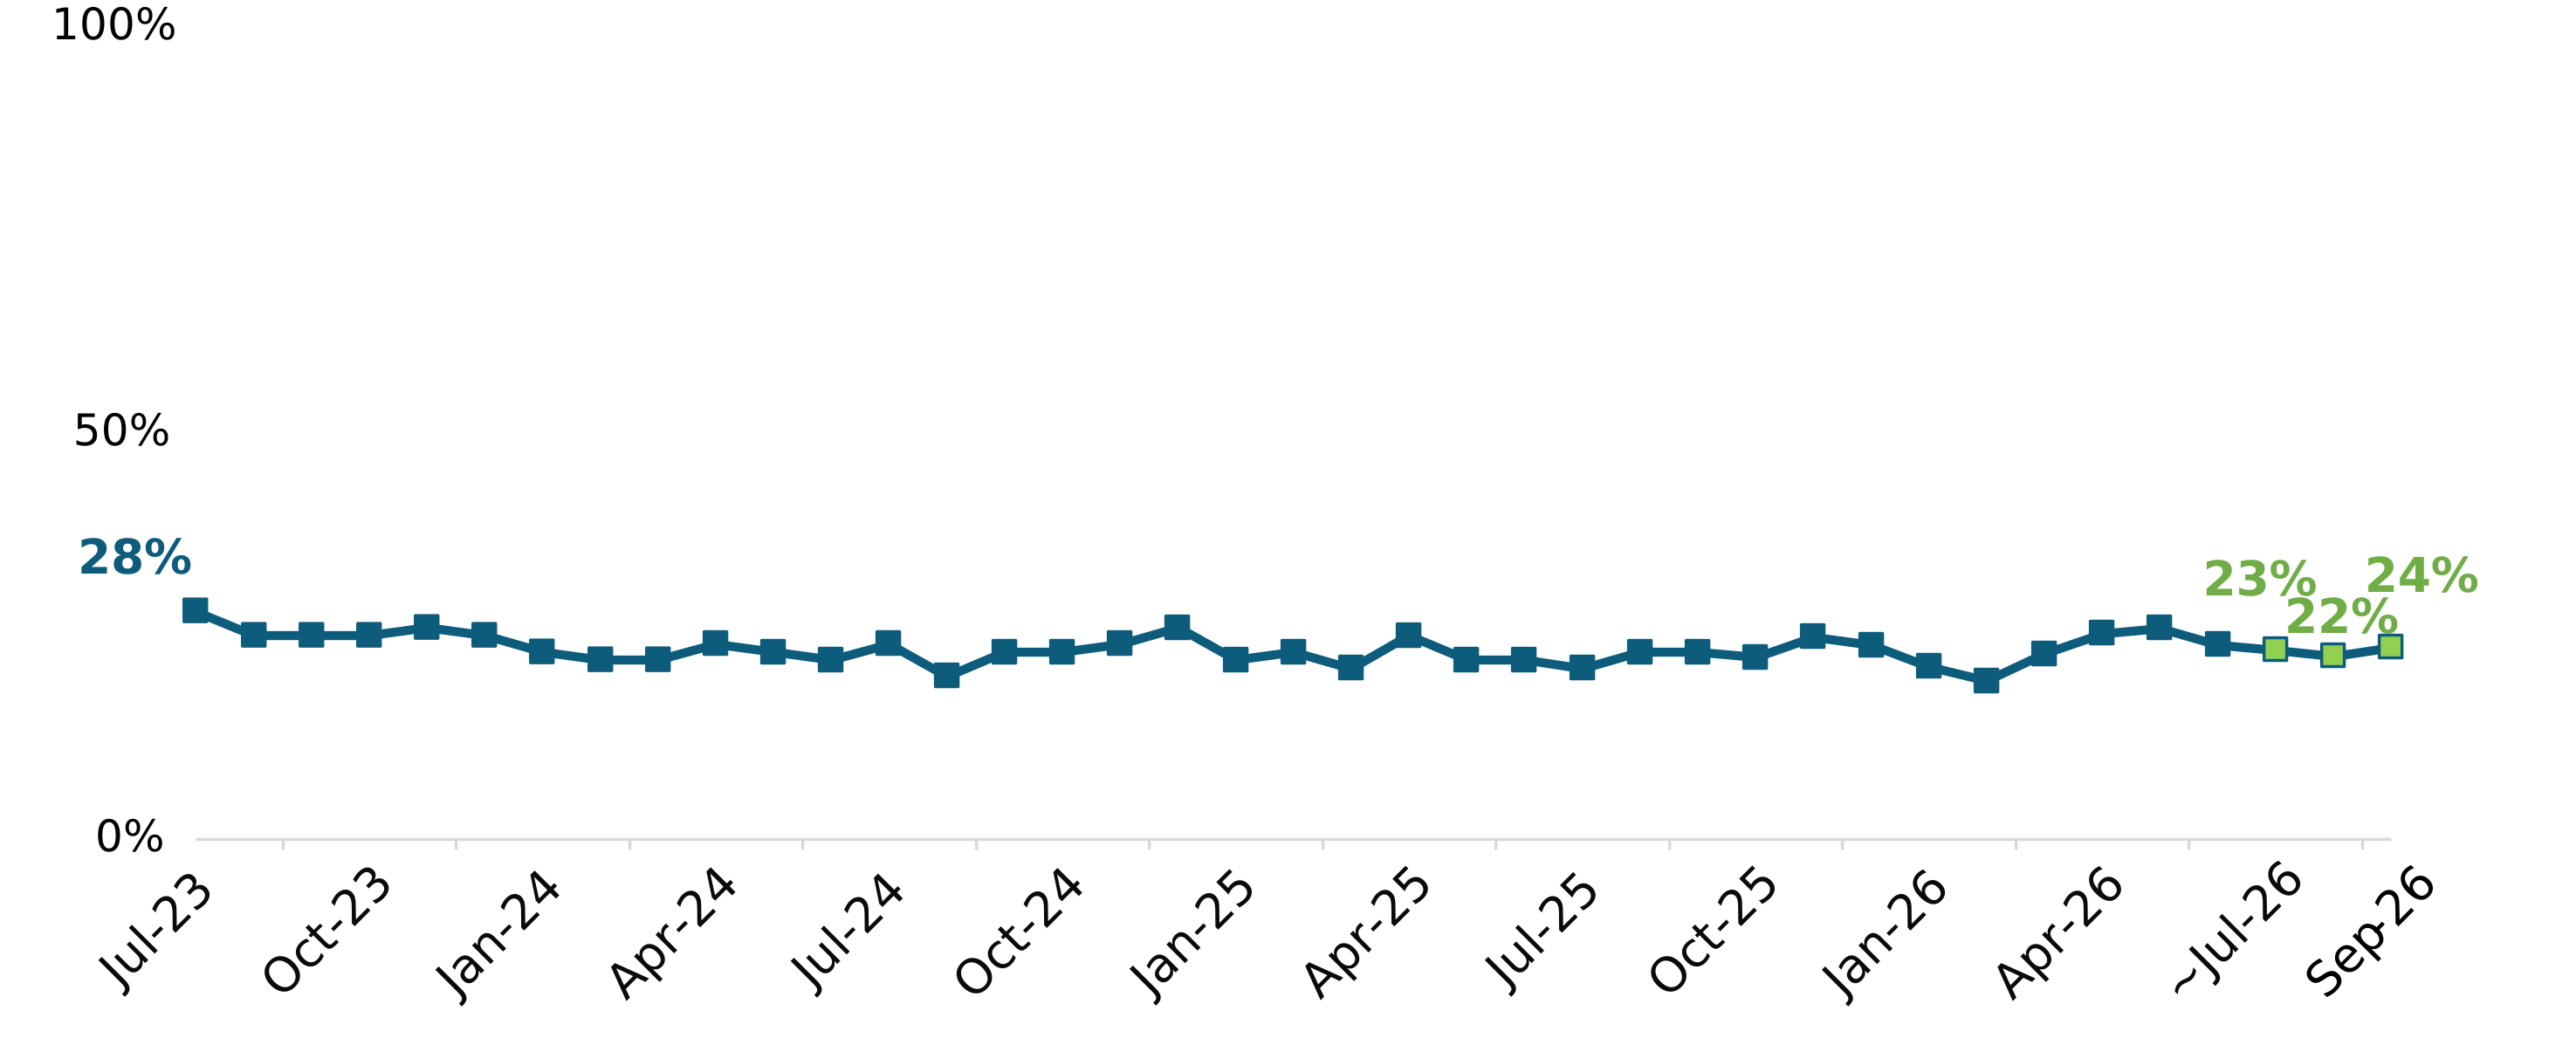
Figure 1 shows the proportion of respondents who said they were worried about their household not being able to afford food remained stable between July and September 26 (ranging from 22% to 24%). Levels were broadly in line with those seen in the previous quarter (24% to 26%).
Eating leftovers that had been kept in the fridge for more than two days (61%) and eating food past its use-by date (60%) remained the most commonly reported money-saving behaviours in September 26, as shown in Figure 2. These were also the most commonly reported money-saving behaviours in the previous quarter.
3.2. Food concerns
Figure 3 shows in September 26, when shown a list of food-related topics, respondents most commonly said they were concerned about food prices (91%), followed by ultra-processed food (77%).
The proportion who were concerned about food shortages increased slightly over the quarter, from 57% in July 26 to 64% in September 26. The proportion concerned about food poisoning in July (59%) and September 26 (60%) was slightly higher than in most other waves since tracking began in April 25.
3.3. The Food Standards Agency
Figure 4 shows that among respondents with some knowledge of the FSA, trust in the FSA remained broadly stable between July and September 26 (61% to 63%). This was comparable with the previous quarter (60% to 64%).
3.4. Food safety topics
As shown in Figure 5, ‘food poisoning outbreaks’ became the most commonly recalled food safety topic in September 26, with 45% of respondents saying they had seen, read, or heard something about it in the past month. This was a notable increase from 19% in August, and the highest proportion recorded since tracking began in April 25. ‘Recall of food products’ was the next most commonly reported topic (32%).
The proportion who had seen, heard or read about food fraud or food crime returned to a more typical level in September 26 (7%), after a peak of 17% in July 26.
Among respondents who had seen, heard or read about any of these food safety topics, the proportion reporting ‘the news’ as a source notably increased from 51% in August 26 to 67% in September 26, higher than all previous waves (47%-61%).
The lead-up to the September 26 fieldwork coincided with an outbreak of Salmonella in the UK.
3.5. Precision breeding
Figure 6 shows 14% of respondents in September 2026 had heard of precision breeding before, remaining comparable with all waves since March 25.
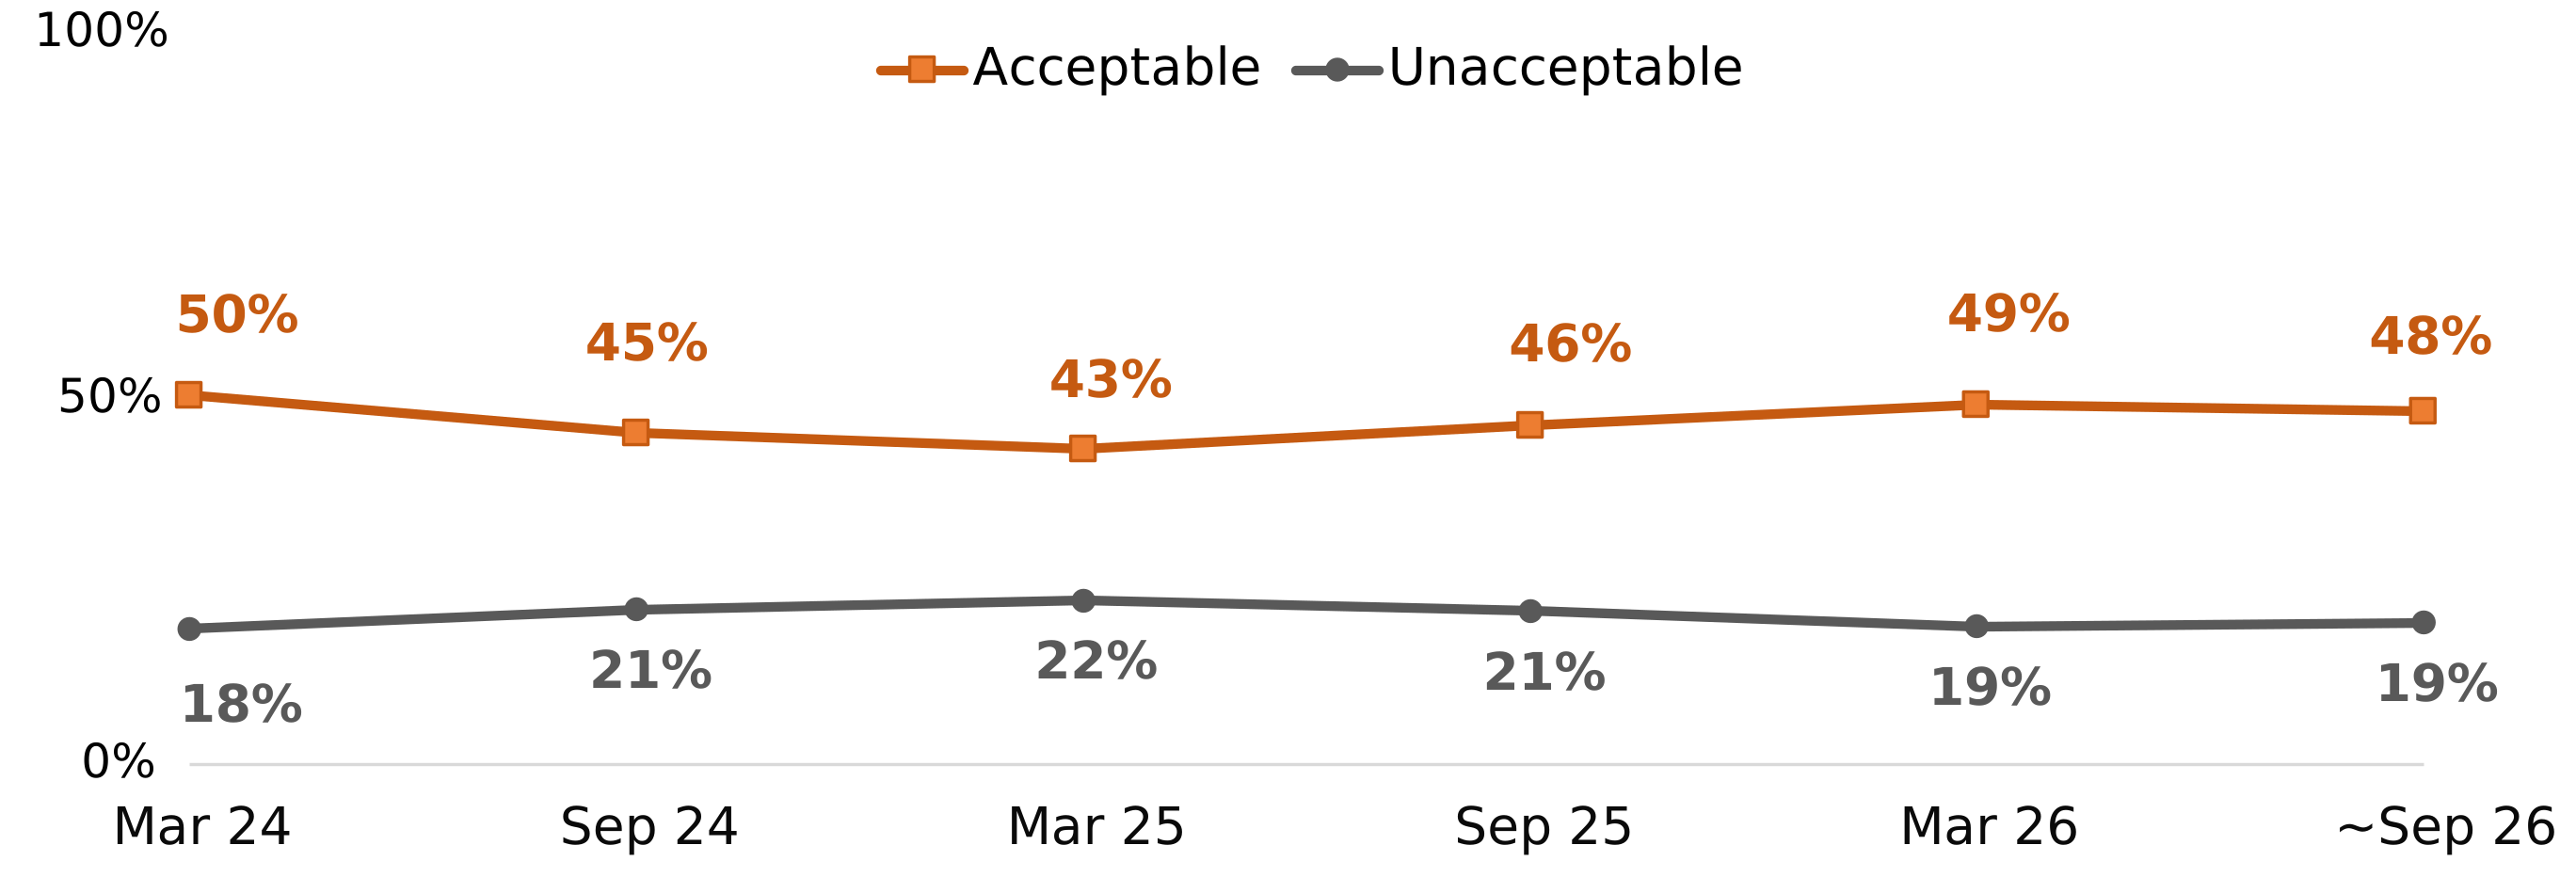
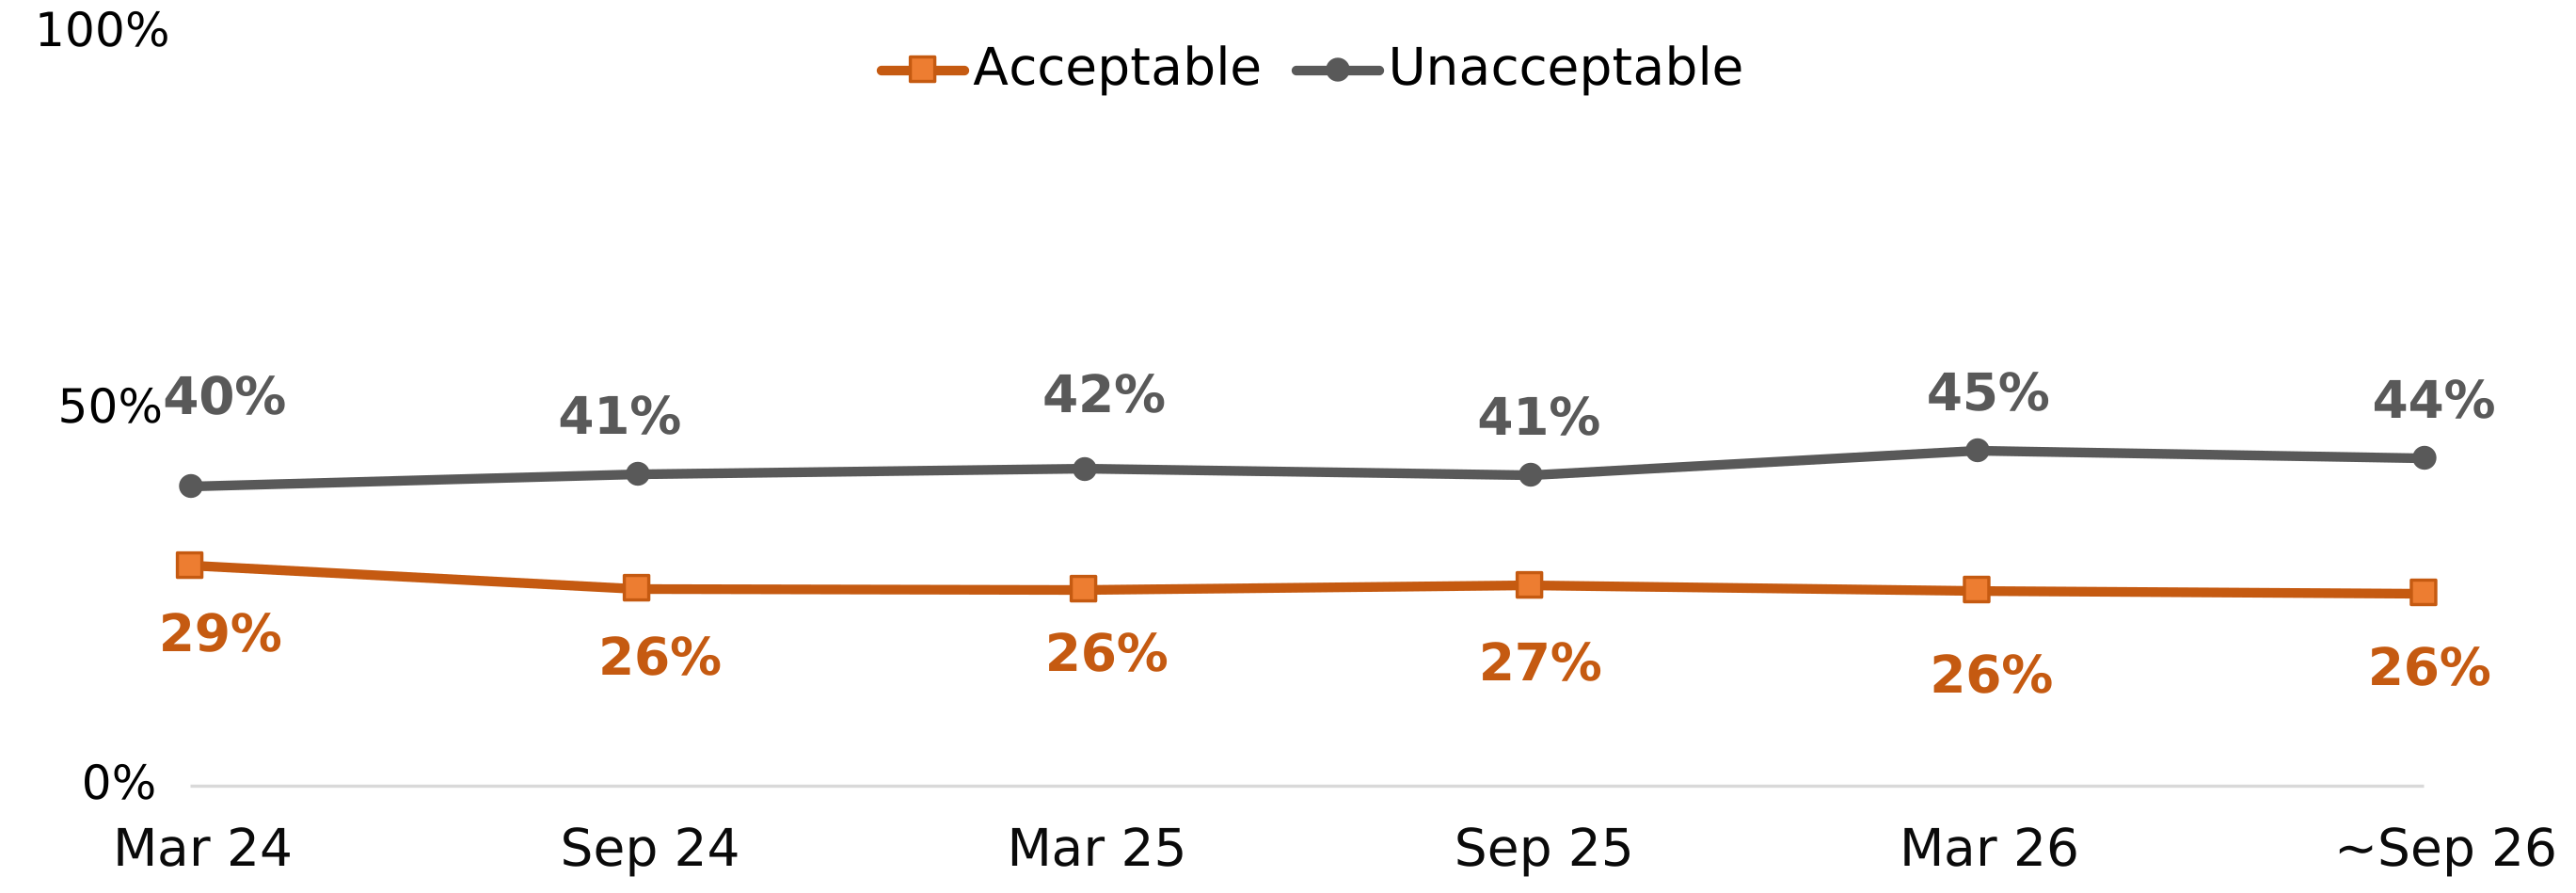
In September 26, respondents continued to be more accepting of precision breeding of plants (48%) than animals (26%), as shown in Figures 7 and 8. The proportion who said each was acceptable was consistent with most previous waves.
As shown in Figure 9, respondents in September 26 were slightly more likely to say that precision bred food products should not be on sale in the future (39%) than those who reported they should be on sale (34%). Just over a quarter (27%) said they didn’t know.
Similarly, respondents were slightly more likely to say they would be unwilling to include precision bred products in their diet if they were authorised for sale (42%) than those who were willing to include them (36%), as shown in Figure 10. Just over one in five (22%) said they didn’t know.

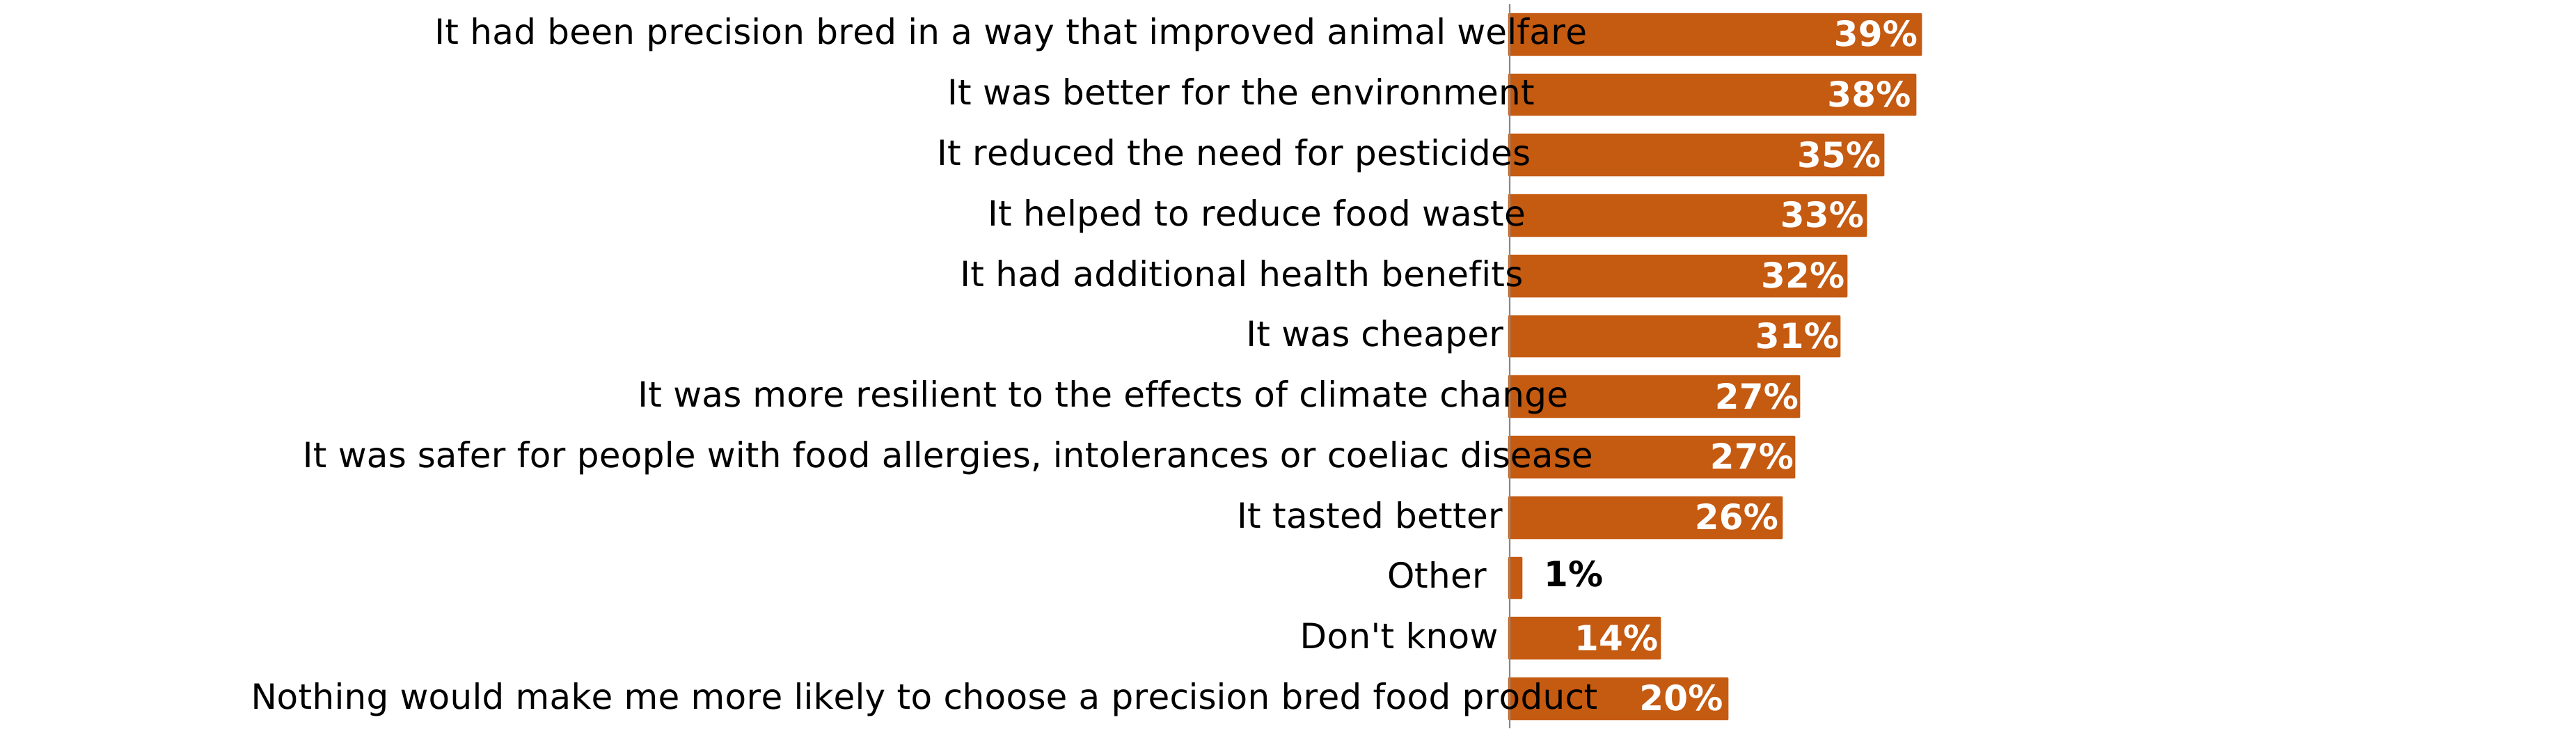
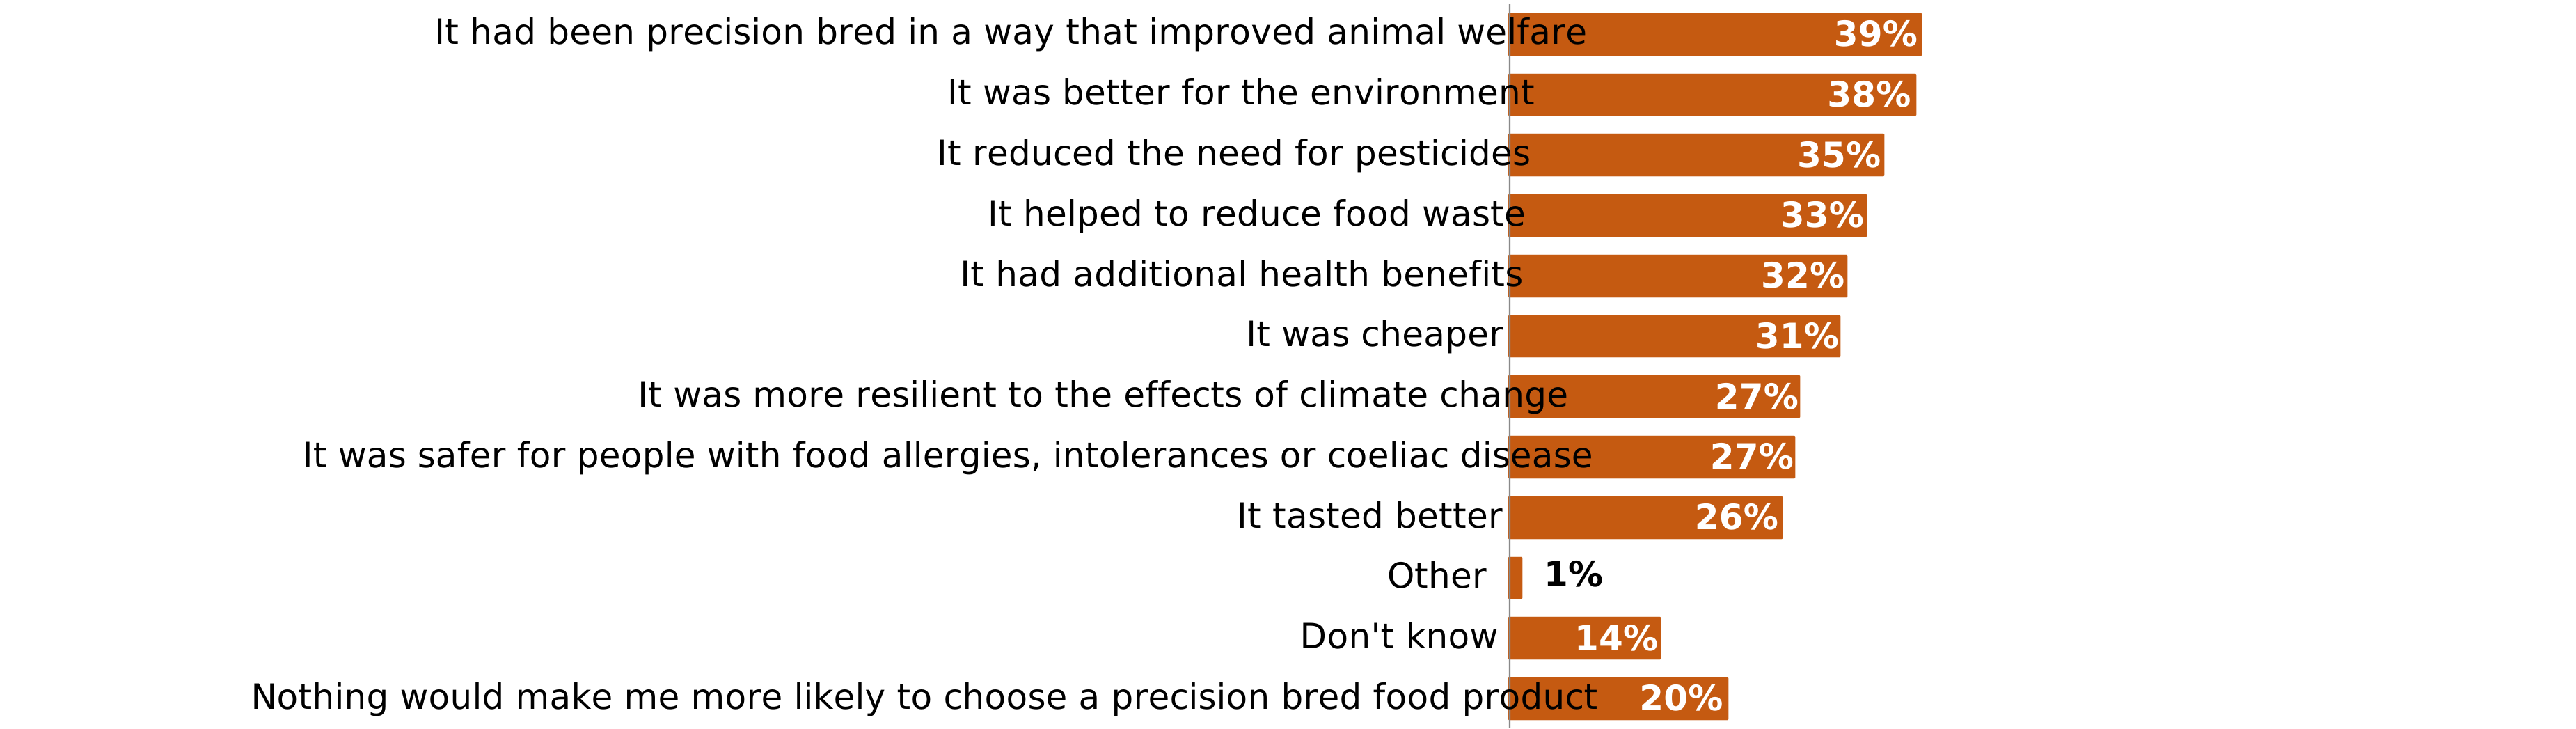
Figure 11 shows that in September 2026, improved animal welfare (39%) and environmental benefits (38%) were the most commonly selected factors that would make respondents more likely to choose a precision bred food product, over a non-precision bred alternative. 20% said nothing would make them more likely to choose these products.
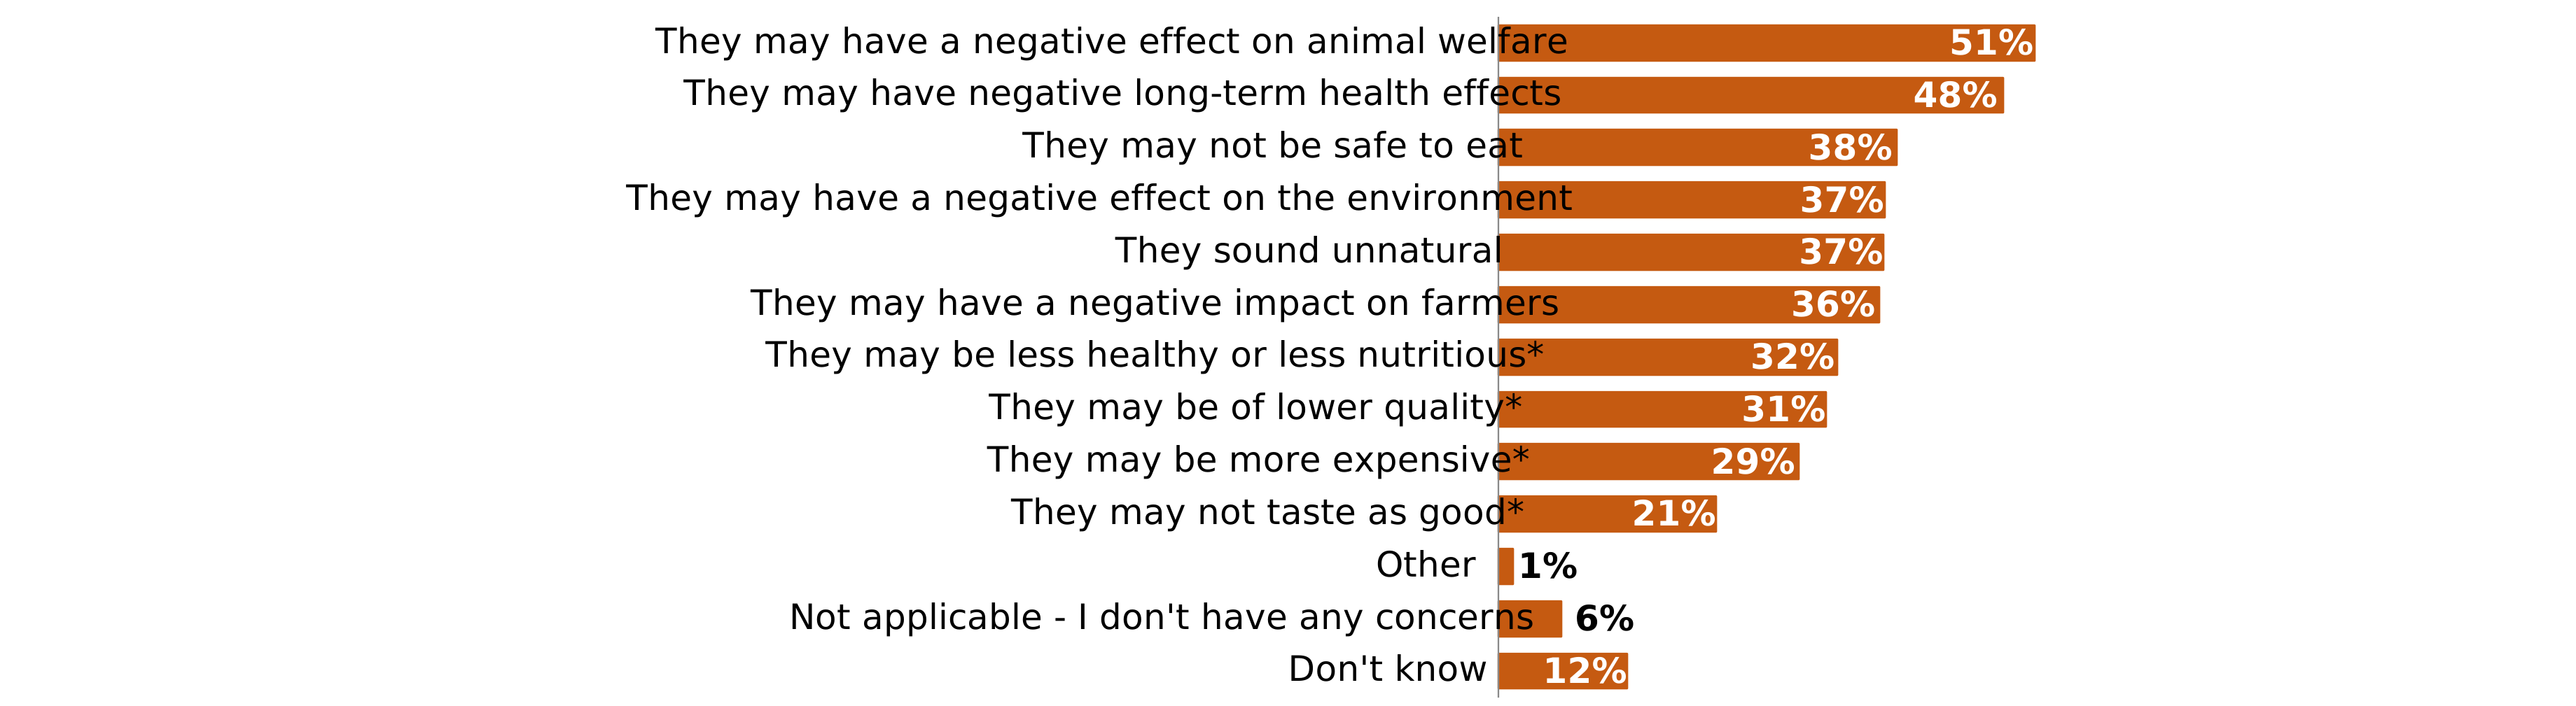
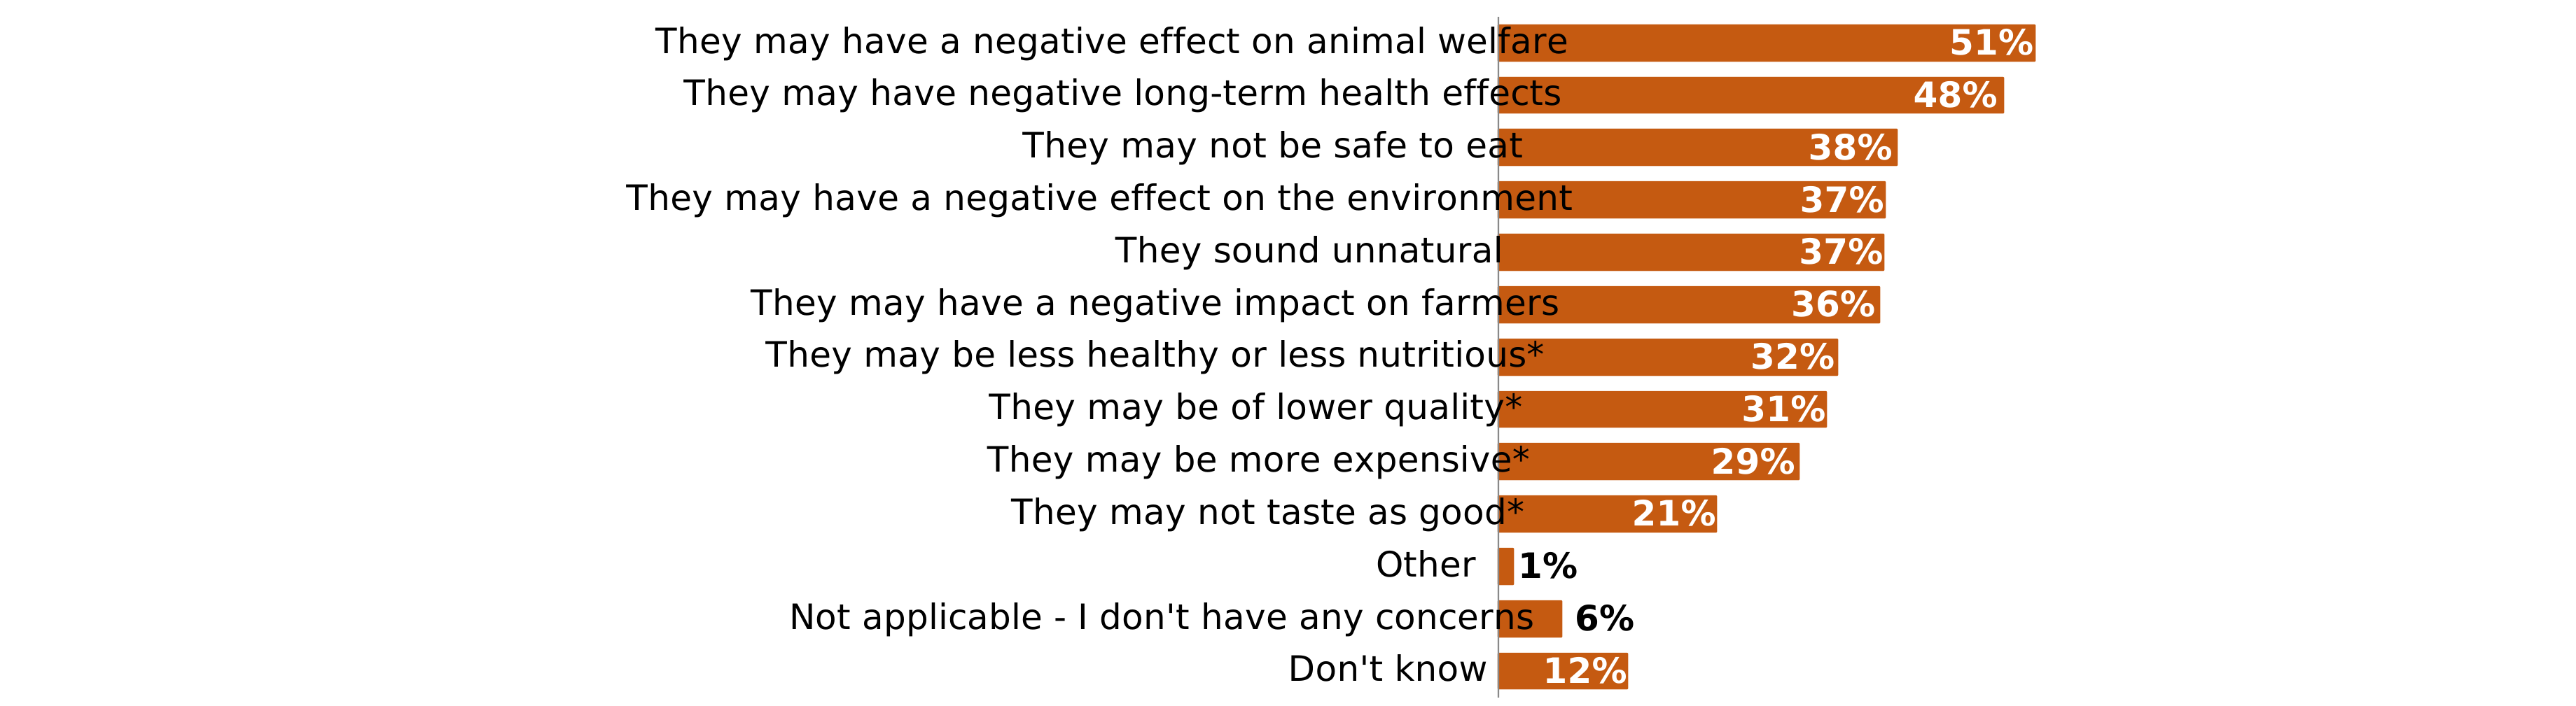
The most commonly selected concerns about precision bred food products were potential negative impacts on animal welfare (51%), and potential long-term health effects (48%), as shown in Figure 12.
3.6. Precision fermentation
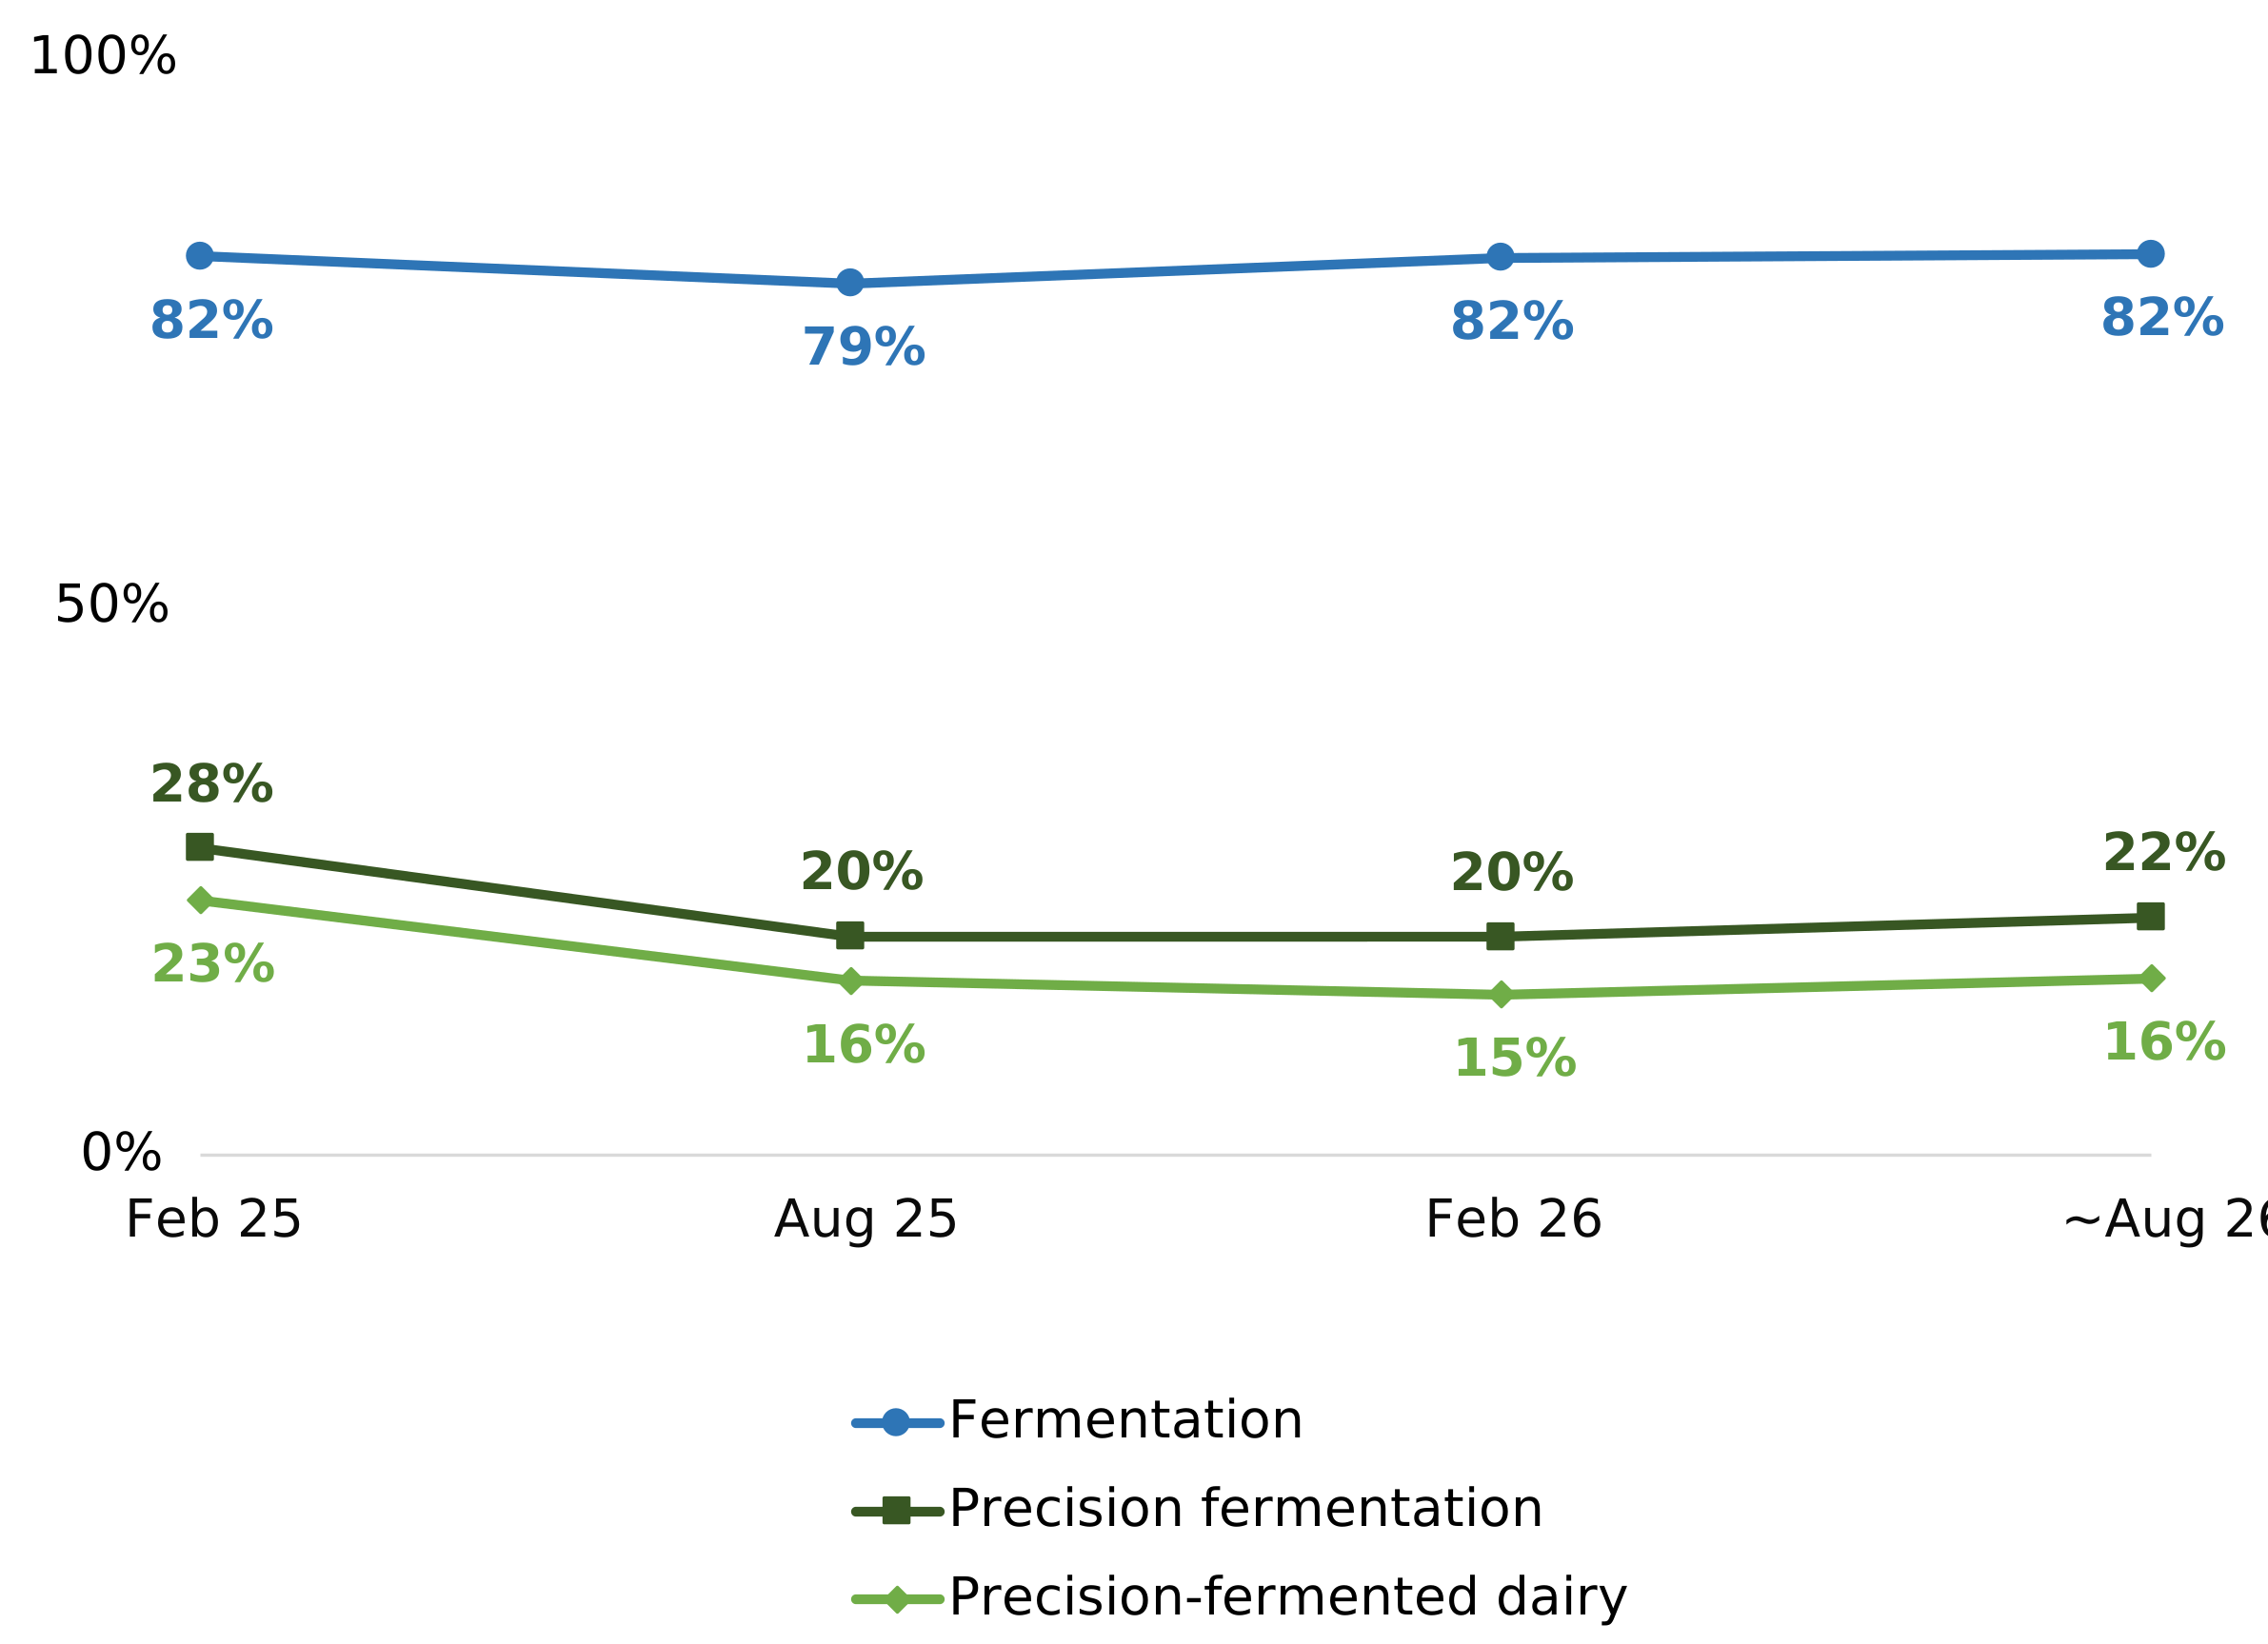
Figure 13 shows that when prompted with a definition, respondents in August 26 were most likely to have heard of fermentation (82%), compared to just 22% who had heard of precision fermentation and 16% who had heard of precision-fermented dairy.
The proportion who had heard of each term was consistent with February 26, when this question was last asked.
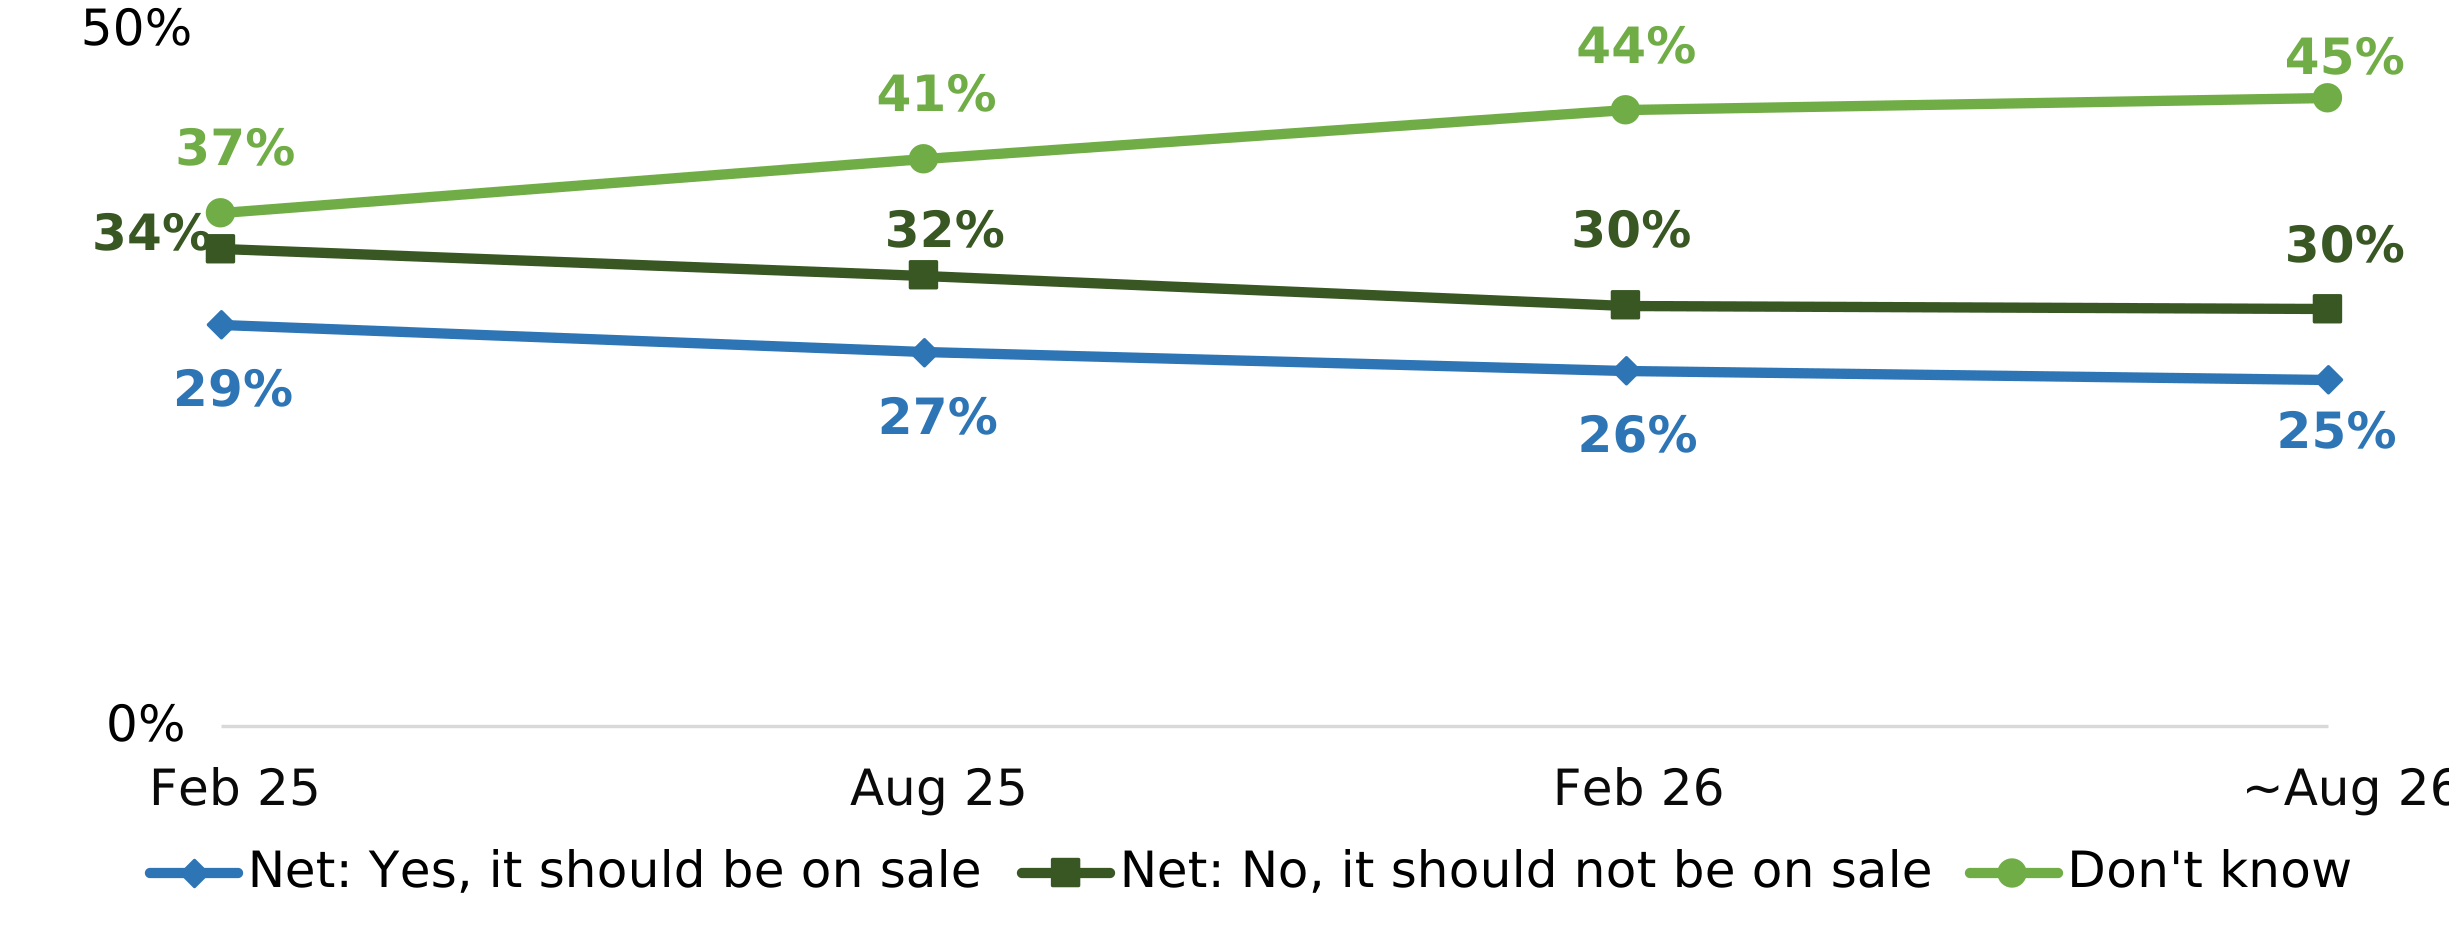
In August 26, slightly more respondents said precision-fermented dairy should not be sold in future (30%) than said it should (25%), while 45% said they didn’t know (Figure 14). Those reporting they ‘don’t know’ has increased slightly since tracking began in February 25.
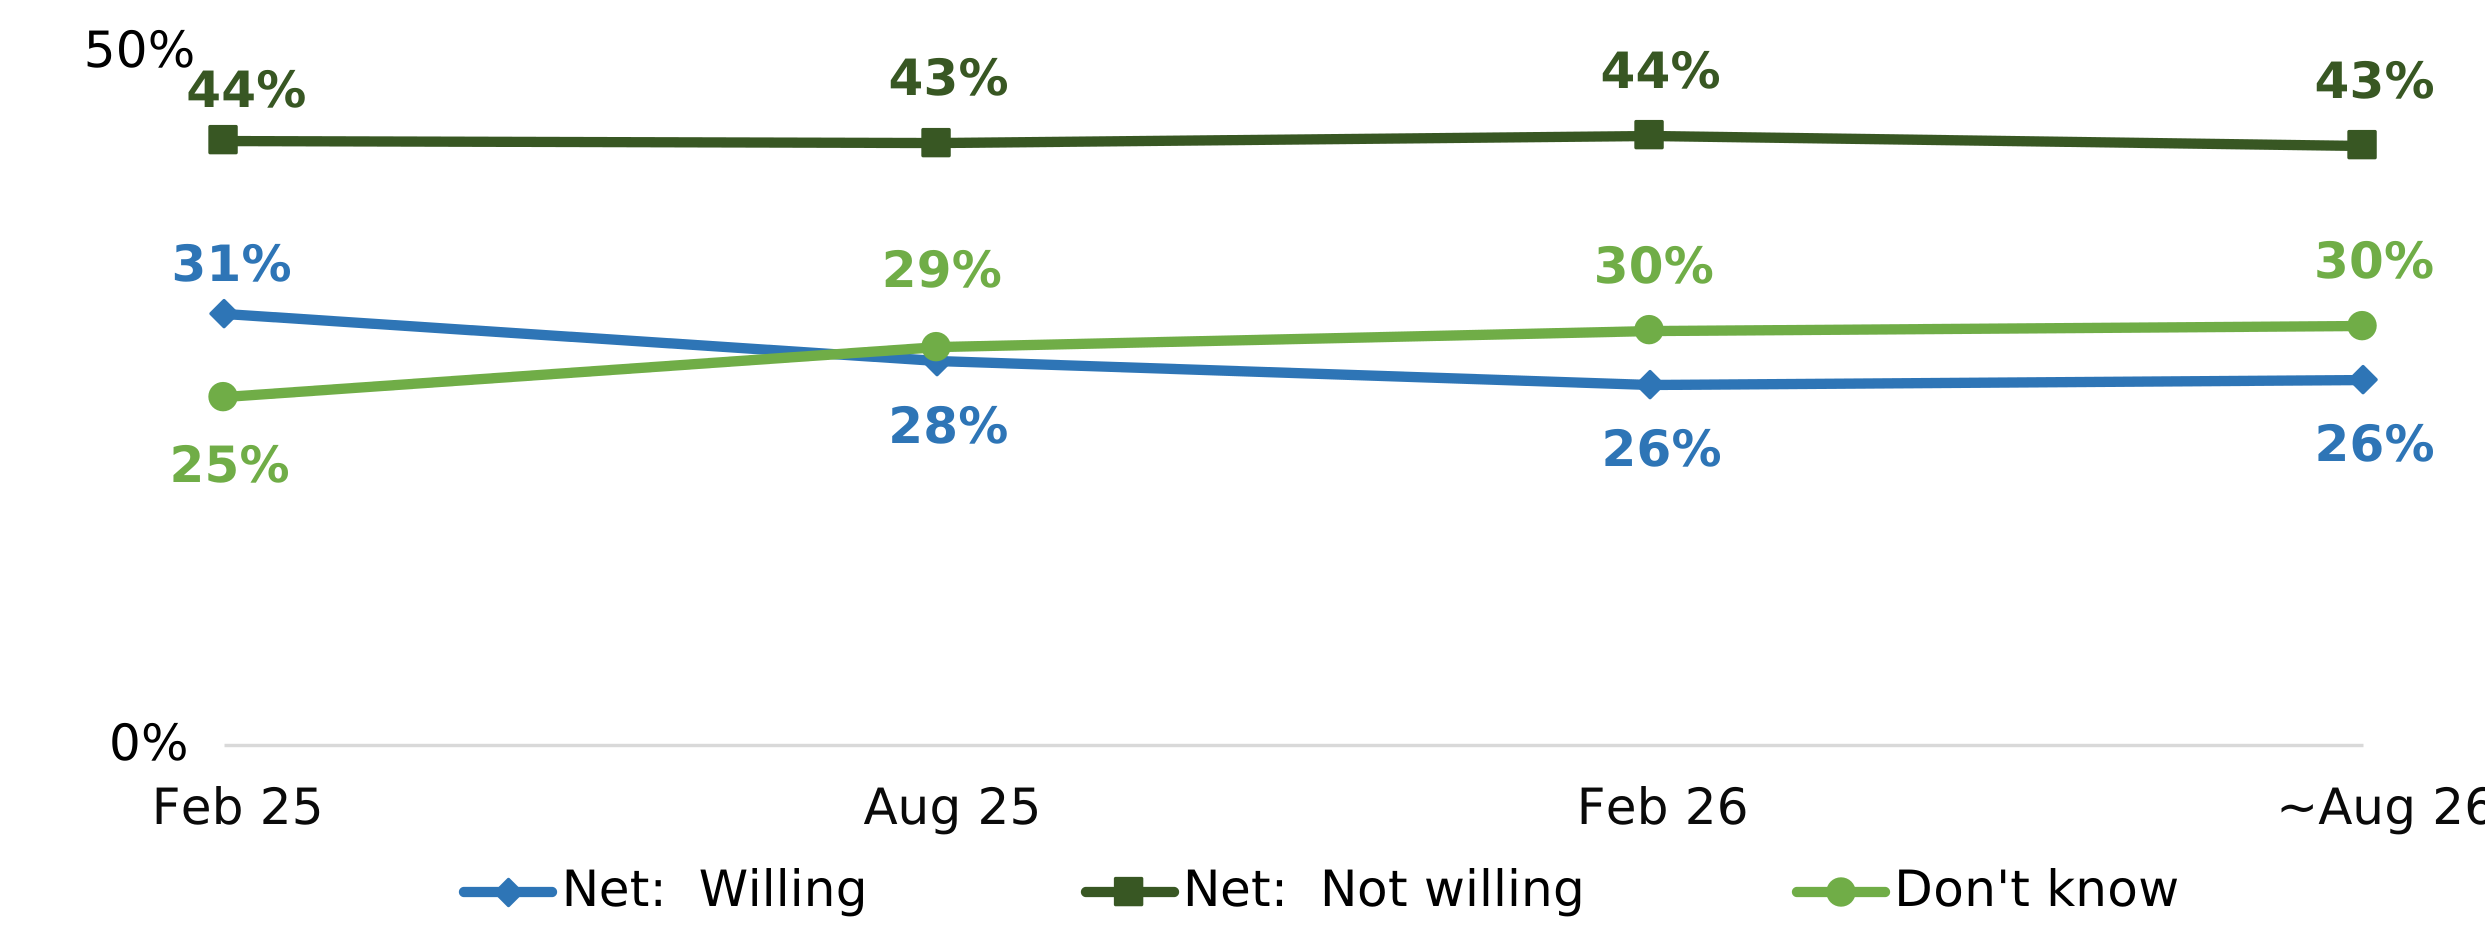
Similarly, more respondents said they would be unwilling (43%) than willing (26%) to include precision-fermented dairy in their diet, while 30% said they didn’t know (Figure 15). The proportion saying they ‘don’t know’ has increased slightly since February 25.
All findings in August 26 for these two questions were comparable with the previous wave (February 26).
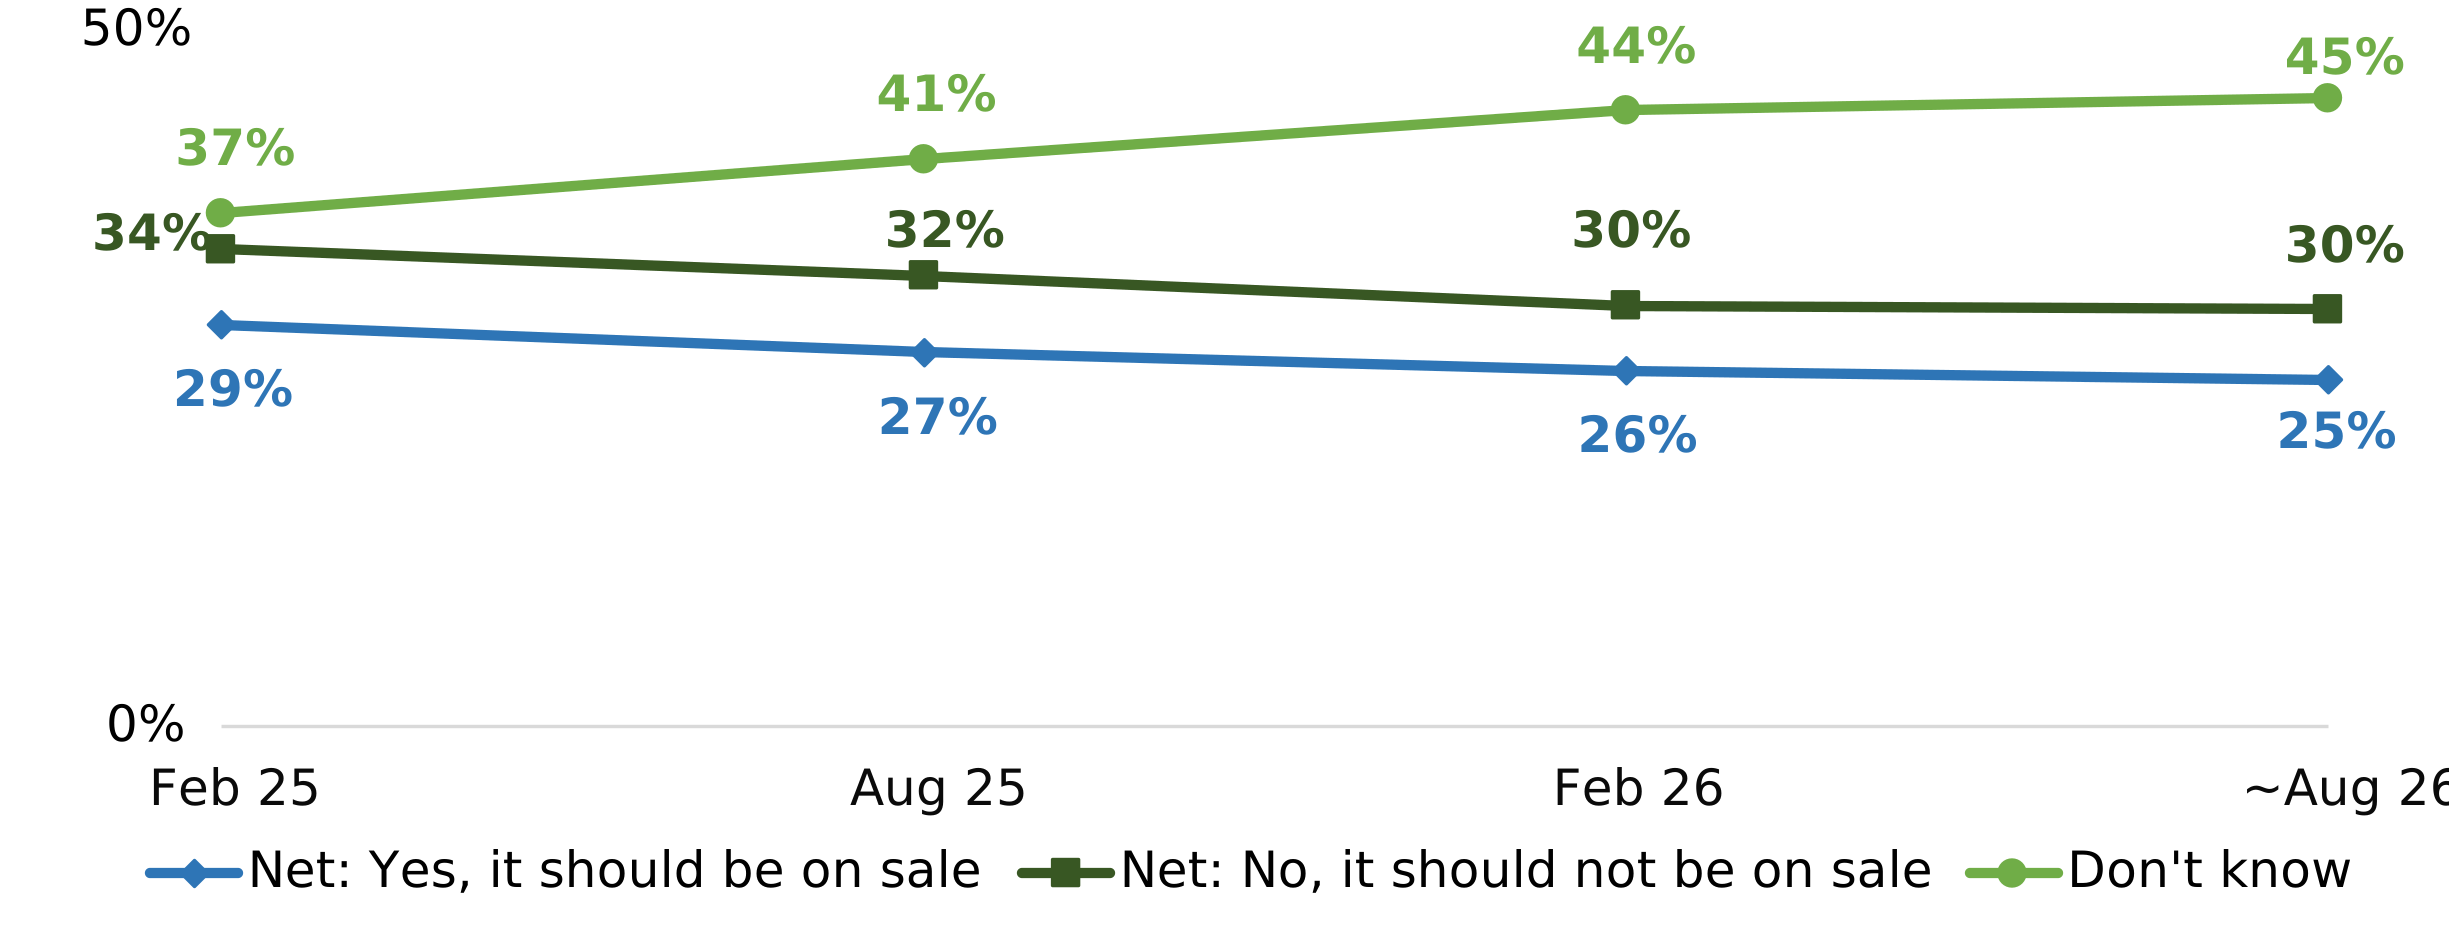
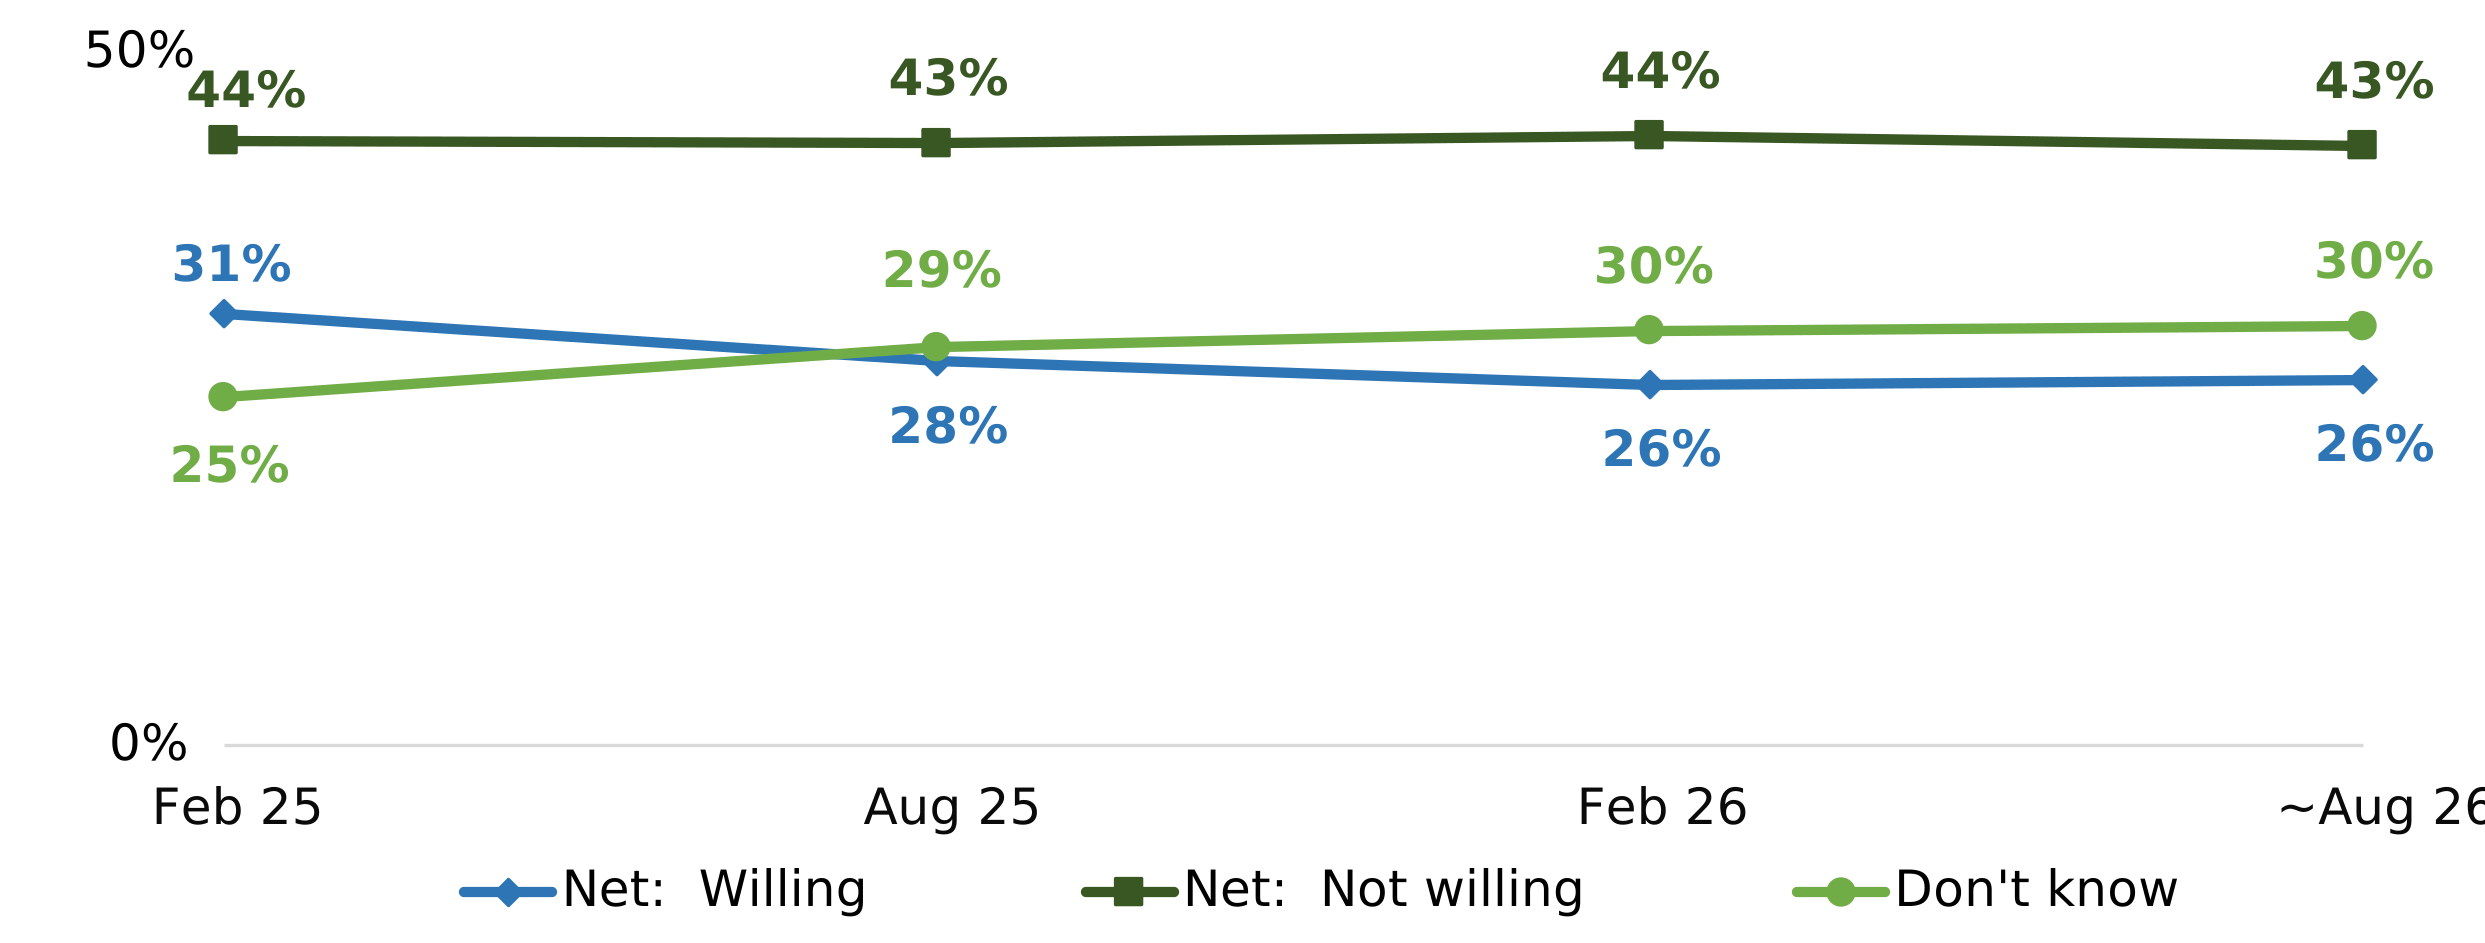
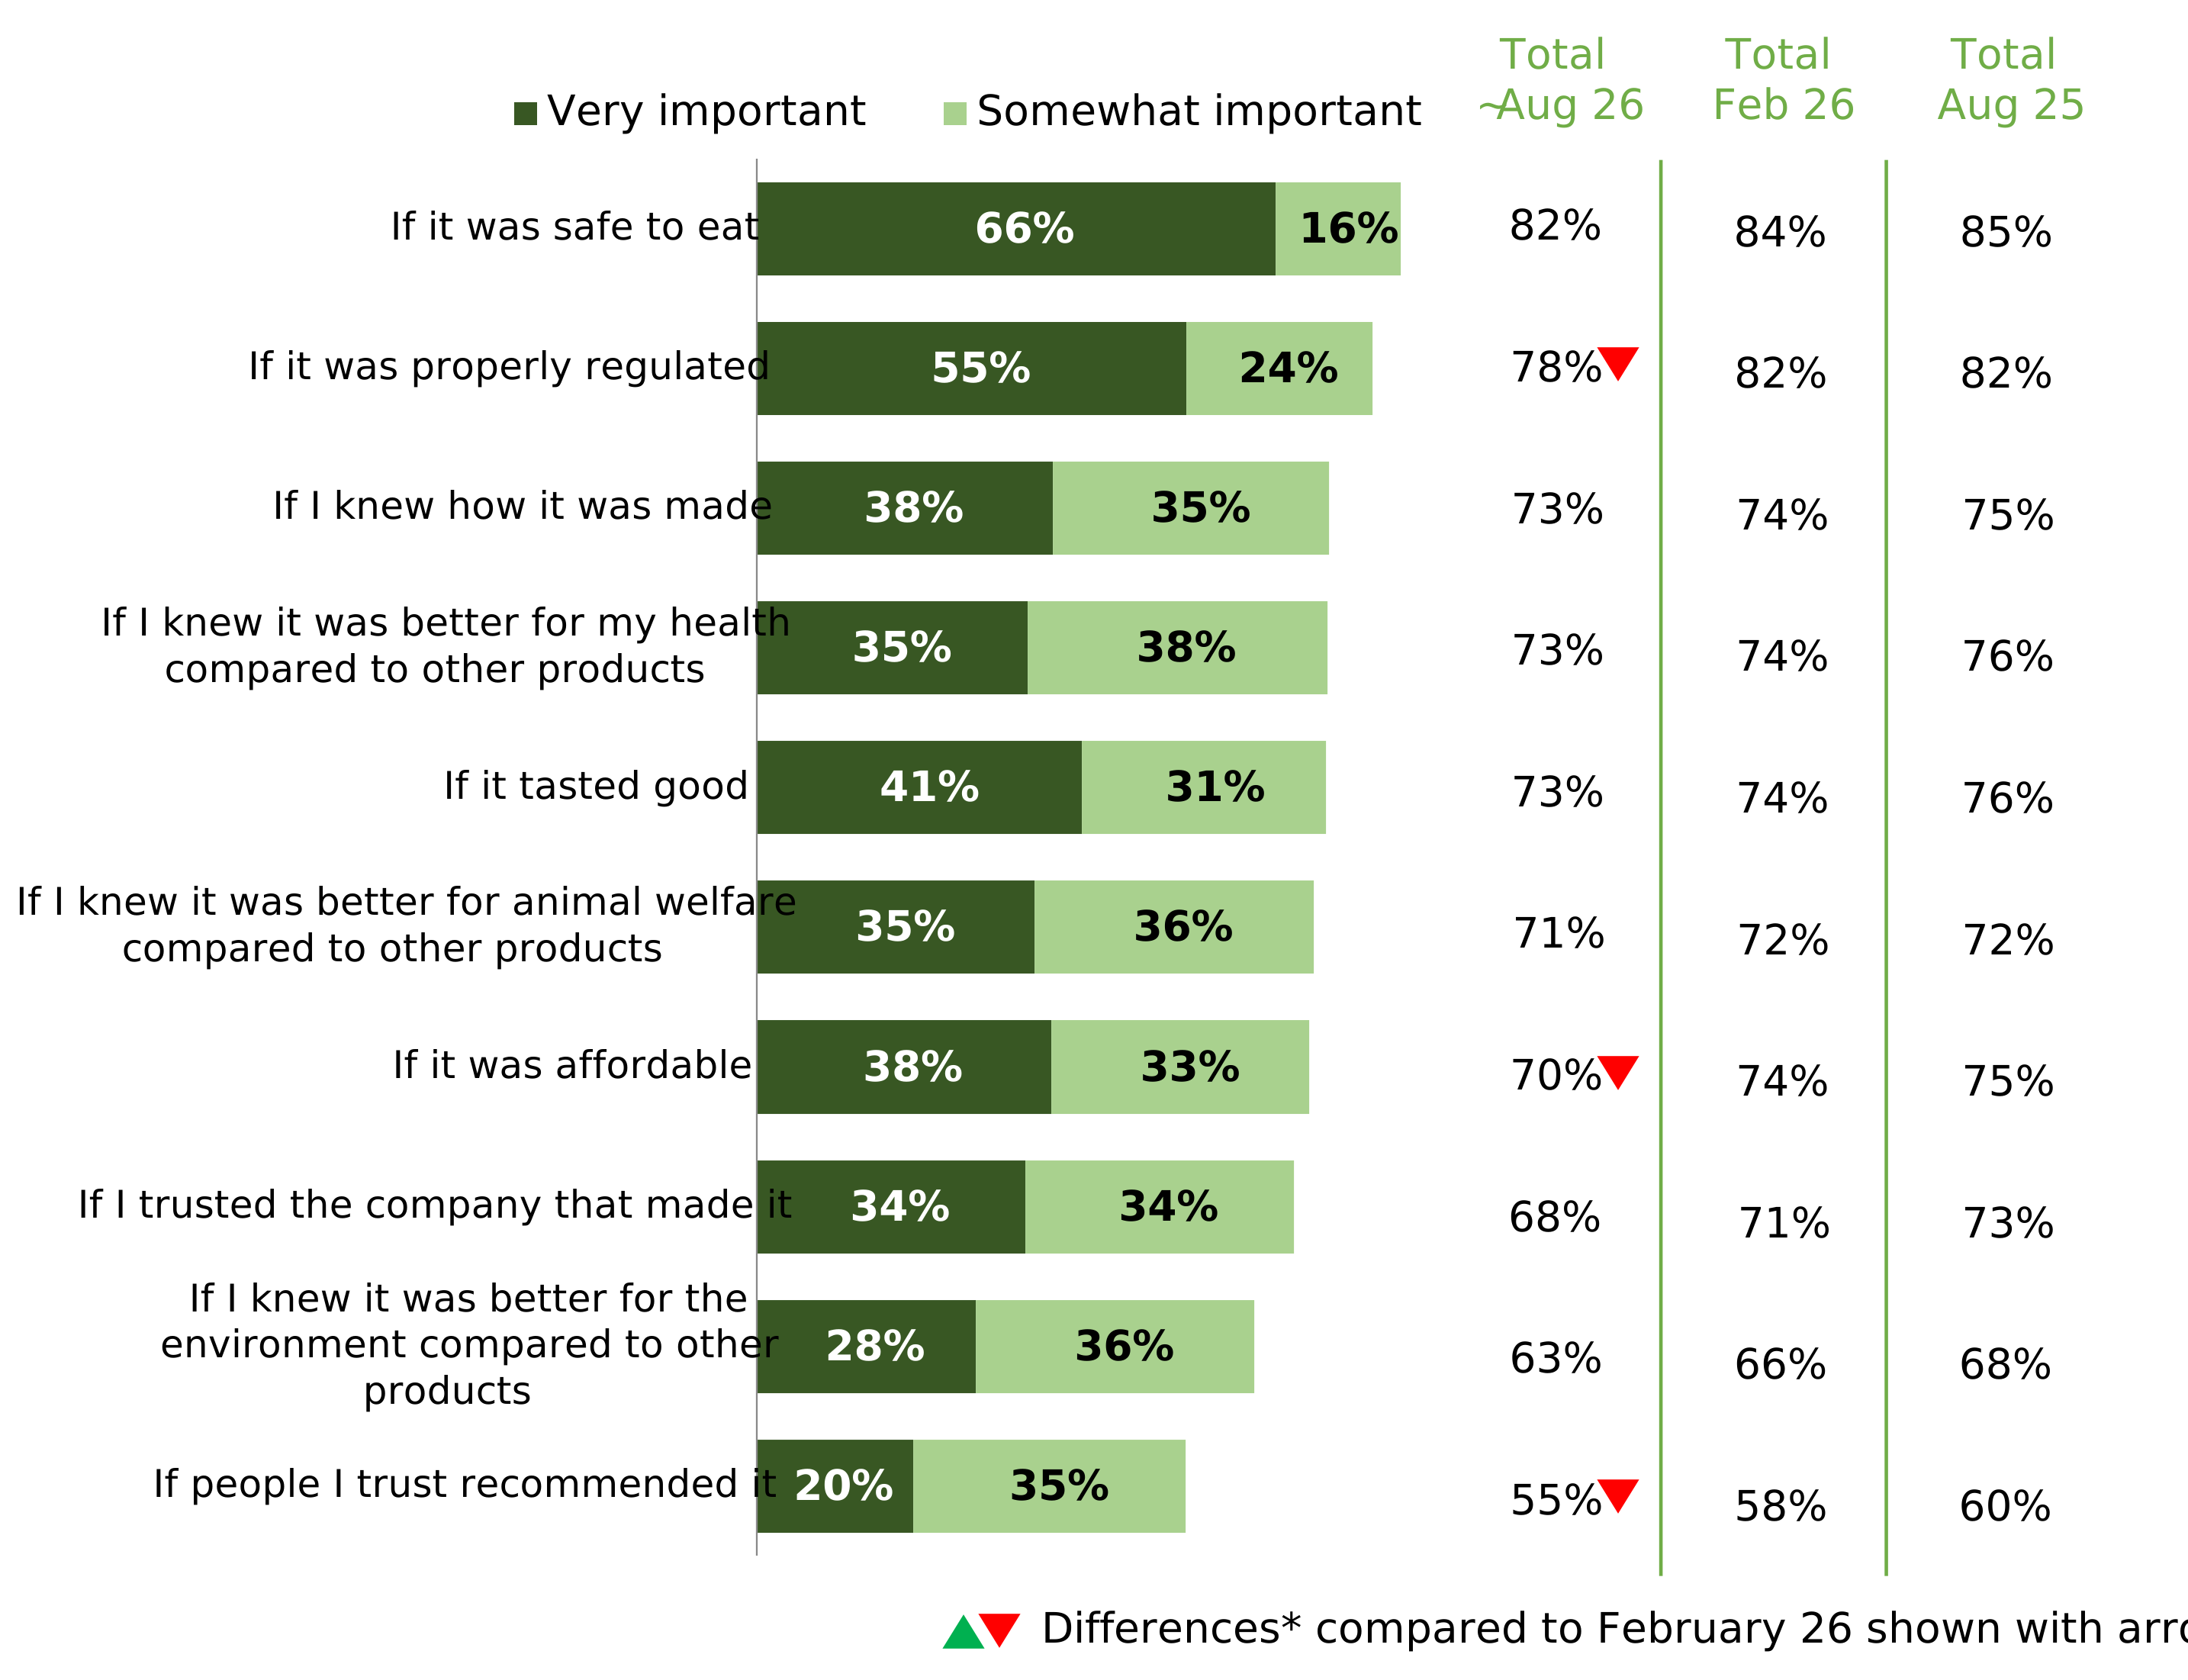
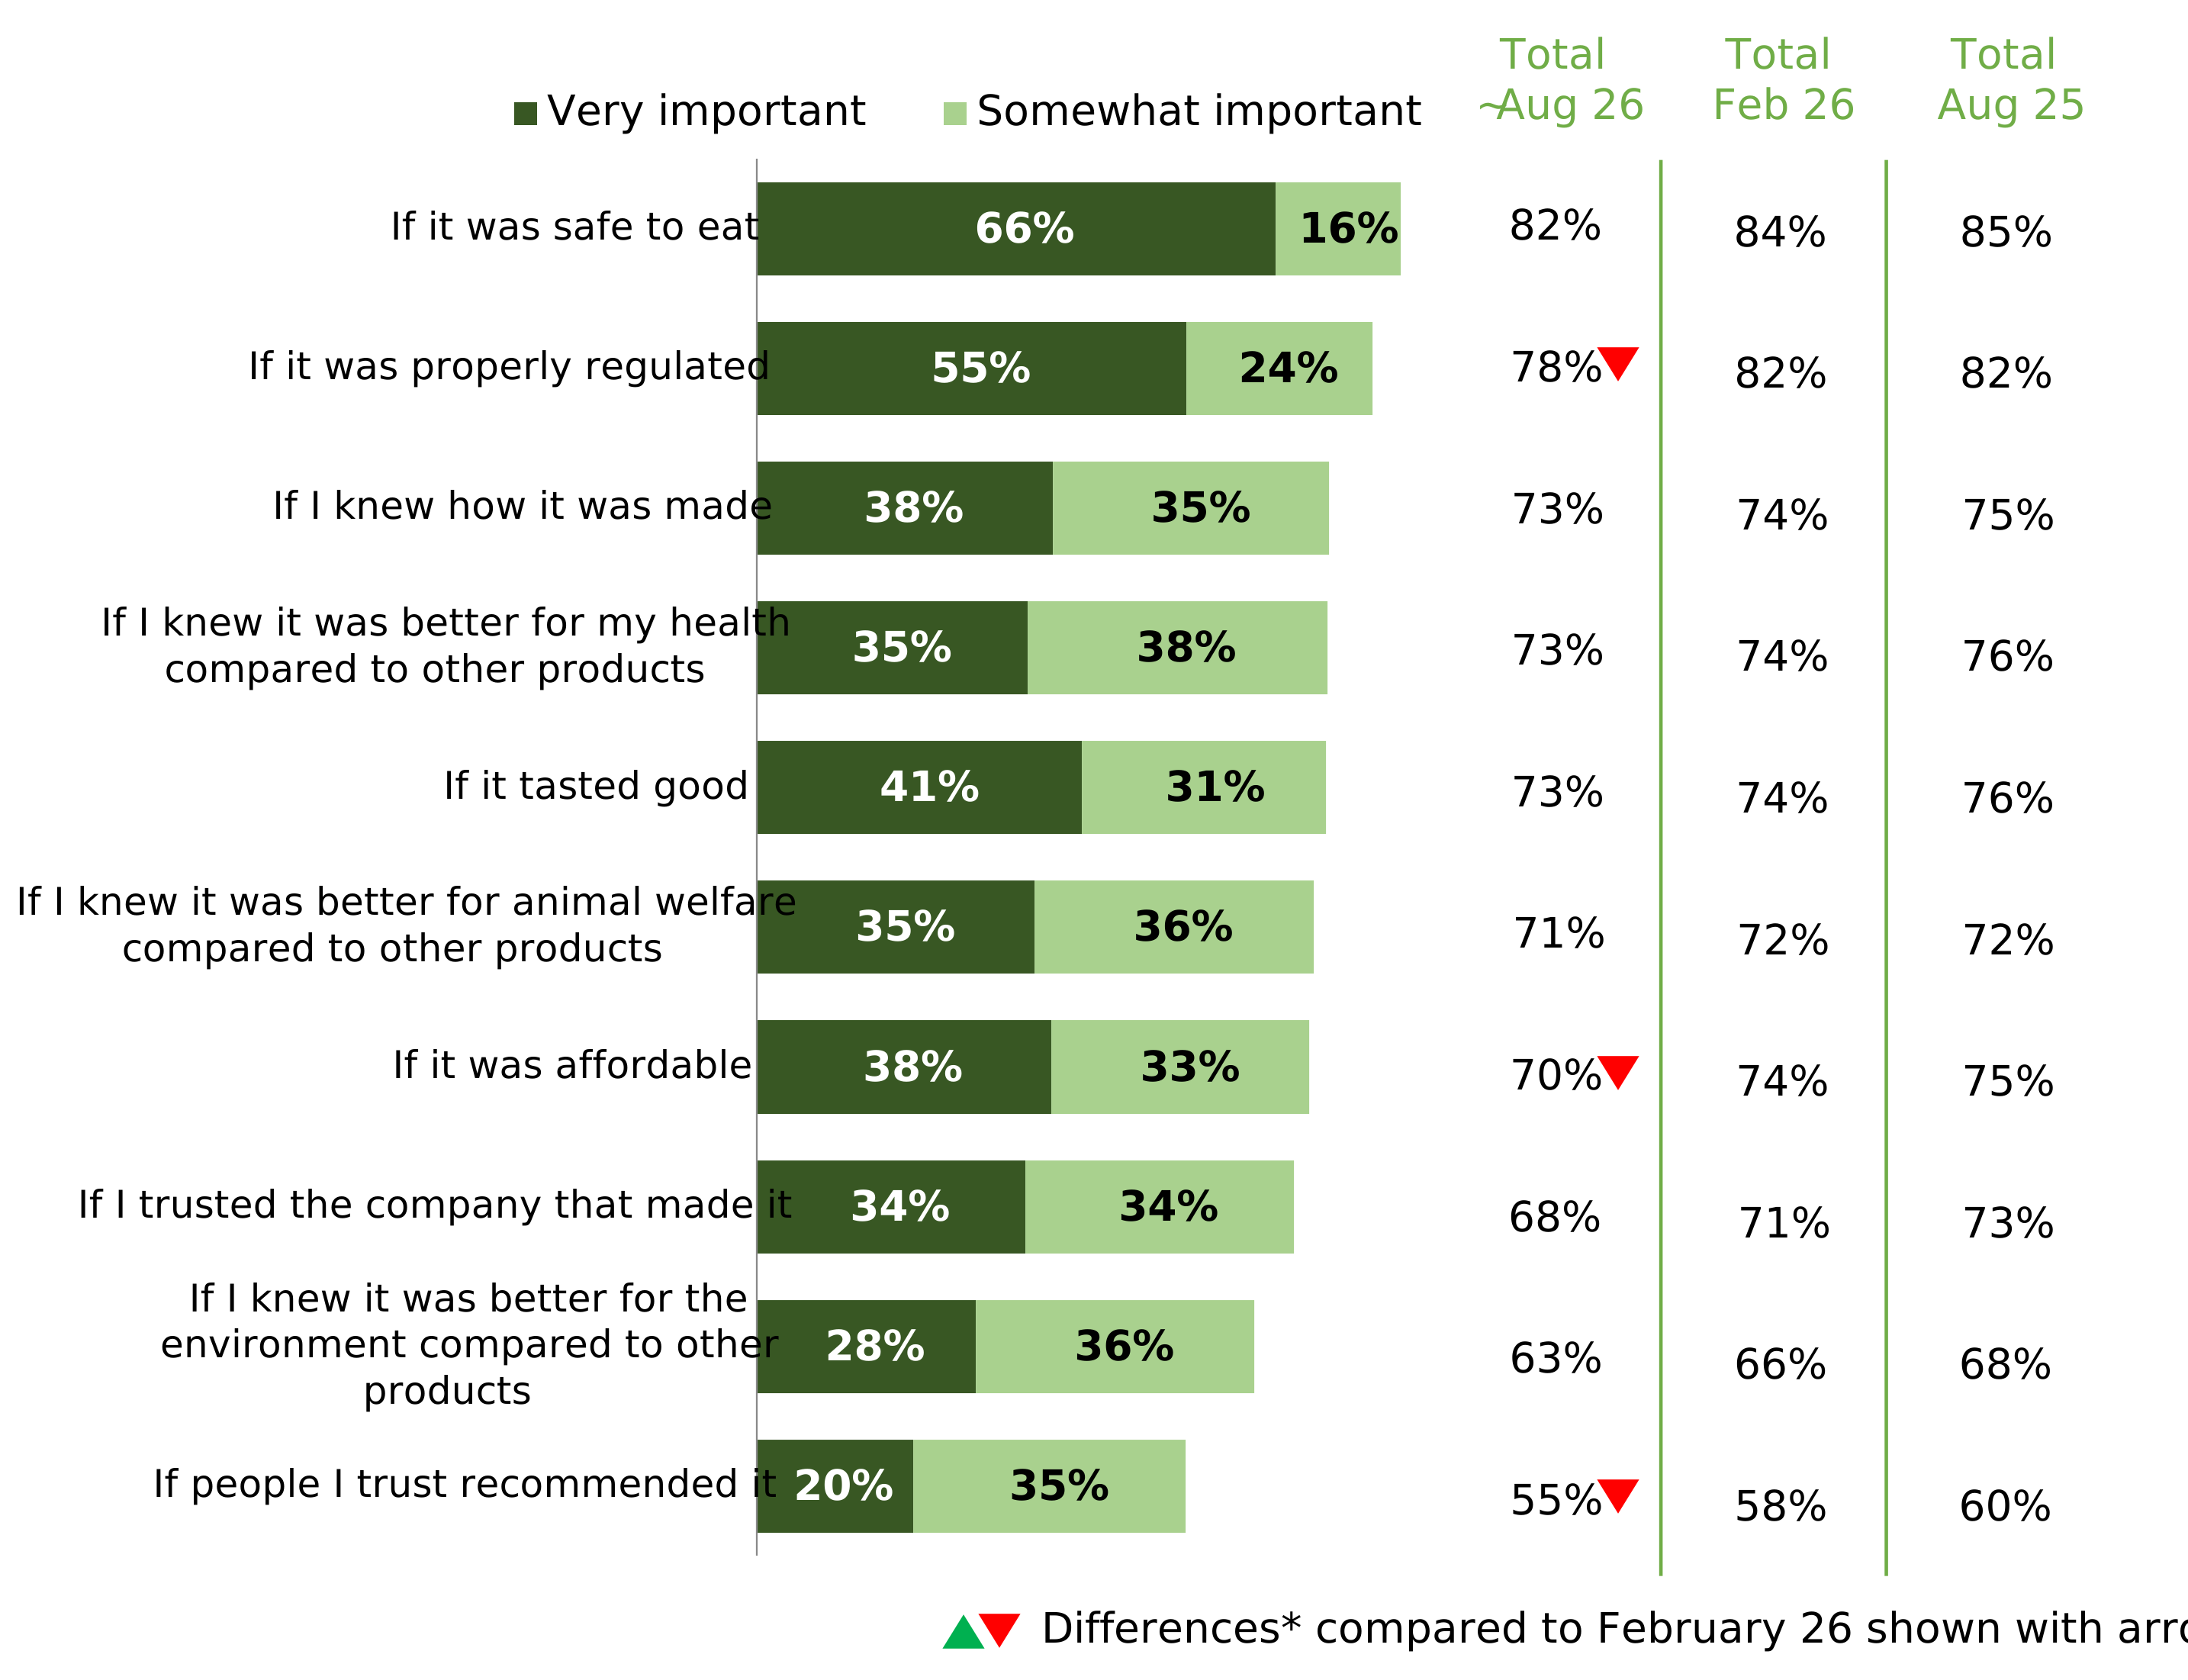
Figure 16 shows that in August 26, safety (82%) and proper regulation (78%) were the most important factors respondents said would influence their decision to buy precision-fermented food. These have consistently ranked as the top two factors.
Further information
For more information:
-
Visit our Consumer Insights Tracker webpage
-
Contact the FSA’s Analytics Unit
Acknowledgements
FS code FS900280